earth systems lecture 15
1/30
There's no tags or description
Looks like no tags are added yet.
Name | Mastery | Learn | Test | Matching | Spaced |
|---|
No study sessions yet.
31 Terms
The Structure of the Atmosphere
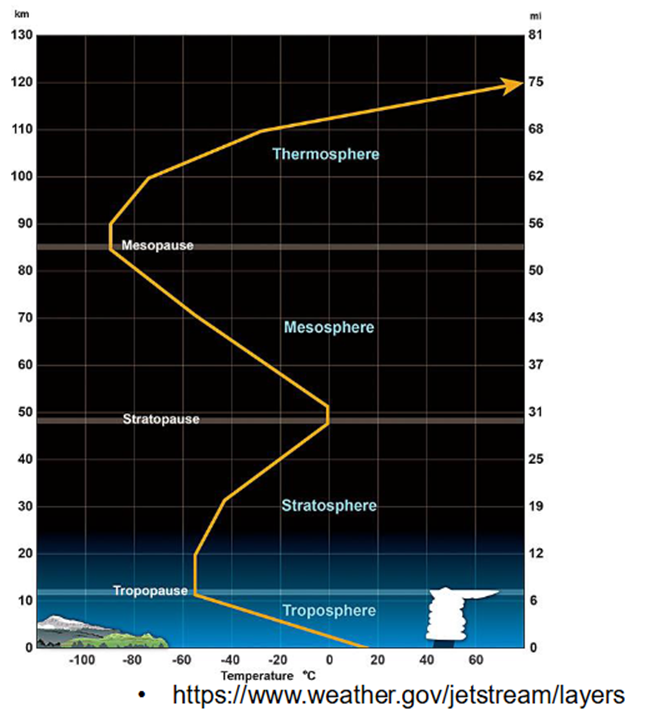
Trophoshere
• Almost all ‘weather’ takes place in the lowest layer of the atmosphere
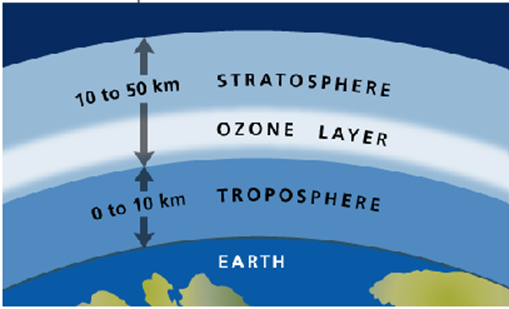
• Surface to around 10 km in height
• Troposphere contains up to 80-90% of the mass of atmosphere
• Made up of (78.08% nitrogen, 20.95% oxygen, 0.93% argon, 0.05% carbon dioxide, water vapour variable)
• On average there is a steady drop in temperature with height ‘lapse rate’ - more on lapse rates - next slide
• The troposphere is generally unstable and well-mixed by convective air currents
• The tropopause is the top of the troposphere - marked by stable layer of constant temperature, and temperature inversion above
Lapse Rates
• The rate of change in atmospheric temperature as it decreases with height is known as a lapse rate
• Dry Adiabatic Lapse Rate (DALR), the lapse rate of dry air is 9.8ºC/km
• Moist Adiabatic Lapse Rate (MALR), the lapse rate of saturated air varies with temperature, but is around 5ºC/km
• The Environmental Lapse Rate (ELR), the lapse rate on avarege in the atmosphere is set at 6.5ºC/km – but this is idealised!
• What happens when air warms with height? An inversion
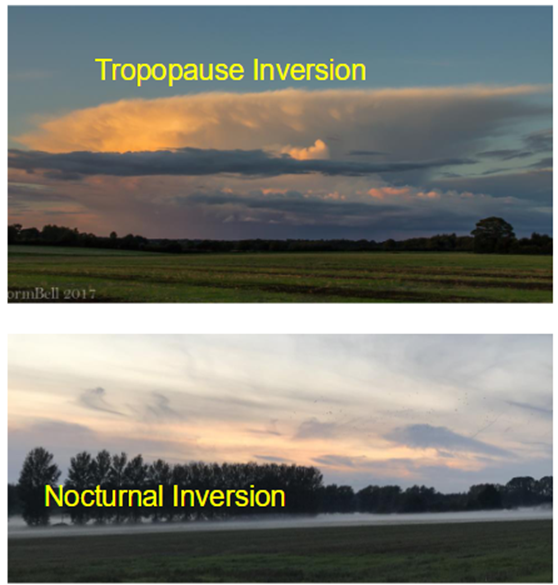
Inversion
• An inversion is an increase in temperature with height
• Happens at times within the tropopause due to variable weather conditions (search Spanish Plume)
• Nocturnal inversions in autumn caused by rapid loss of long wave radiation near
ground level
• Most commonly thought of as what occurs at the tropopause
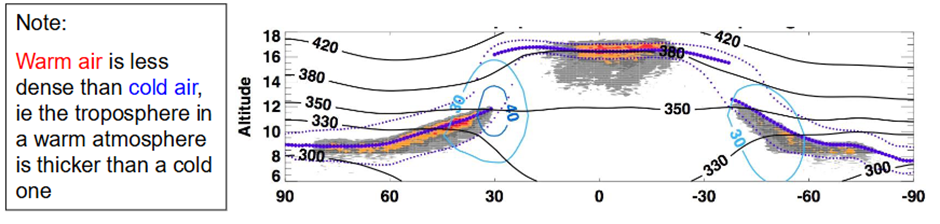
The Tropopause
Tropopause: Stable atmospheric layer of constant temperature at top of troposphere.
Height of tropopause varies with latitude; highest in the tropics, and lowest at Poles
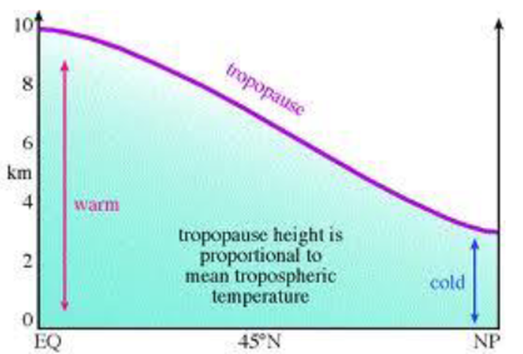
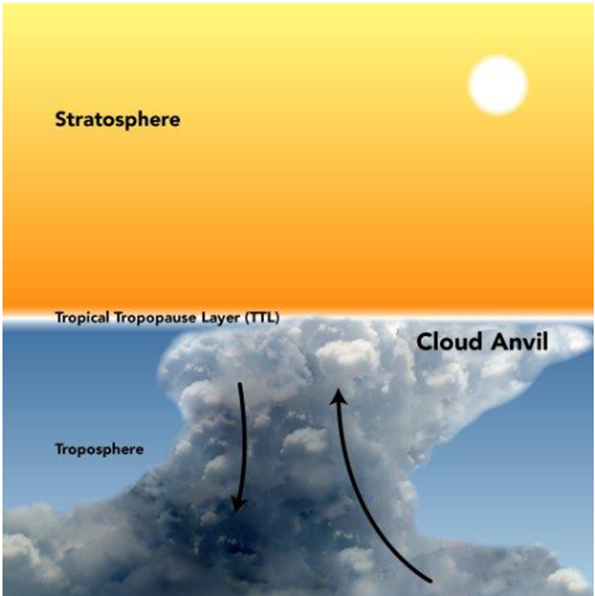
•The tropopause can be ‘seen’ at the top of tall cumulus clouds, and also when looking down from aircraft.
•The flat tops of cumulonimbus clouds mark the tropopause.
The Stratosphere
• Above the troposphere is the stratosphere – about 10km to 50km about the Earth
• Stable (stratified) atmospheric region; poorly mixed (vertically); but strong zonal winds
• Makes up about 10-20% of the Earth’s atmosphere
• Temperature increases through the stratospheric layer due to ozone
• Ozone Heating causes increase in temperature with height. Temperatures at the bottom of the stratosphere can be as low as -60ºC, while at the top of the stratosphere “the stratopause” near 0ºC.
• Ozone (O3) absorbs and thus protects us from harmful UV radiation
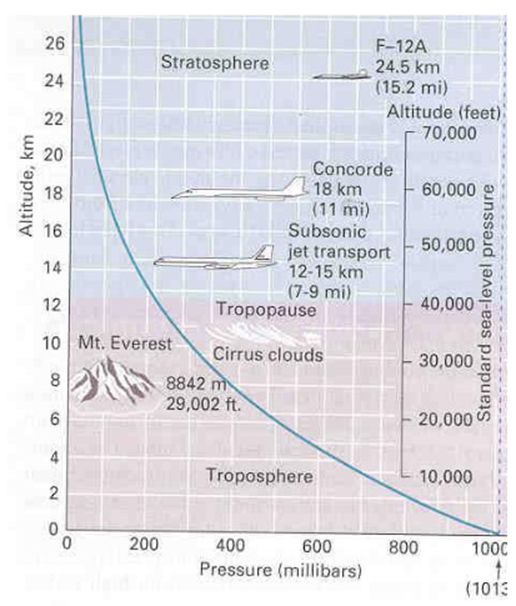
• Commercial aircraft cruise at this altitude (less air/drag means they are more fuel efficient)
• “Over shooting tops” of supercell thunderstorms, and volcanic eruptions occasionally penetrate into the bottom of the stratosphere
•Sudden stratospheric warming is now being studied as a major influence in blocking patterns in winter, which can lead to anomalous cold spells
Nacreous cloud – Polar Stratospheric cloud
• Occur in the lower stratosphere
• Only occur with temperatures below -78C
• Only visible in high latitudes, generally in the winter months in twilight (about 1-6º above the horizon)
• They support chemical reactions which are implicated in ozone depletion / the ozone hole
The Stratopause
• The top of the stratosphere, whereby above this zone, the temperature begins to fall again into the mesosphere
• Atmospheric pressure here is around 1mb
• Temps around 0ºC
The Mesosphere
• Above the stratosphere is the mesosphere – about 50km to 100km about the Earth
• Here ozone diminishes, and thus temperatures cool though the layer
• Strong zonal east-west winds are found here, known as atmospheric tides
• Gravity waves from the atmosphere below propagate upwards to this layer and dissipate (part of what drives the global circulation)
• Lies above the height that aircraft fly and below the height of satellite orbits,
therefore it’s the least studied layer of the atmosphere
• Large-scale electrical discharges above active thunderstorms, knowns as red sprites occur in this layer
• Meteors burn up in this part of the atmosphere
• Very little moisture found here, but noctilucent cloud near the top of the mesosphere can sometimes be seen in the upper latitudes
The Mesopause
• The boundary between the mesosphere and the thermosphere
• The coldest place in the Earth’s atmosphere with temperatures as low as -140ºC
The Thermosphere
• Above the mesosphere is the thermosphere – about 100km to 500km about the Earth
• The atmosphere / gas in this layer is extremely thin, only about 0.1% of the mass of total atmosphere.
• Temperature increases with height due to absorption of solar radiation by atmospheric molecules, and accompanying heat releasing dissociation reactions
• Molecules start being broken up into individual atoms by very short wavelength ultraviolet light from the Sun, and further up the atoms are ionized. These processes make the thermosphere very hot at high altitudes (although with very little energy content because the density is so low)
•Aurora happens in this level of the atmosphere
• International Space Station (408km) and other satellite orbit in this layer, many of the other satellites extend into the lower exosphere.
Thermopause/exobase
• The boundary between the thermosphere and the exosphere
• The thermopause is defined as the the atmospheric boundary of the Earth’s energy system
• The solar constant can be measured here, as below this into the thermosphere insolation begins to occur
• This height is variable depending on solar activity (500km to 1000km)#
The Exosphere
• The exosphere is thin envelope of the lightest gases, hydrogen and helium above 500km/1000km extending into interplanetary space
• Gas molecules are not gravitationally bound to Earth near the bottom of the exosphere, but they are spread too far apart to ever interact with each other
Pressure and Altitude
• Pressure at a point in the atmosphere depends on the weight of the air above, and so decreases approximately exponentially with height.
• At sea level, pressure is ~1000mb (or 1000 hPa) and decreases by 1mb for every 10m in height
• In the oceans, pressure increases by ~1000mb (1 atmosphere) for every 10m depth
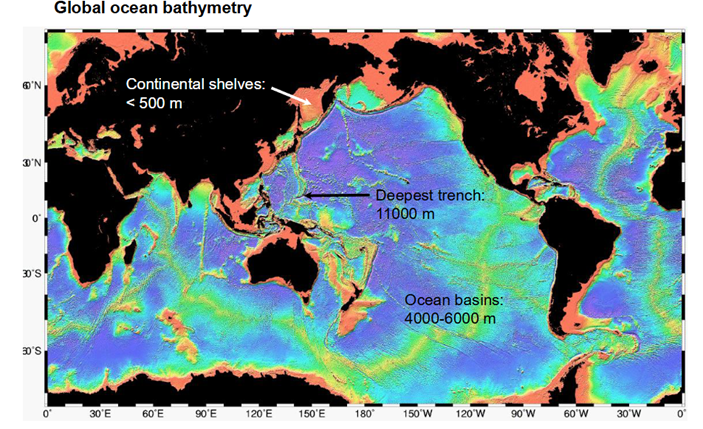
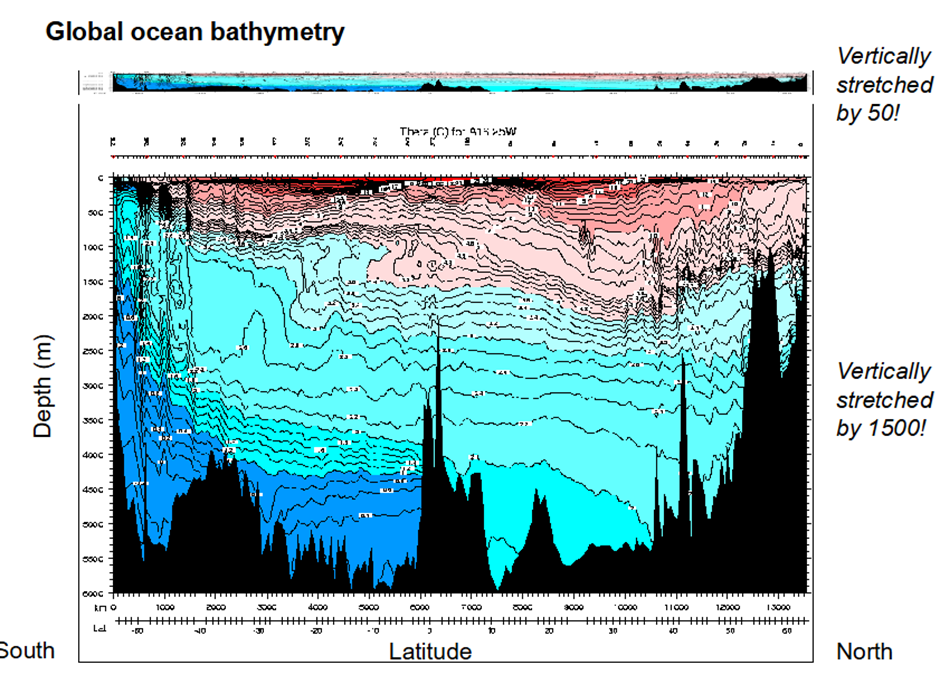
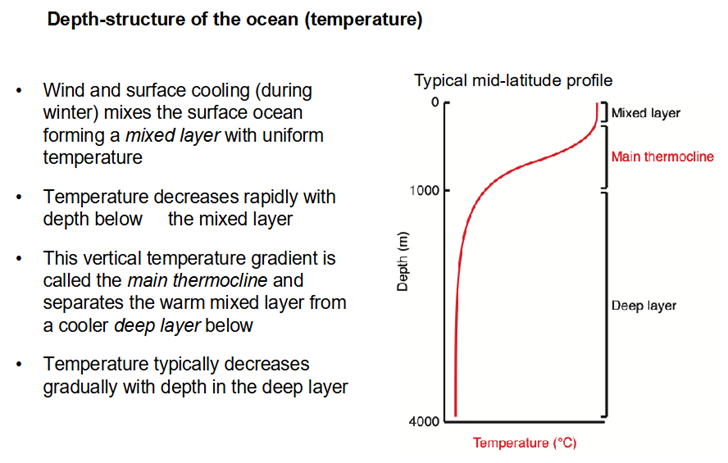
The Structure of the Ocean
• Constraints of bathymetry
• Exchange of heat (sensible and latent)
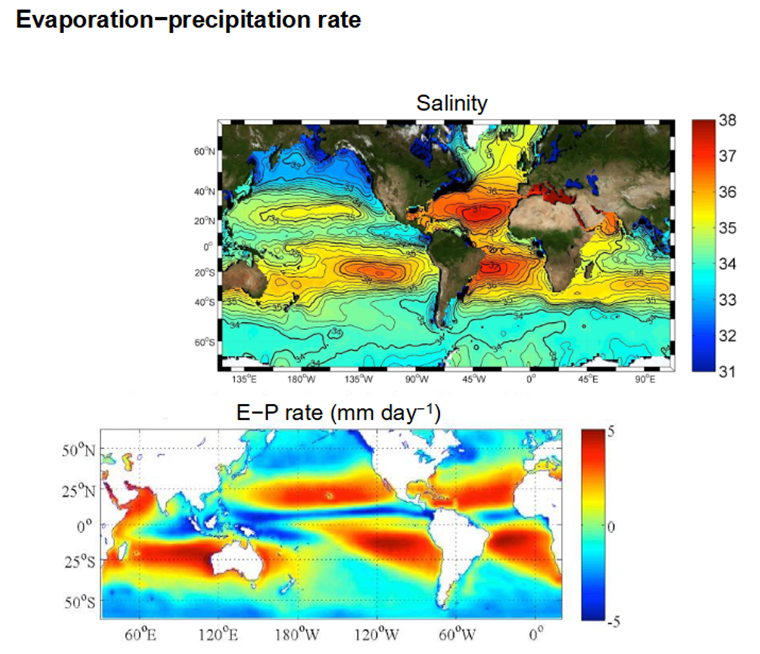
• Exchange of freshwater (precipitation and evaporation)
• Natural forces (gravity, pressure, Earth’s rotation)
• Exchange of momentum (wind)
• Input of freshwater and dissolved compounds by rivers
• Exchange of gases with the atmosphere
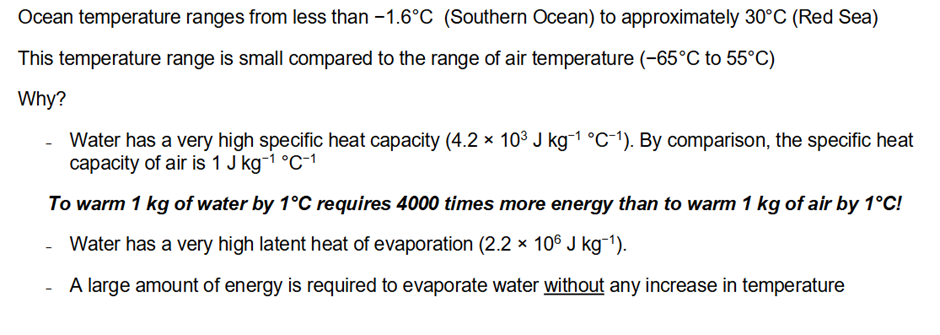
Ocean vs Atmospheric Temperature
Global Sea Surface Temperature
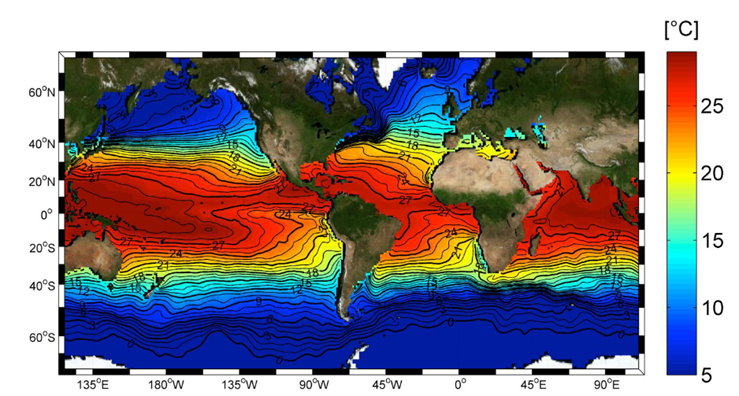
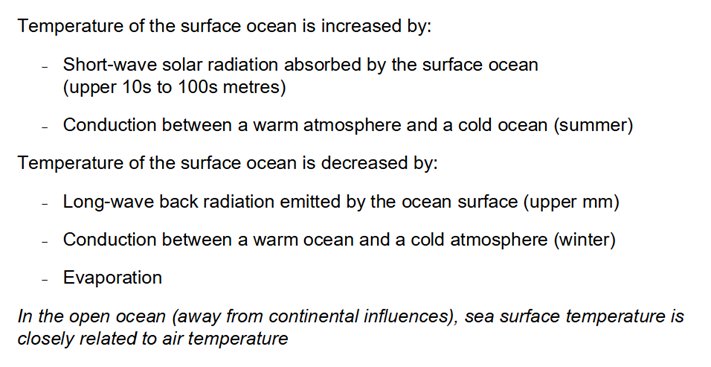
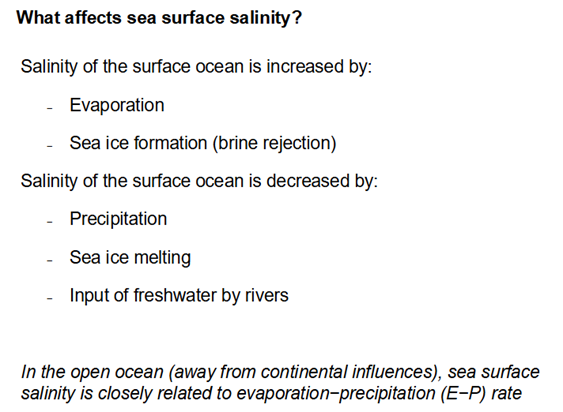
What affects Sea Surface Temperature
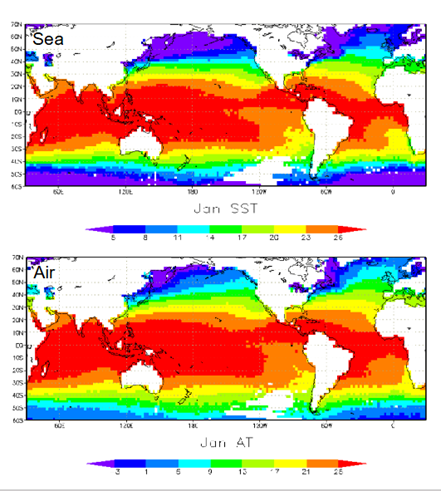
Sea Surface Temp Vs Air Temp
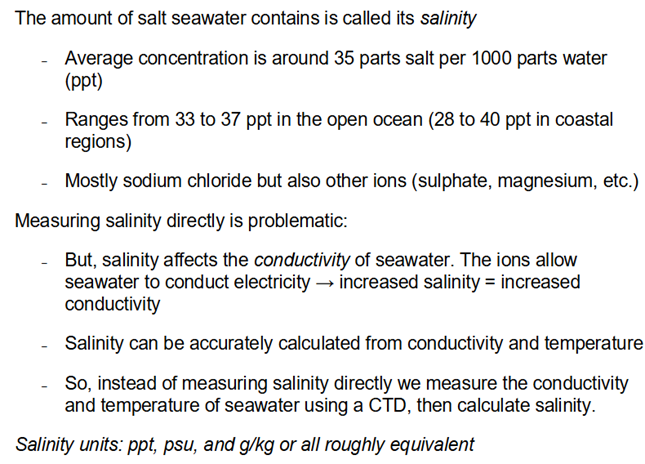
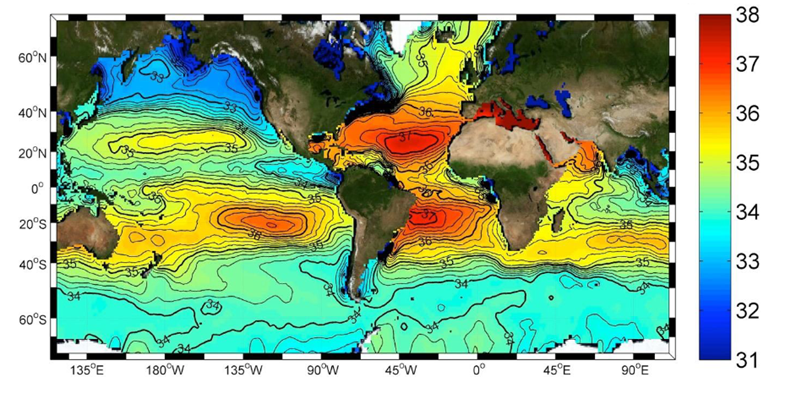
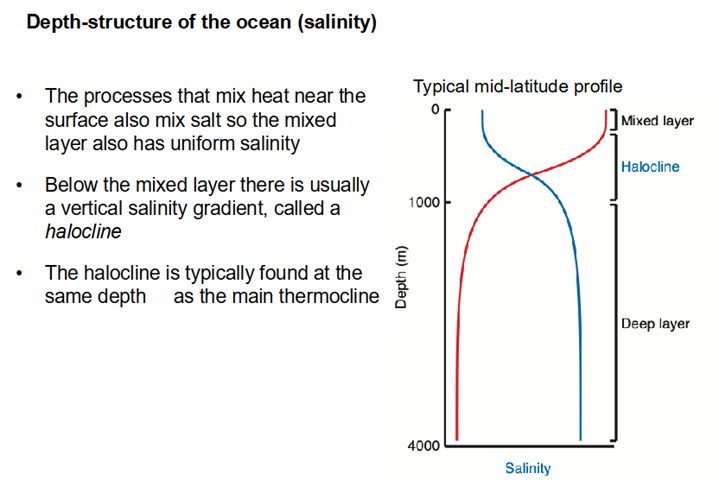
Ocean Salility
Global Sea Surface Salinity
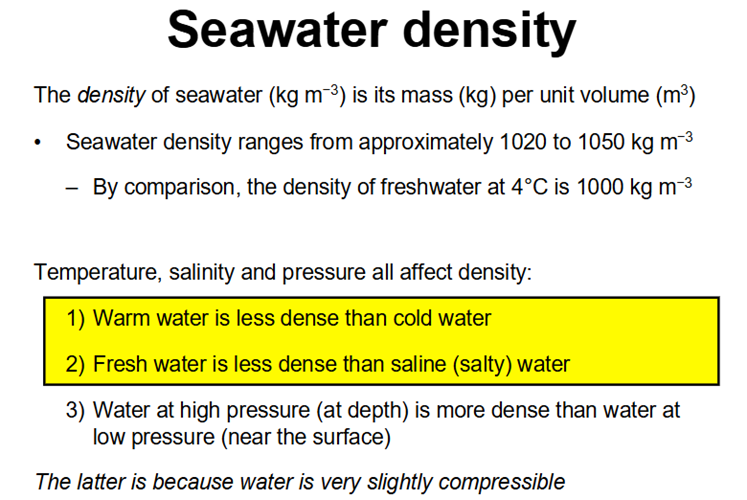
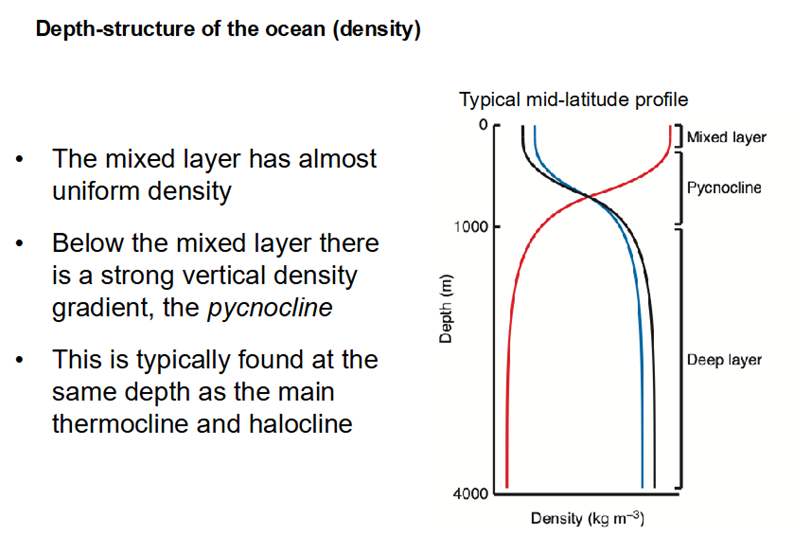
Seawater
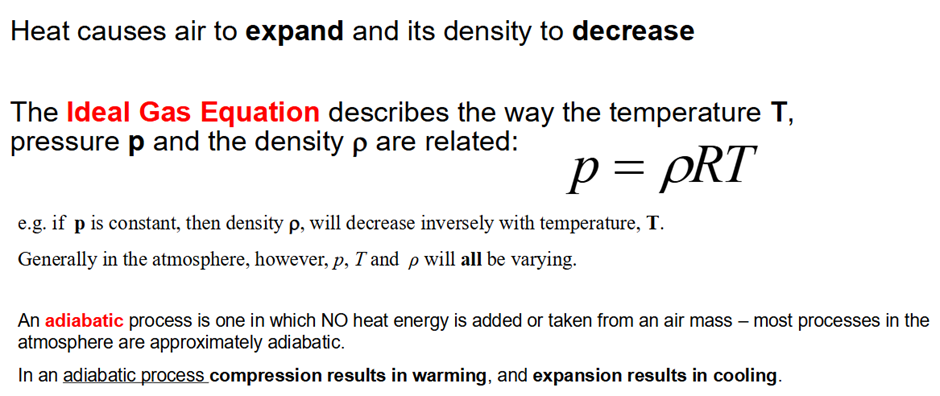
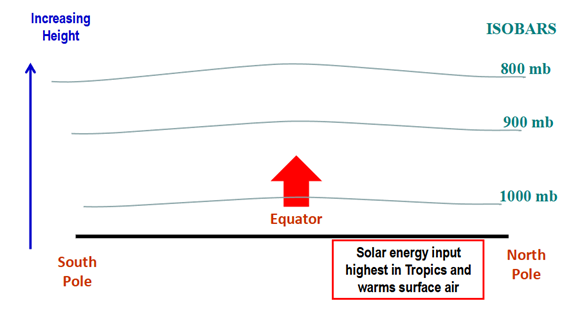
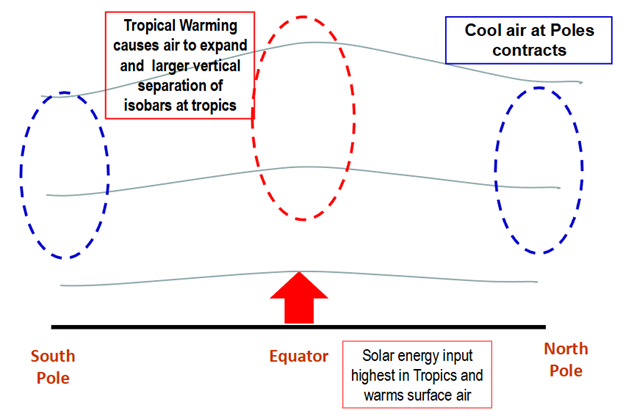
The effect of heat on air
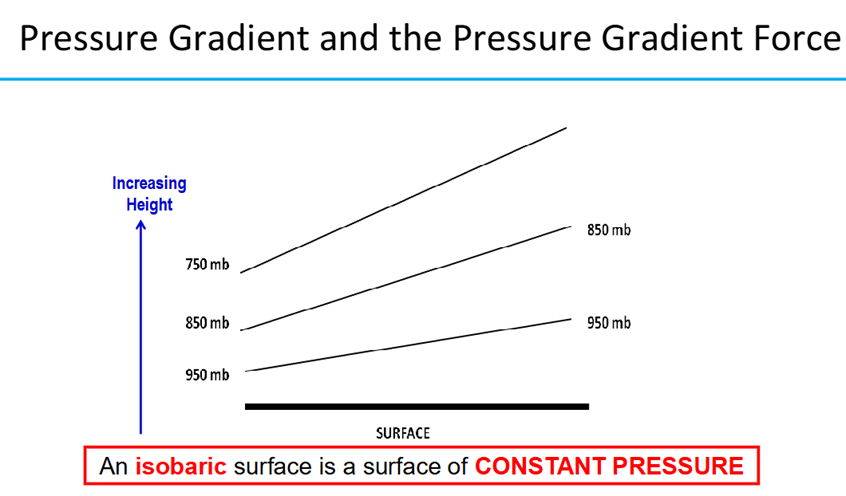
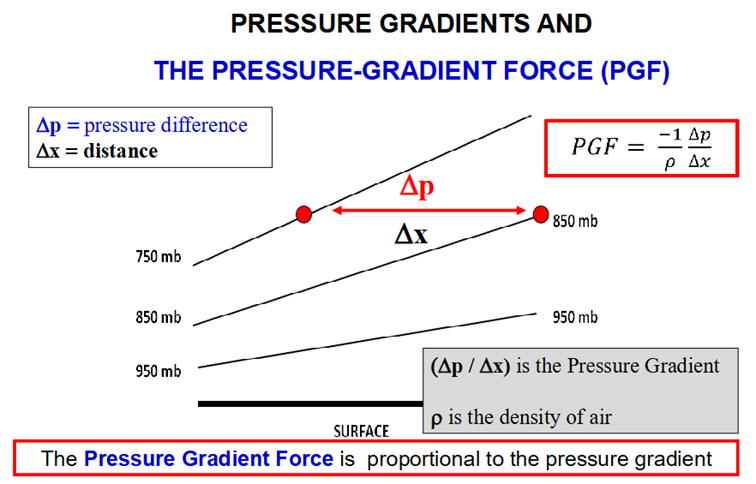
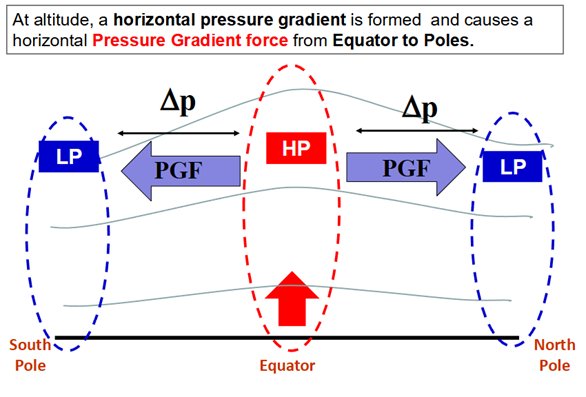
The Pressure Gradient Force is directed across the isobars from a region of High Pressure (HP) to a region of Low Pressure (LP)
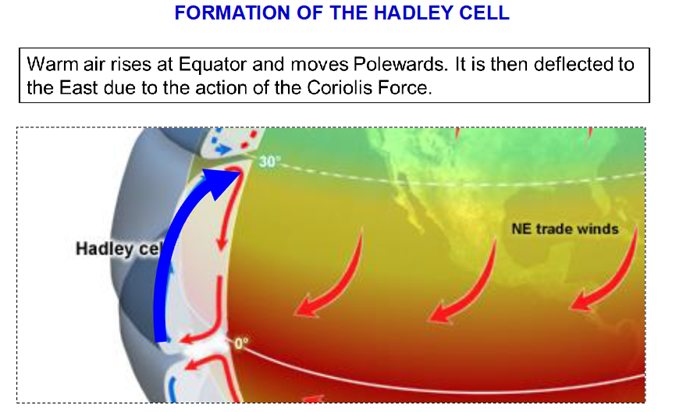
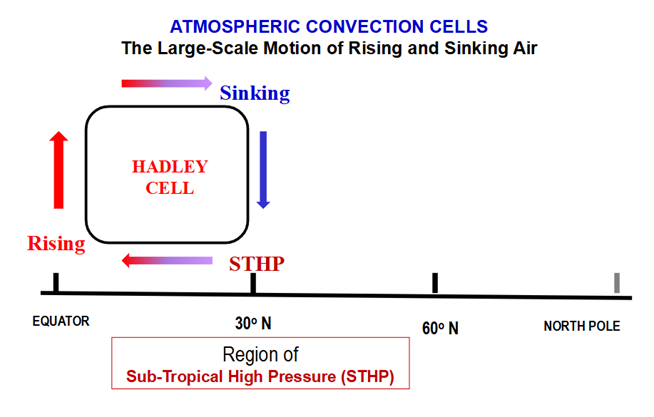
FORMATION OF CONVECTIVE CELLS
A Simplified example on a non-rotating Earth
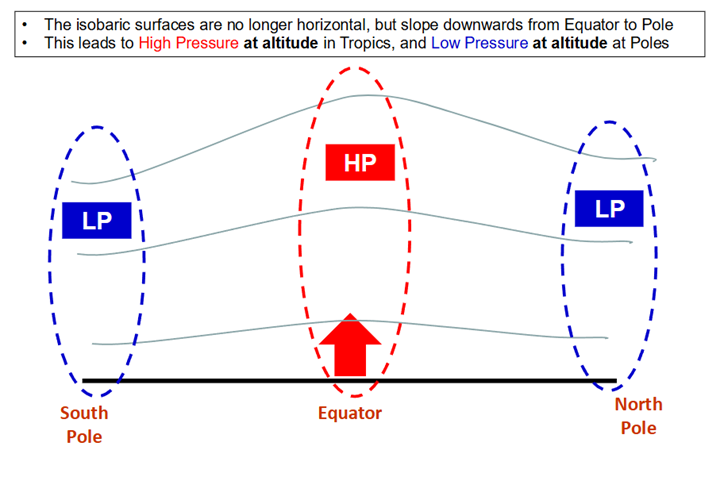
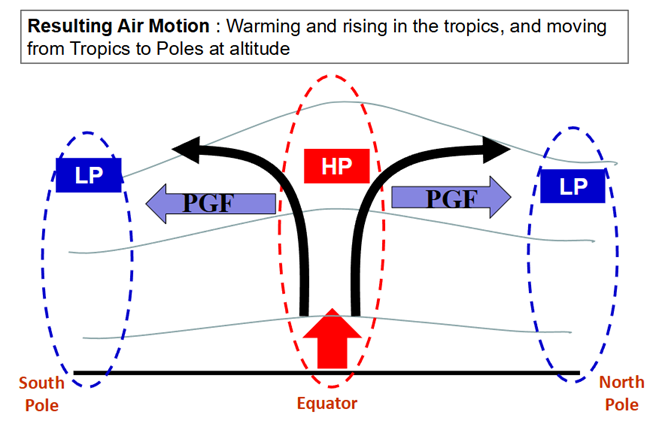
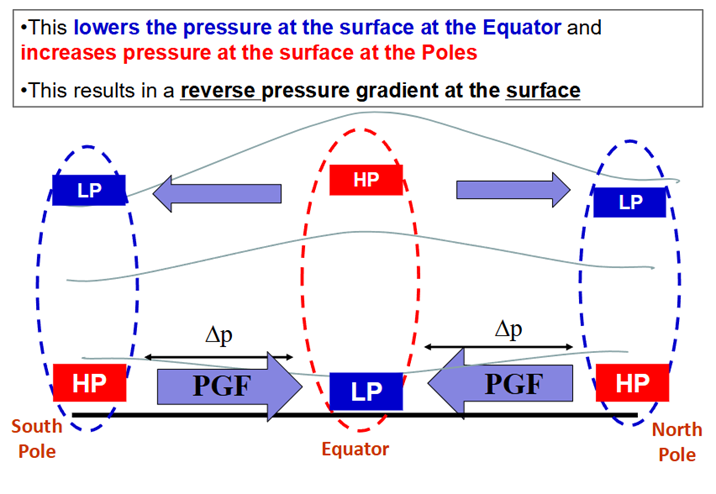
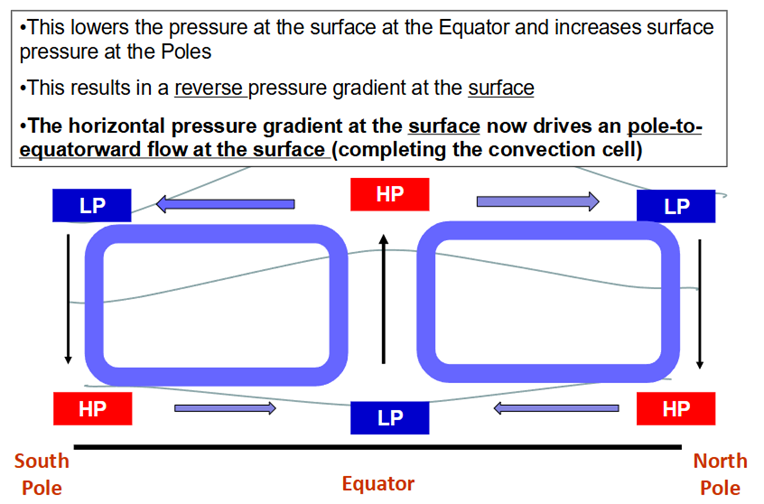
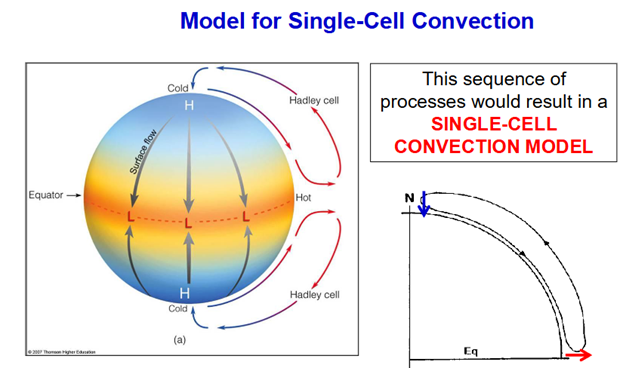
Convestion cells
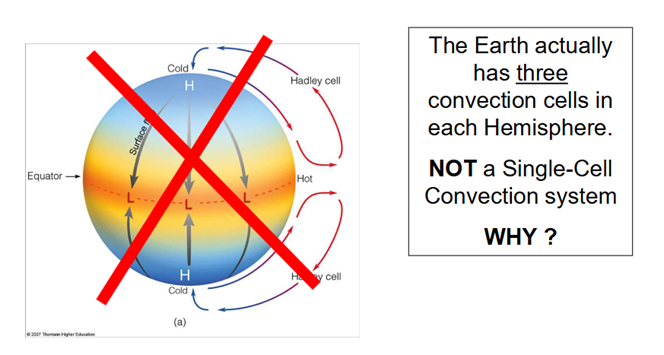
•Why doesn’t this simple single cell convection exist?
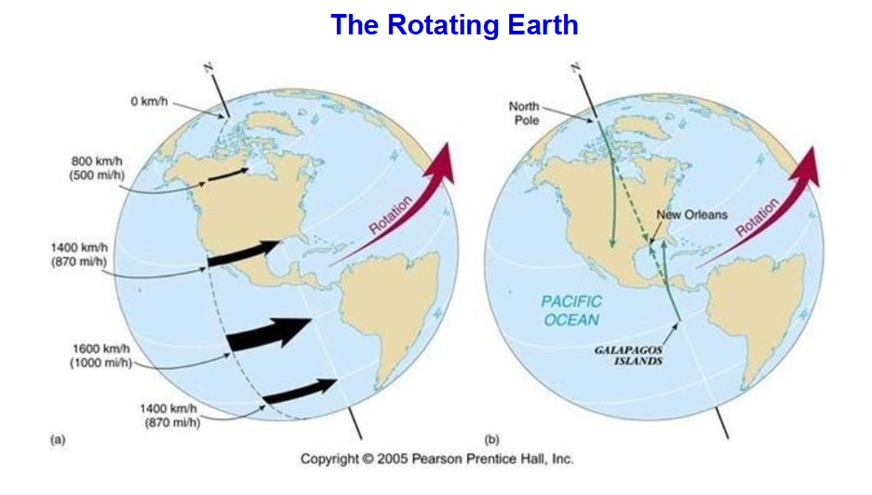
•The main reason is that the Earth is rotating.
•Moving air (or water) tries to move in a straight line (e.g., Equator to Pole) but is forced to follow a curved path on the Earth’s surface do to the Coriolis Force
The Rotating Earth
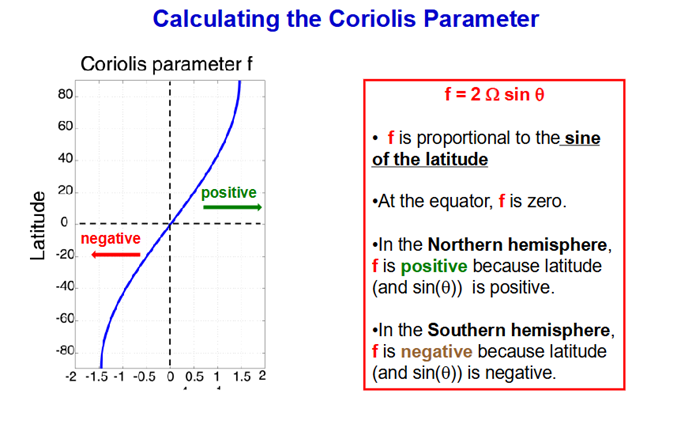
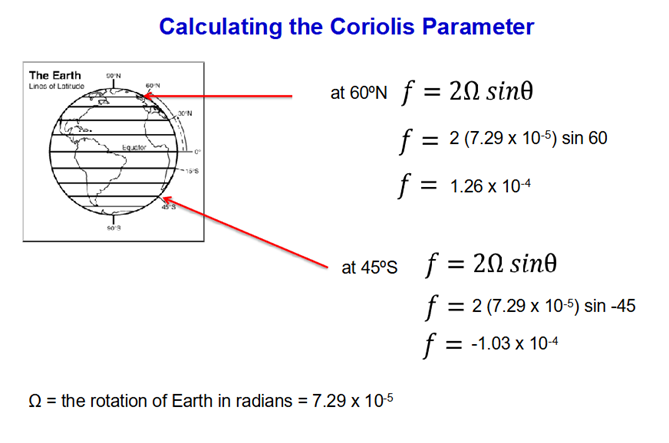
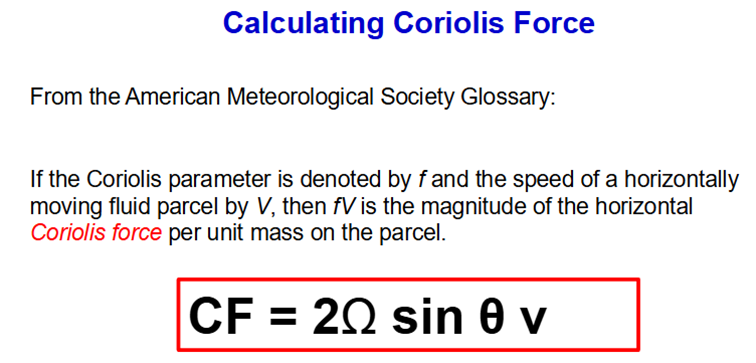
The Coriolis Parameter
From the American Meteorological Society Glossary:
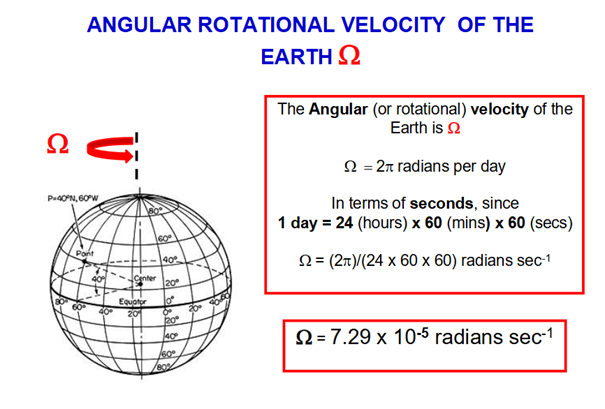
The Coriolis parameter is twice the component of the earth's angular velocity about the local vertical, 2Ω sinφ, where Ω is the angular speed of the earth and φ is the latitude.
Since the earth is in rigid rotation, the Coriolis parameter is equal to the component of the earth's vorticity about the local vertical.
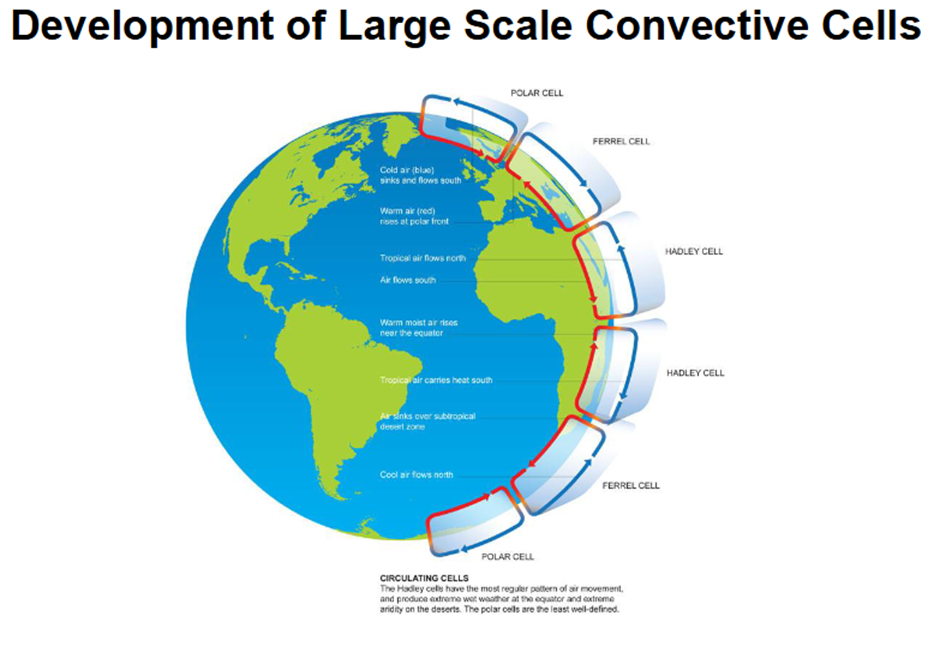
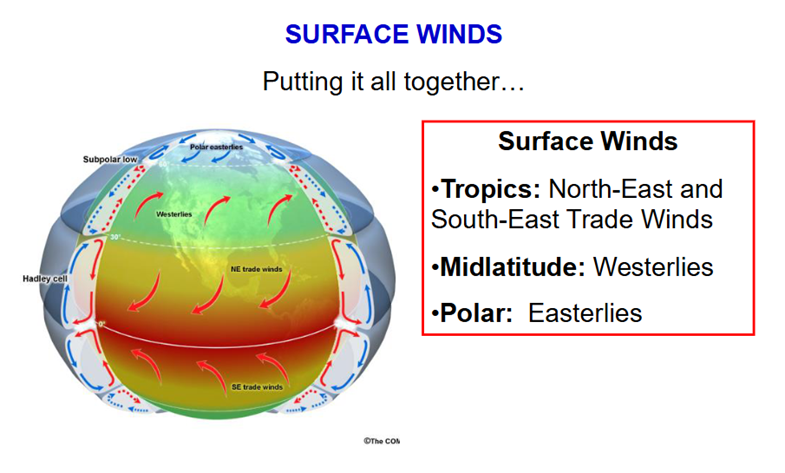
Circulation Patterns
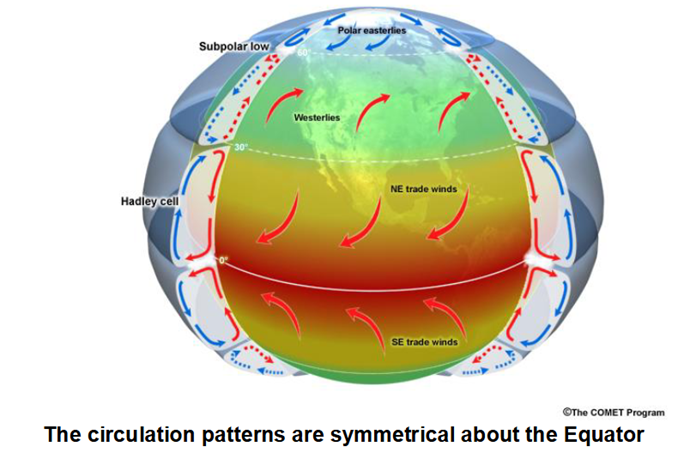
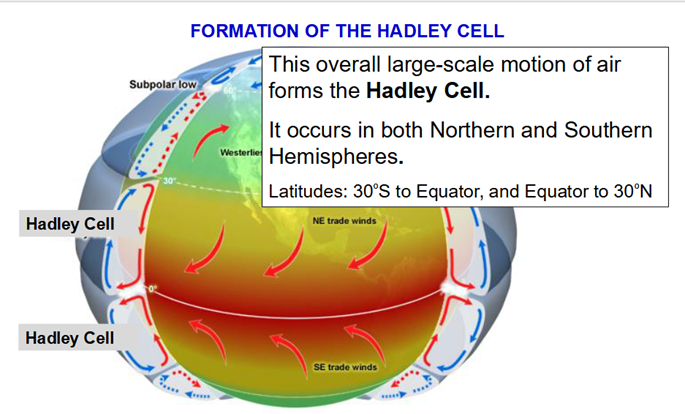
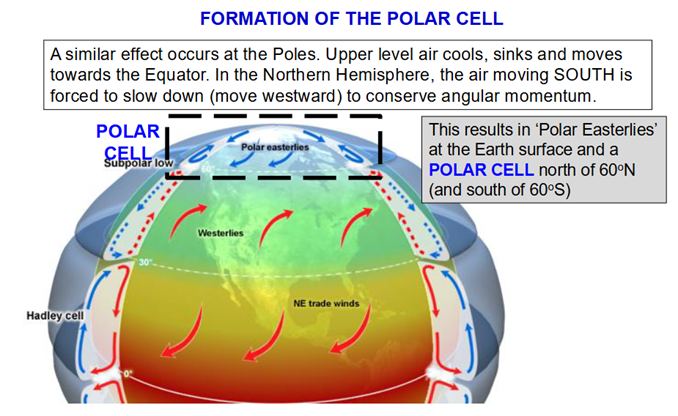
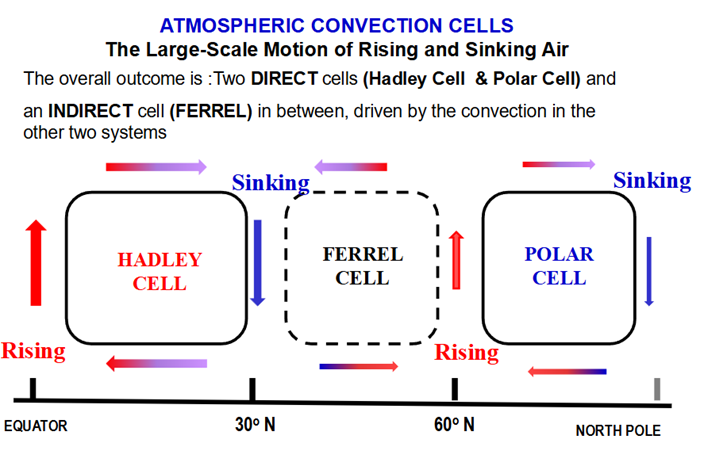
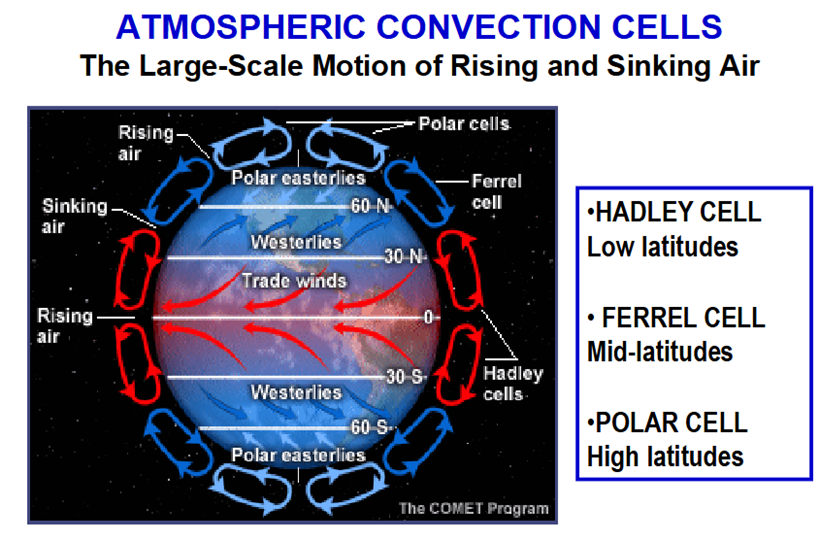
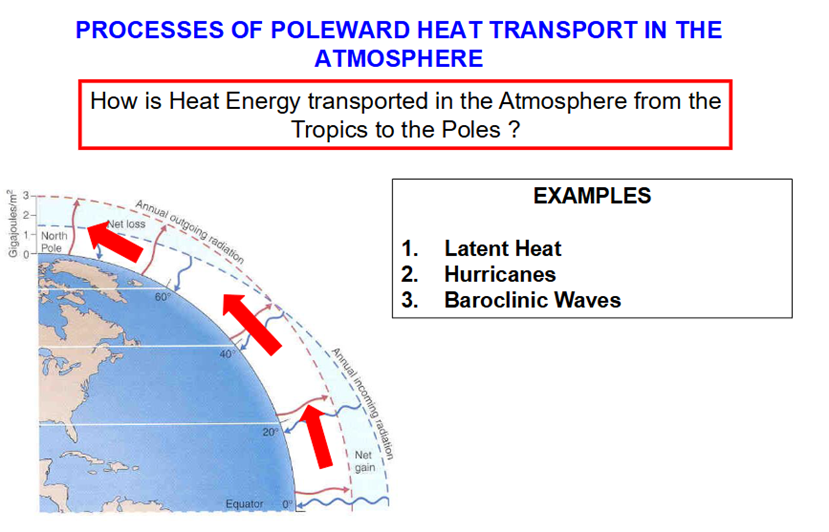
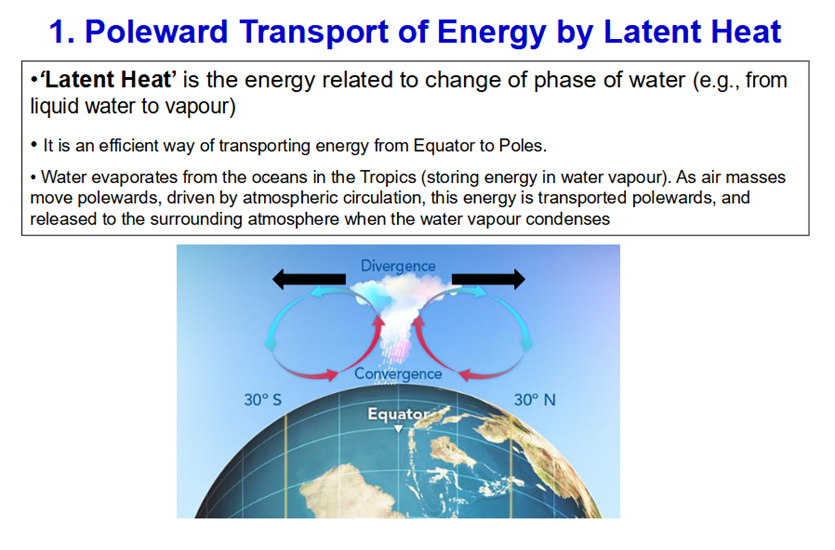
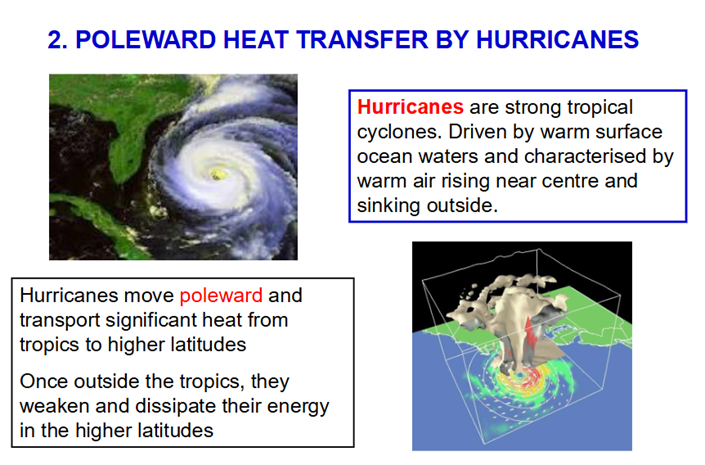
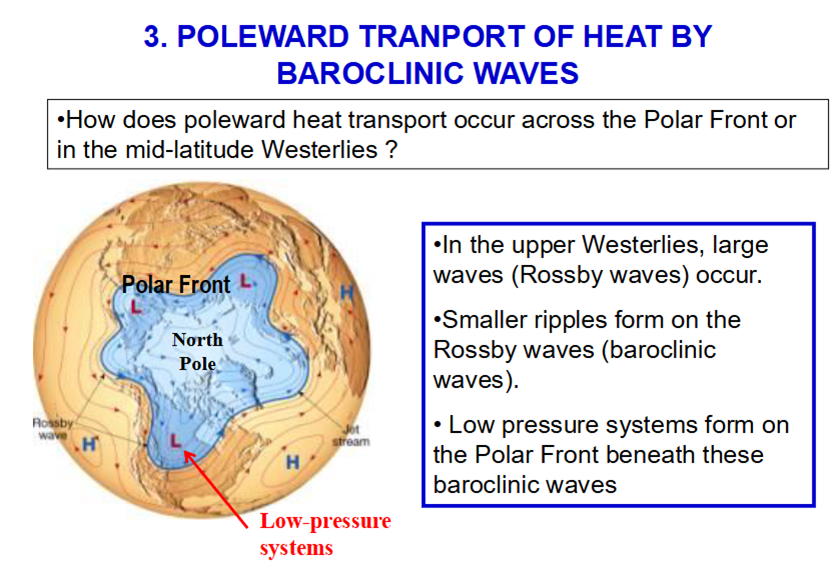
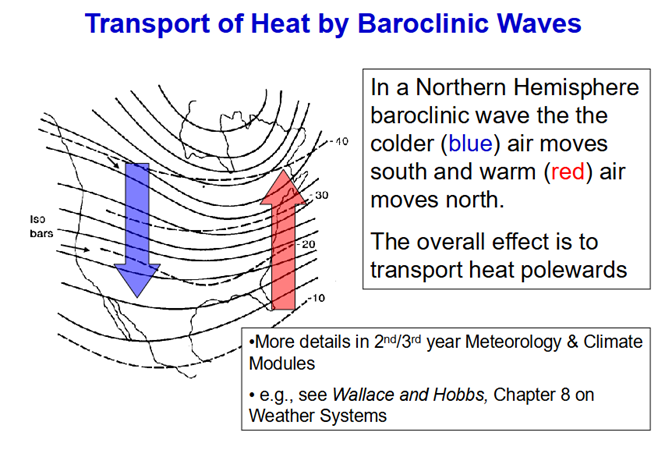
Process of Poleward Heat Transport in the Atmosphere
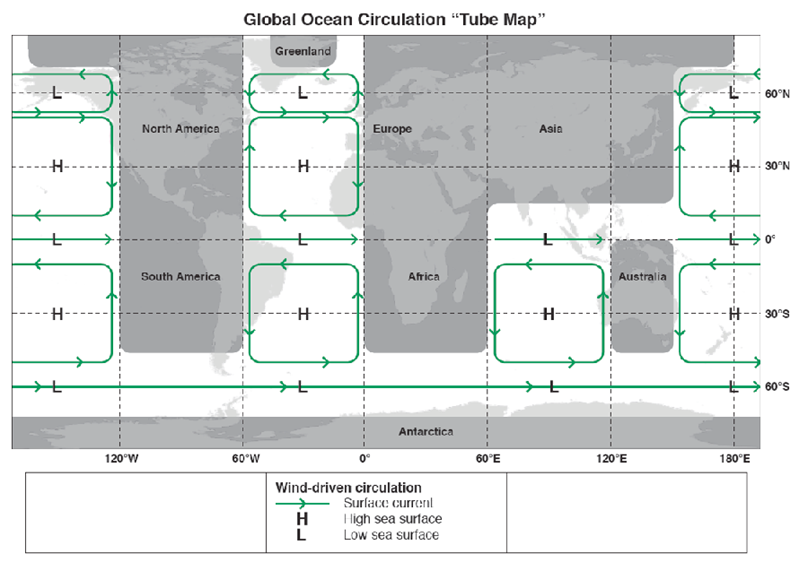
Surface Ocean Circulation
• The ocean has a surface circulation similar to atmospheric circulation
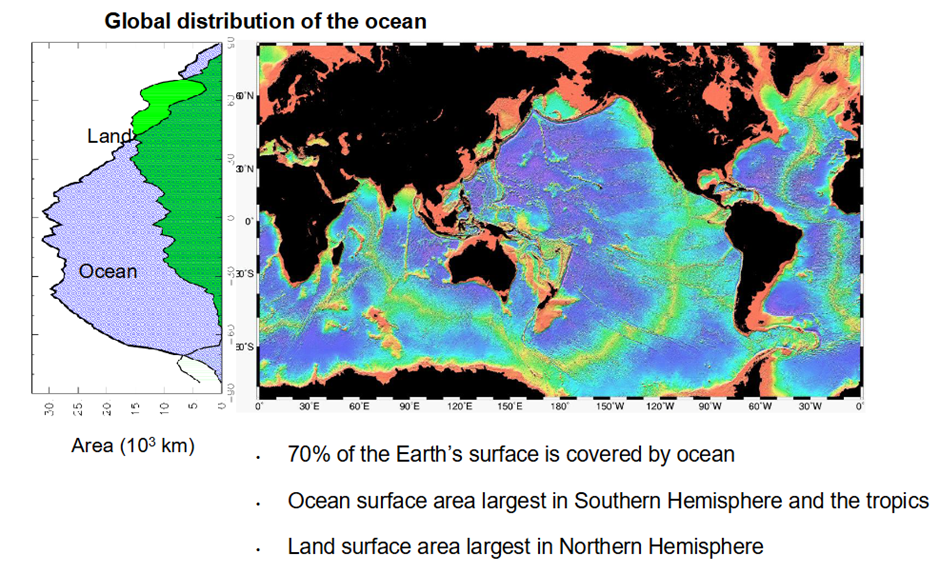
• An important difference: Global ocean is divided by the continents into three major ocean basins (Atlantic, Pacific and Indian)
• Like the atmosphere, the ocean has a long-term mean circulation (“climate”) and short-term variability (“weather”)
• Surface ocean circulation is driven primarily by the wind
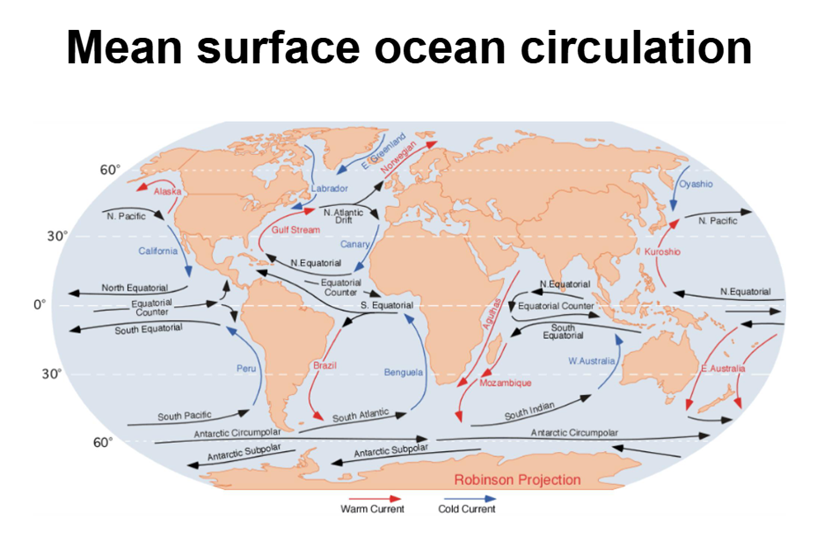
Surface currents
Dominant feature in each ocean basin are the subtropical gyres
– Anti-cyclonic (and lead to higher sea surface height)
– Flow clockwise in Northern Hemisphere
– Flow anti-clockwise in Southern Hemisphere
Towards the poles in the North Atlantic and North Pacific are the subpolar gyres
– Cyclonic (and lead to lower sea surface height)
– Flow anti-clockwise in Northern Hemisphere
– What direction would they flow in Southern Hemisphere?
Southern Ocean is dominated by the Antarctic Circumpolar Current
– There are no continents blocking the flow at this latitude
– Flows west-to-east all the way round Antarctica
Between each pair of subtropical gyres is the Equatorial Countercurrent
– Flows west-to-east along the equator
– Opposite direction to the subtropical gyres
SUbtropical Gyres
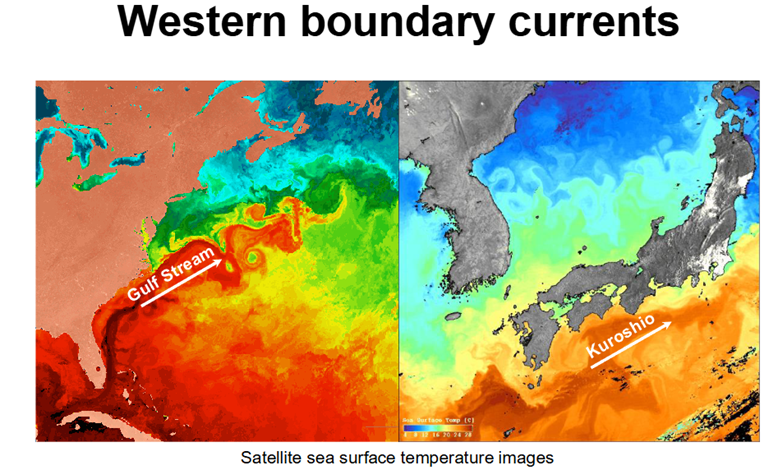
Subtropical gyres are not symmetrical
• Centre of the gyre is shifted west
• Poleward current on western side of the gyre is narrow and fast, known as a western boundary current e.g., Gulf Stream, Kuroshio
• Equatorward current on the eastern side is broad and slow, known as a eastern boundary current e.g., Canary Current, California Current
Why this asymmetry?
Western intensification
This asymmetry is called western intensification and is caused by:
1)Rotation of the Earth (Coriolis force)
2)Coriolis force varying with latitude because the Earth is (almost) spherical
3)Friction between the western boundary current and the coastline (friction ∝ velocity2)
What Happens Beneath the Ocean Surface?
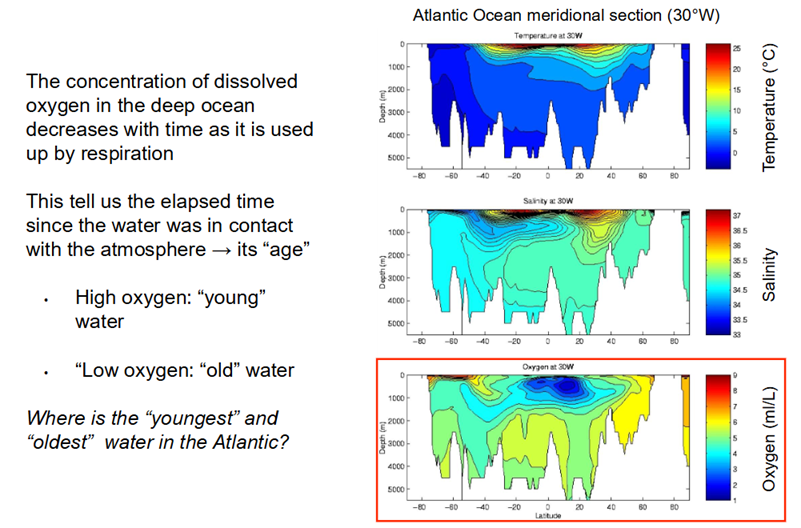
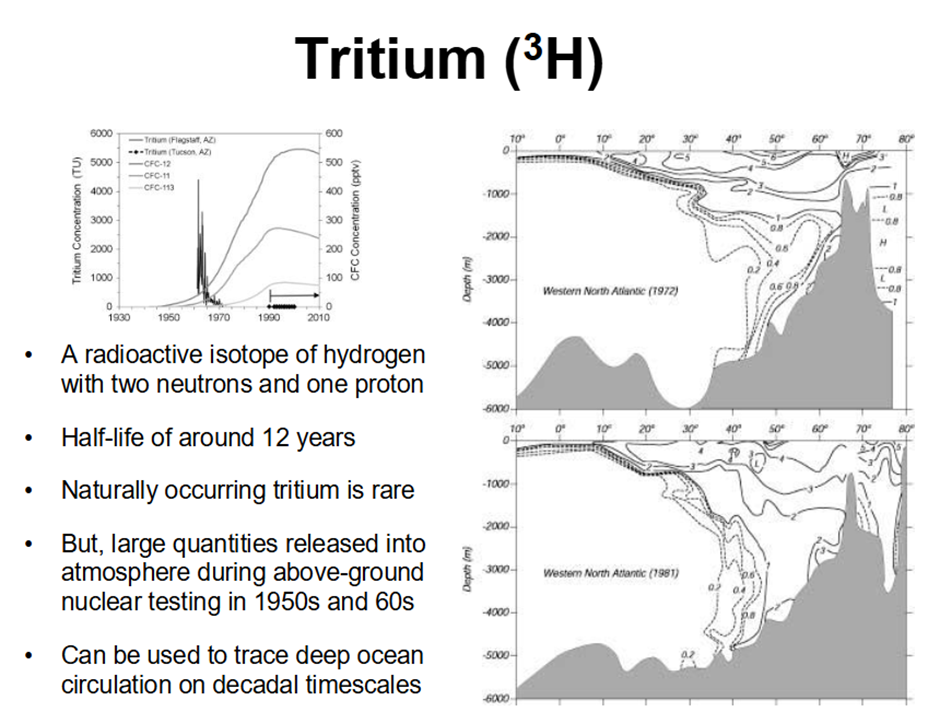
What do these lines of evidence tell us about deep ocean circulation?
• “Youngest” water is at the surface near the poles
• “Oldest” water is just below the thermocline in the tropics

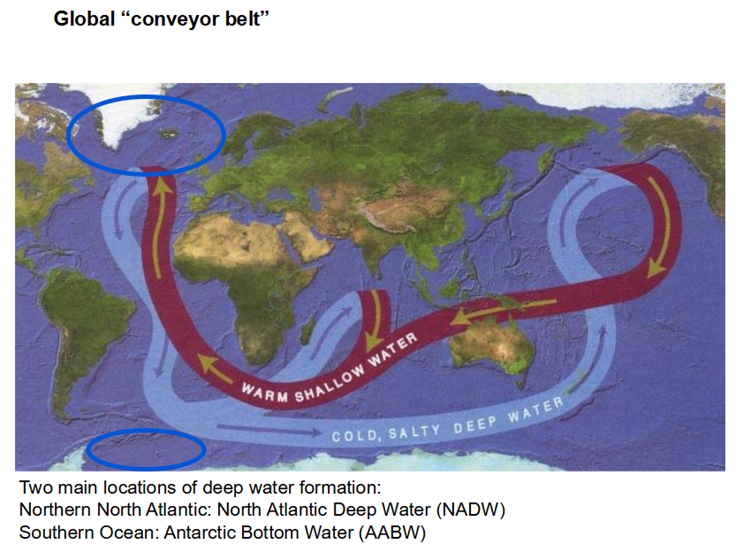
AABW: Antarctic Bottom Water
NADW: North Atlantic Deep Water
Thermohaline Circulation
Deep ocean circulation is driven by temperature and salinity gradients (and their affect on density) Termed the thermohaline circulation
– Thermo (heat) haline (salt)
Thermohaline circulation is sometimes referred to as the Meridional Overturning Circulation (MOC)
– Meridional is the north-south direction
– As opposed to zonal (east-west direction)
• In polar regions during winter, surface waters cool. The ocean releases heat to warm the overlying atmosphere
• When the surface water reaches −1.9°C it freezes to form sea ice. Salt from the seawater is left behind during freezing (brine rejection)
• Surface water becomes cold and saline, both factors increase its density
• When the surface water becomes denser than the water masses below it the water column becomes unstable
• Surface water sinks to the bottom (deep convection)
• This new deep water moves towards the equator
• At the surface, warm water moves polewards from the equator to replace it
• The deep water eventually returns to the surface through turbulent mixing and upwelling

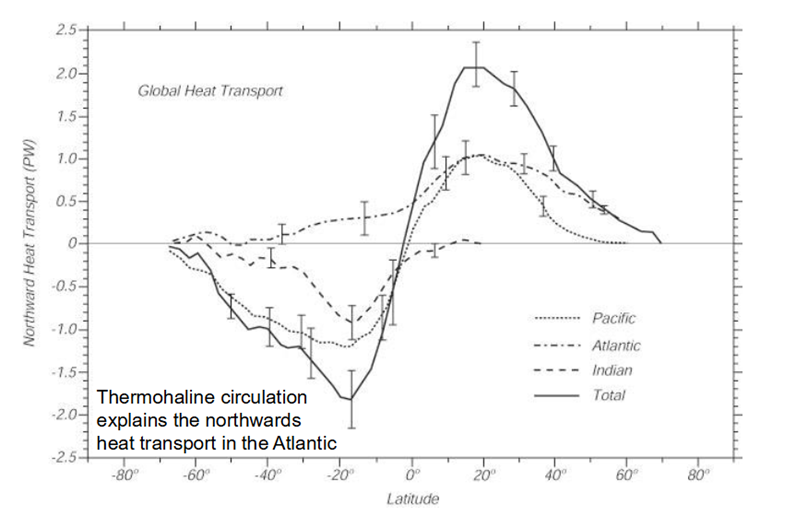
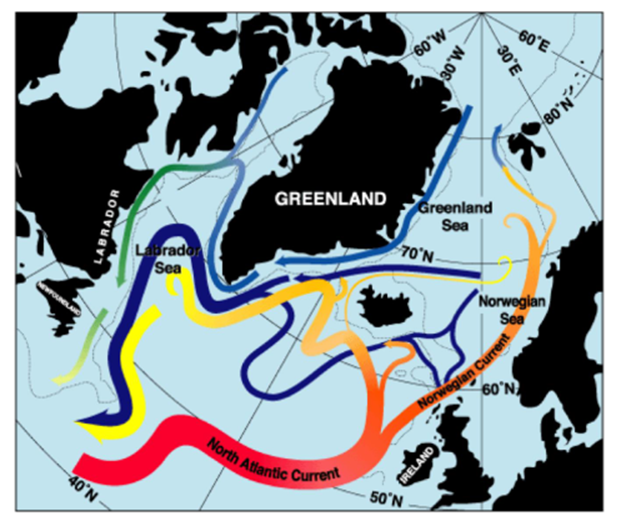
Gulf Stream and European Climate
Gulf Stream and North Atlantic Current are a combination of the wind-driven gyre circulation and the surface leg of the thermohaline circulation.
Heat transported north by the Gulf Stream and North Atlantic Current is released to
the atmosphere over Europe.
This explains why, during winter, Europe is typically warmer than other regions at the same latitude