UNIT 2 REVIEW HUMAN GEOGRAPHY
5.0(3)
Card Sorting
1/46
Last updated 4:29 PM on 4/25/23
Name | Mastery | Learn | Test | Matching | Spaced | Call with Kai |
|---|
No analytics yet
Send a link to your students to track their progress
47 Terms
1
New cards
Demography
the study of population (2.1)
2
New cards
Carrying Capacity
the number of people that can live on a certain plane given the available resources (2.1)
3
New cards
4 major population clusters on Earth
east Asia, south Asia, southeast Asia, and Europe (2.1)
4
New cards
4 human factors that influence the distribution of population
economic, political, cultural, historical (2.1)
5
New cards
Ecumene
the portion of Earth's surface inhabited by people (2.1)
6
New cards
Malthusian Theory
Thomas Malthus; states that population grows exponentially while food supply grows arithmetically– population grows faster than agriculture can catch up with (2.1)
7
New cards
Neo-Malthusians
belief that population will eventually crash due to lack of resources to accommodate population (2.1)
8
New cards
Pronatalist Policy vs. Antinatalist Policy
supports higher birth rates vs. supports lower birth rates (2.1)
9
New cards
Arithmetic Population Equation
total # of people / total land area (2.2)
10
New cards
Physiological Population Equation
total # of people / total arable land (2.2)
11
New cards
Agricultural Population Equation
total # of farmers / total arable land (2.2)
12
New cards
Natural Increase Rate (NIR)
the % by which a population grows in a year, does not include immigration; found by CBR / CDR (2.2)
13
New cards
Crude Birth Rate (CBR)
total # of live births in a year per 1000 people (2.2)
14
New cards
Crude Death Rate (CDR)
total # of deaths in a year per 1000 people (2.2)
15
New cards
Doubling Time
the amount of time it will take for a population to double in its current size; found by 70 / NIR (2.2)
16
New cards
Total Fertility Rate (TFR)
average number of babies a woman will have in child-bearing years– ages 15-49; found by the sum of the age-specific birth rates multiplied by 5 (2.2)
17
New cards
Zero Population Growth
when TFR = 2.1 (2.2)
18
New cards
Infant Mortality Rate (IMR)
# of infants less than one year old deaths per 1000 births (2.2)
19
New cards
Cohorts
single bar left or right of the origin line on a population pyramid (2.3)
20
New cards
Sex Ratio
# of males vs. # of females– 1.05 is world sex ratio (2.3 & 2.5)
21
New cards
(Pre/Post)Reproductive Ages
pre-reproductive ages: 0-14
reproductive ages: 14-44
post-reproductive ages: 45+ (2.3)
reproductive ages: 14-44
post-reproductive ages: 45+ (2.3)
22
New cards
4 common shapes of population pyramids
triangle, extended triangle, column, reduced pentagon (2.3)
23
New cards
Demographic Momentum
when the birth rates drop but population stays growing/steady (2.3)
24
New cards
Dependency Ratio
# of non-workers (too old or too young) vs. # in workforce (2.3)
25
New cards
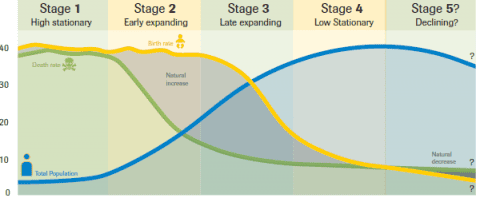
Demographic Transition Model (DTM)
graph that refers to the historical shift from high birth rates and high death rates in societies with minimal technology, education (especially of women) and economic development, to low birth rates and low death rates in societies with advanced technology, education, and economic development, as well as the stages between these two scenarios (2.4)
26
New cards
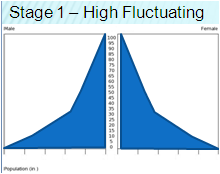
First Stage Nation Characteristics
CBR: very high
CDR: very high
NIR: very low
Dependency ratio: high (lots of young)
Economy: hunter-gatherer
Role of Women: traditional
NO COUNTRIES ARE FIRST STAGE MODERN DAY (2.4)
CDR: very high
NIR: very low
Dependency ratio: high (lots of young)
Economy: hunter-gatherer
Role of Women: traditional
NO COUNTRIES ARE FIRST STAGE MODERN DAY (2.4)
27
New cards
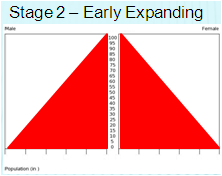
Second Stage Nation Characteristics
CBR: high
CDR: rapidly declining
NIR: very high
Dependency ratio: high (lots of young, but less than stage 1)
Economy: agricultural
Role of Women: traditional
Examples: most of Sub-Saharan Africa, Yemen, Afghanistan (2.4)
CDR: rapidly declining
NIR: very high
Dependency ratio: high (lots of young, but less than stage 1)
Economy: agricultural
Role of Women: traditional
Examples: most of Sub-Saharan Africa, Yemen, Afghanistan (2.4)
28
New cards
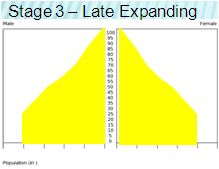
Third Stage Nation Characteristics
CBR: rapidly declining
CDR: moderately declining
NIR: moderate
Dependency ratio: moderate (young > old)
Economy: industrial
Role of Women: improving; new opportunity + contraception access
Examples: India, Mexico, South Africa (2.4)
CDR: moderately declining
NIR: moderate
Dependency ratio: moderate (young > old)
Economy: industrial
Role of Women: improving; new opportunity + contraception access
Examples: India, Mexico, South Africa (2.4)
29
New cards
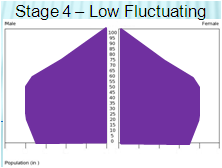
Fourth Stage Nation Characteristics
CBR: very low
CDR: low/slight increase
NIR: negative
Dependency ratio: low (lots of workers)
Economy: post-industrial (corporate)
Role of Women: near equal
Examples: USA, China, South Korea (2.4)
CDR: low/slight increase
NIR: negative
Dependency ratio: low (lots of workers)
Economy: post-industrial (corporate)
Role of Women: near equal
Examples: USA, China, South Korea (2.4)
30
New cards
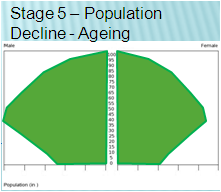
Fifth Stage Nation Characteristics
CBR: extremely low
CDR: increasing
NIR: negative
Dependency ratio: high (lots of elderly)
Economy: post-industrial (very corporate)
Role of Women: near equal; value career over children
Examples: Japan, Germany, Greece (2.4)
CDR: increasing
NIR: negative
Dependency ratio: high (lots of elderly)
Economy: post-industrial (very corporate)
Role of Women: near equal; value career over children
Examples: Japan, Germany, Greece (2.4)
31
New cards
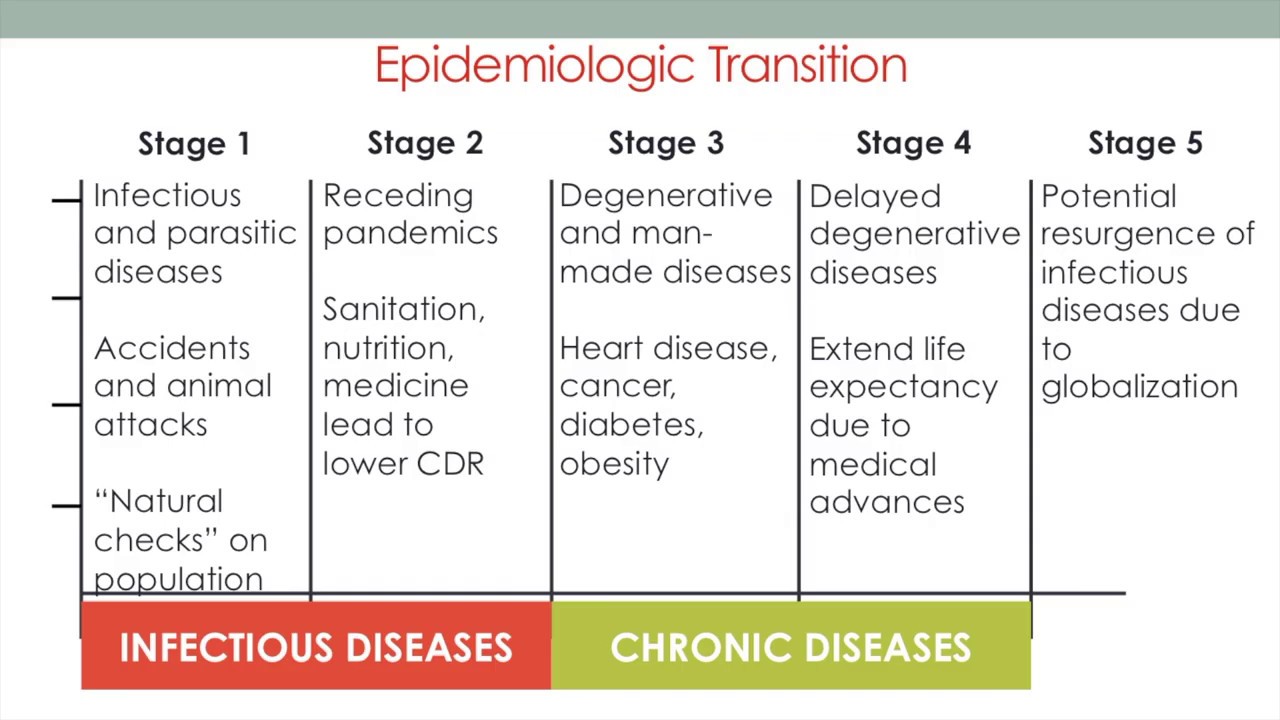
Epidemiological Transition
model that follows DTM to measure health threats at each stage (2.4)
32
New cards
Life Expectancy
the average number of years an individual can be expected to live given the current social, economic, and medical conditions (2.5)
33
New cards
Maternal Mortality Rate (MMR)
the annual number of deaths per 100,000 life births due to pregnancy (2.5)
34
New cards
Migration
a permanent move to a new location (2.6)
35
New cards
Push Factors
negative factors that induce people to move OUT OF their present location (2.6)
36
New cards
Pull Factors
positive factors that induce people to move TO a new location (2.6)
37
New cards
Interregional vs. Intraregional
moving from one place to another vs. moving within one location (2.6)
38
New cards
Migration throughout DTM Stages
Stage 1: high mobility/nomadic
Stage 2: rural
Stage 3: urban
Stage 4&5: suburban (2.6)
Stage 2: rural
Stage 3: urban
Stage 4&5: suburban (2.6)
39
New cards
Forced Migration
when the migrant has been compelled to move by political or environmental factors; slavery is the largest forced migration in history (2.6)
40
New cards
Refugees
individuals forced to migrate to another country to avoid something, usually war or persecution (2.6)
41
New cards
Internally Displaced Person
refugees that are not across the international boundary (2.6)
42
New cards
Asylum Seekers
someone migrated to another country in HOPE of refugee status (2.6)
43
New cards
Transhumance
modern-day animal herding nomadism for most suitable terrain during each season; most common in Europe (2.6)
44
New cards
Chain Migration
migration to be with other people, usually family (2.6)
45
New cards
Guest Worker
a person with temporary residency due to a program that allows immigration for workers for a given time (2.6)
46
New cards
Remittances
money sent by immigrants back to family in their home country (2.6)
47
New cards
Brain Drain
large-scale emigration by talented people to places with better economic opportunities (2.6)