Week 2: Thu: demography
1/53
There's no tags or description
Looks like no tags are added yet.
Name | Mastery | Learn | Test | Matching | Spaced | Call with Kai |
|---|
No analytics yet
Send a link to your students to track their progress
54 Terms
Demography
The study of how and why population size and structure change over time
Main drivers of population change
Survival reproduction and migration determine population dynamics
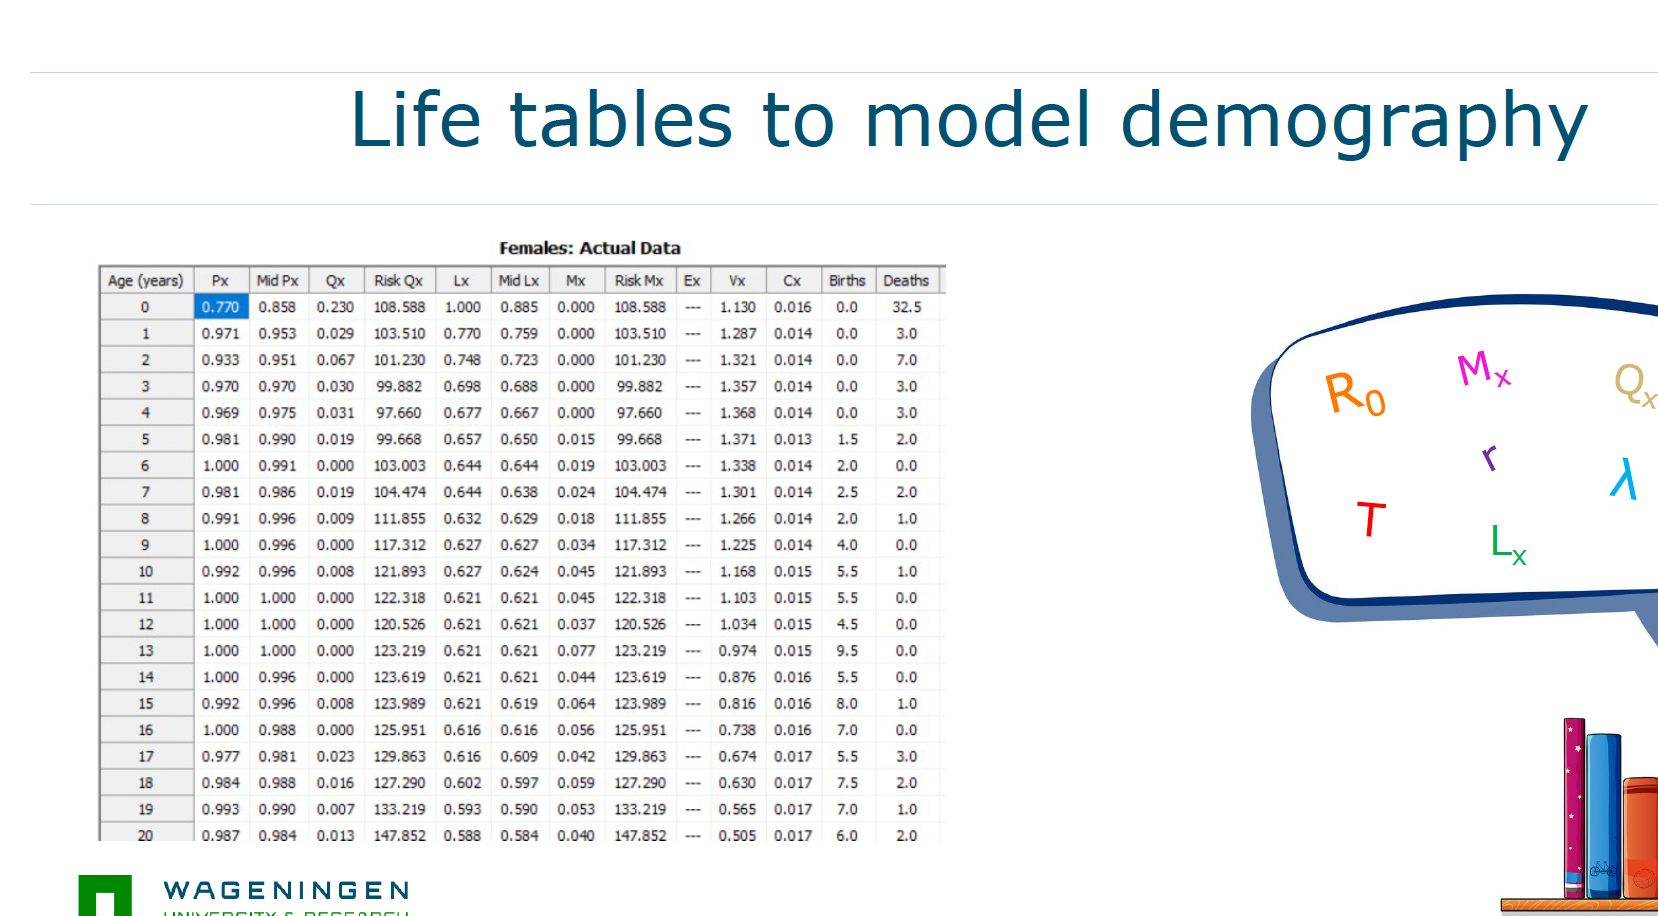
Life table
A structured way to describe survival and reproduction at each age in a population
nx
The number of individuals alive at the start of age class x
dx
The number of individuals that die during age class x
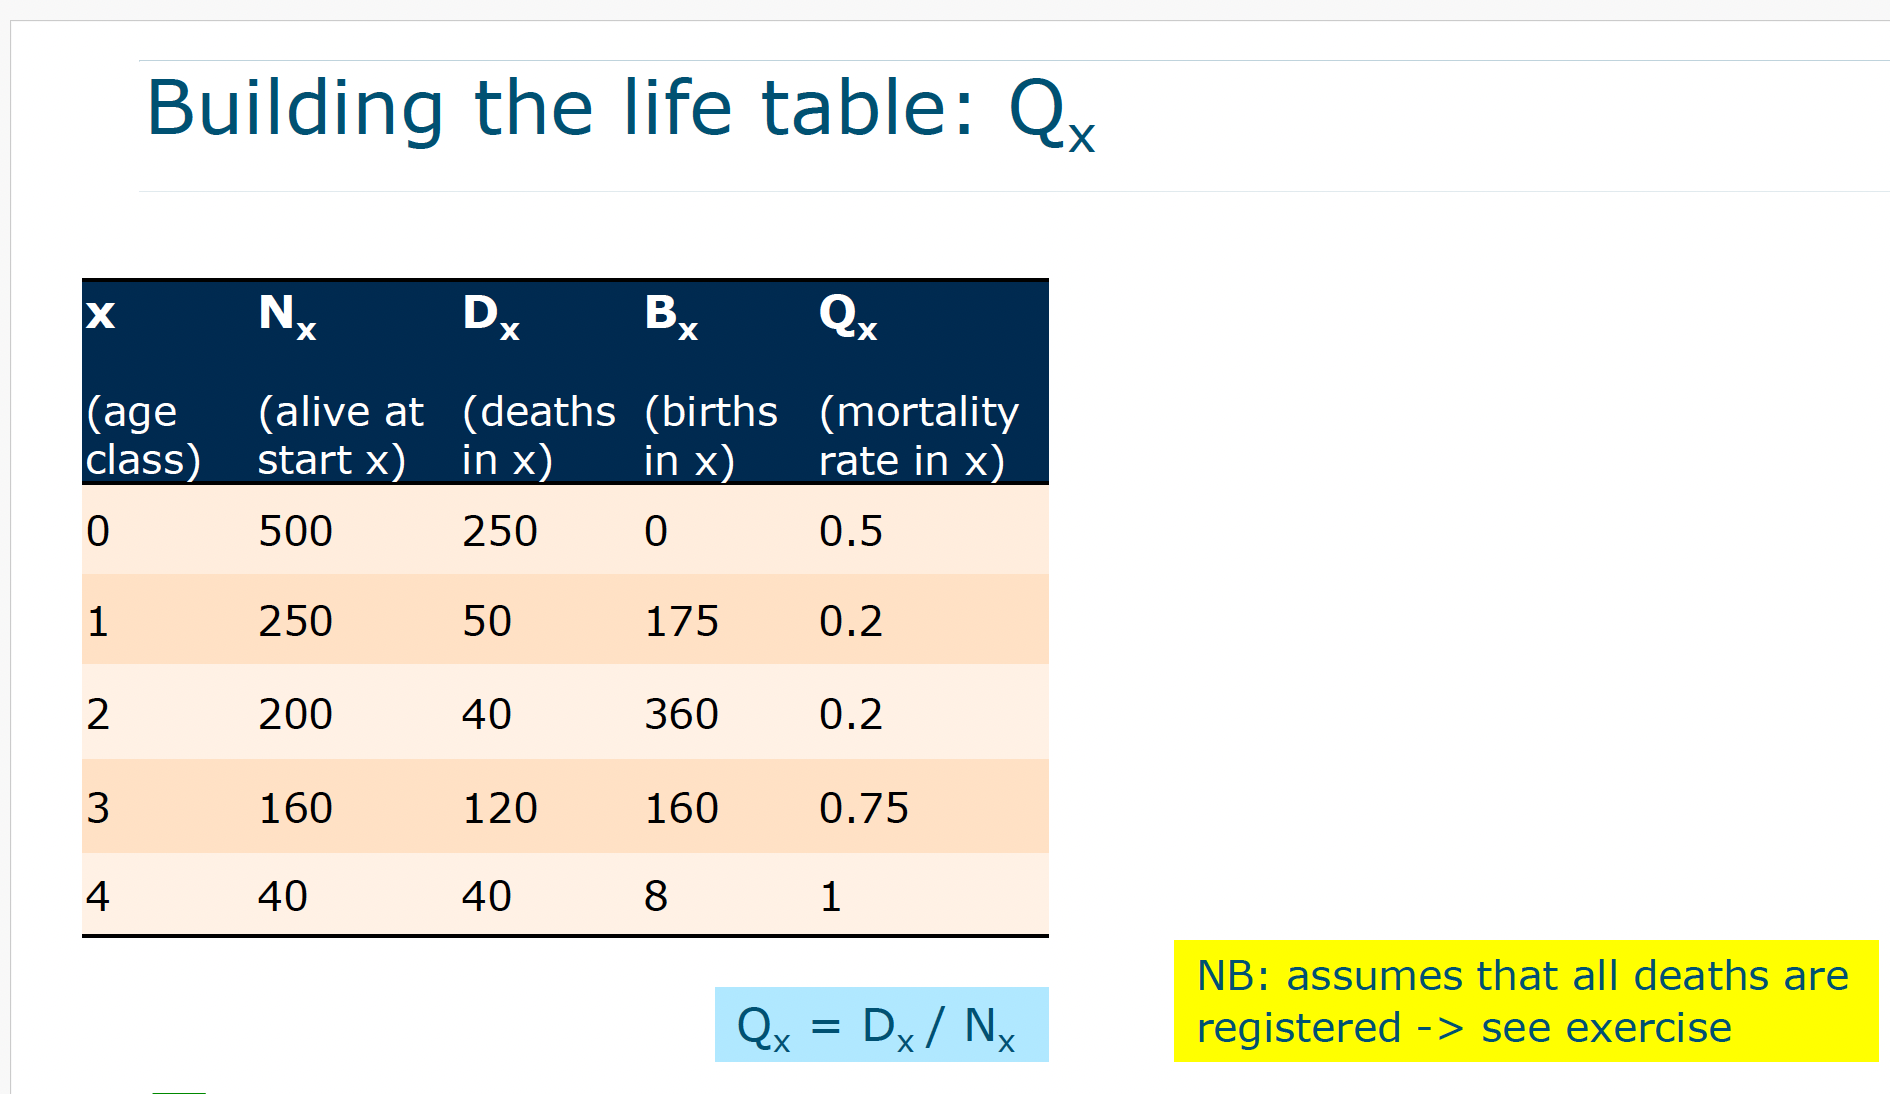
qx (mortality rate)
The probability of dying in age class x calculated as dx divided by nx
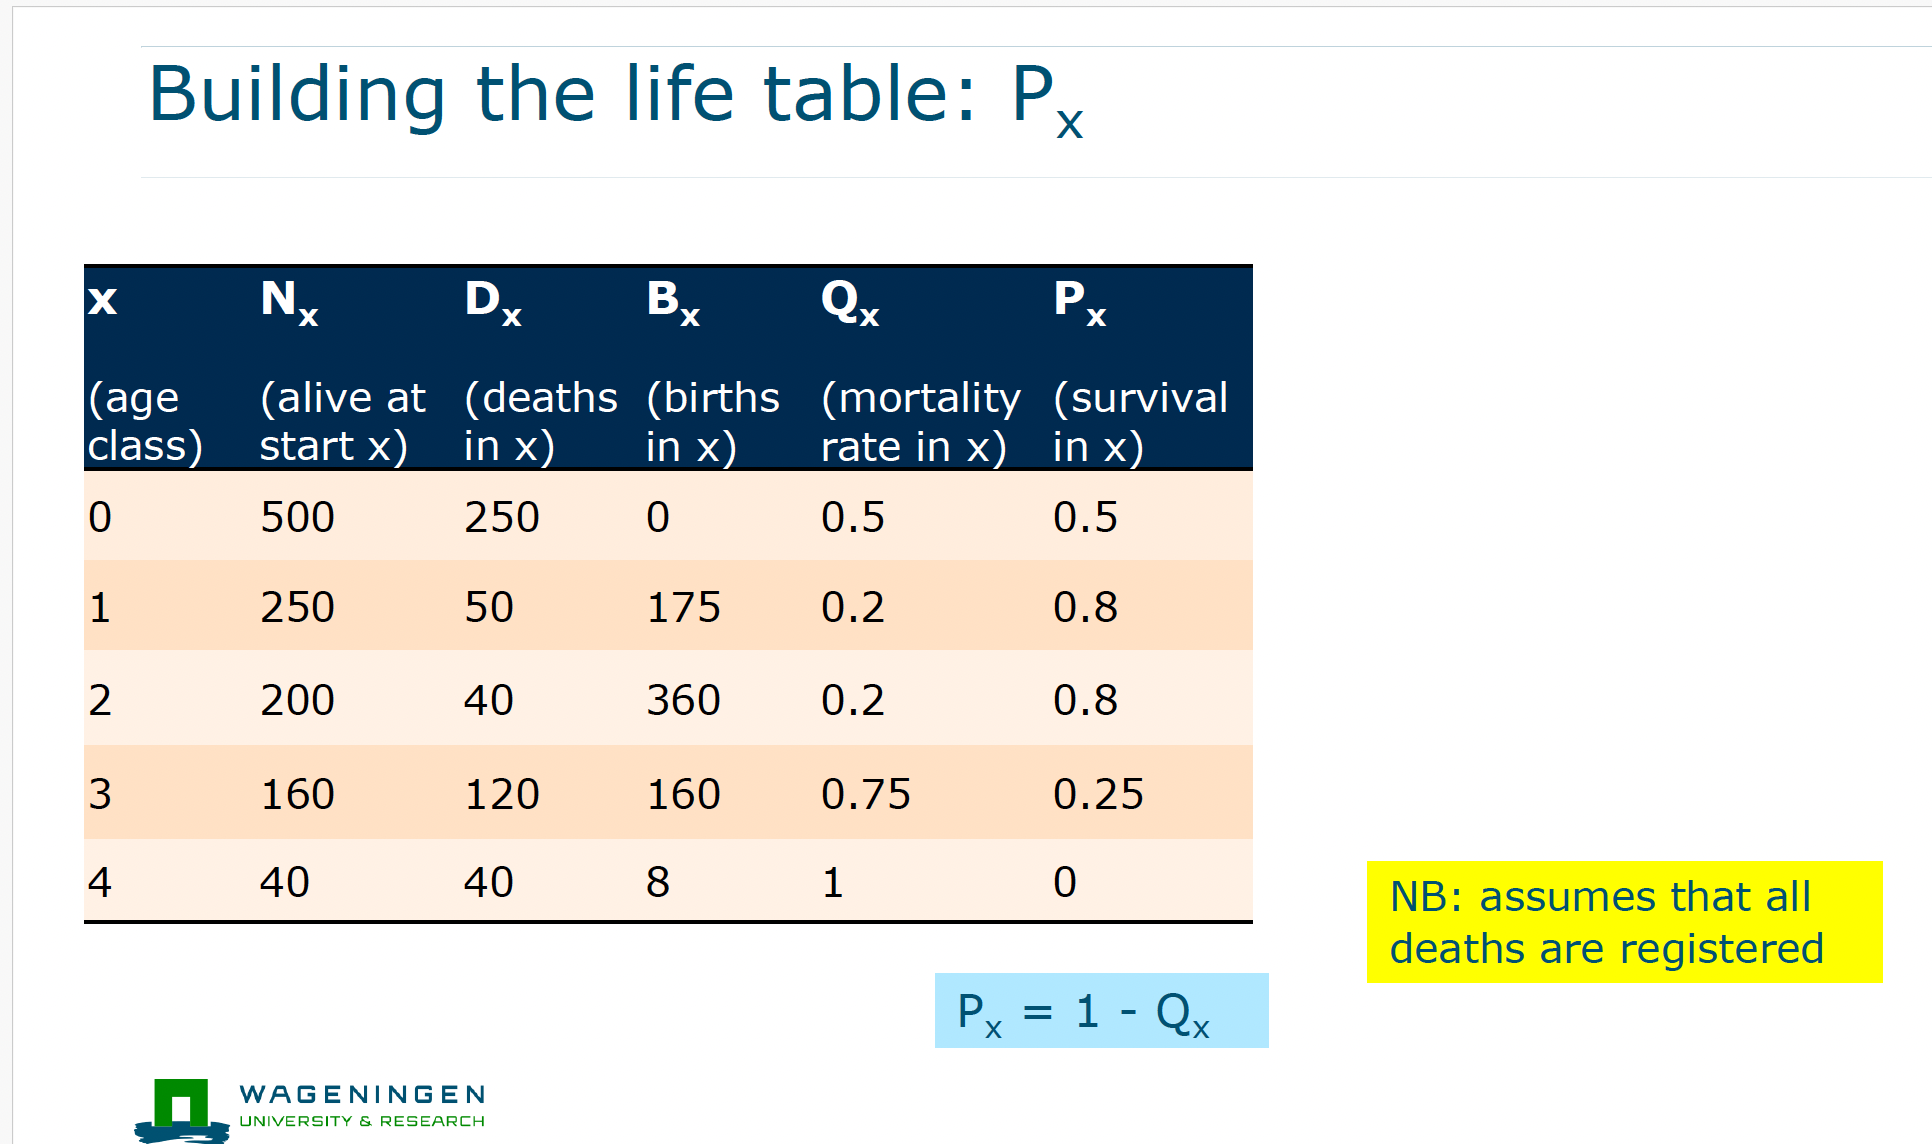
px (survival rate)
The probability of surviving to the next age class calculated as 1 minus qx
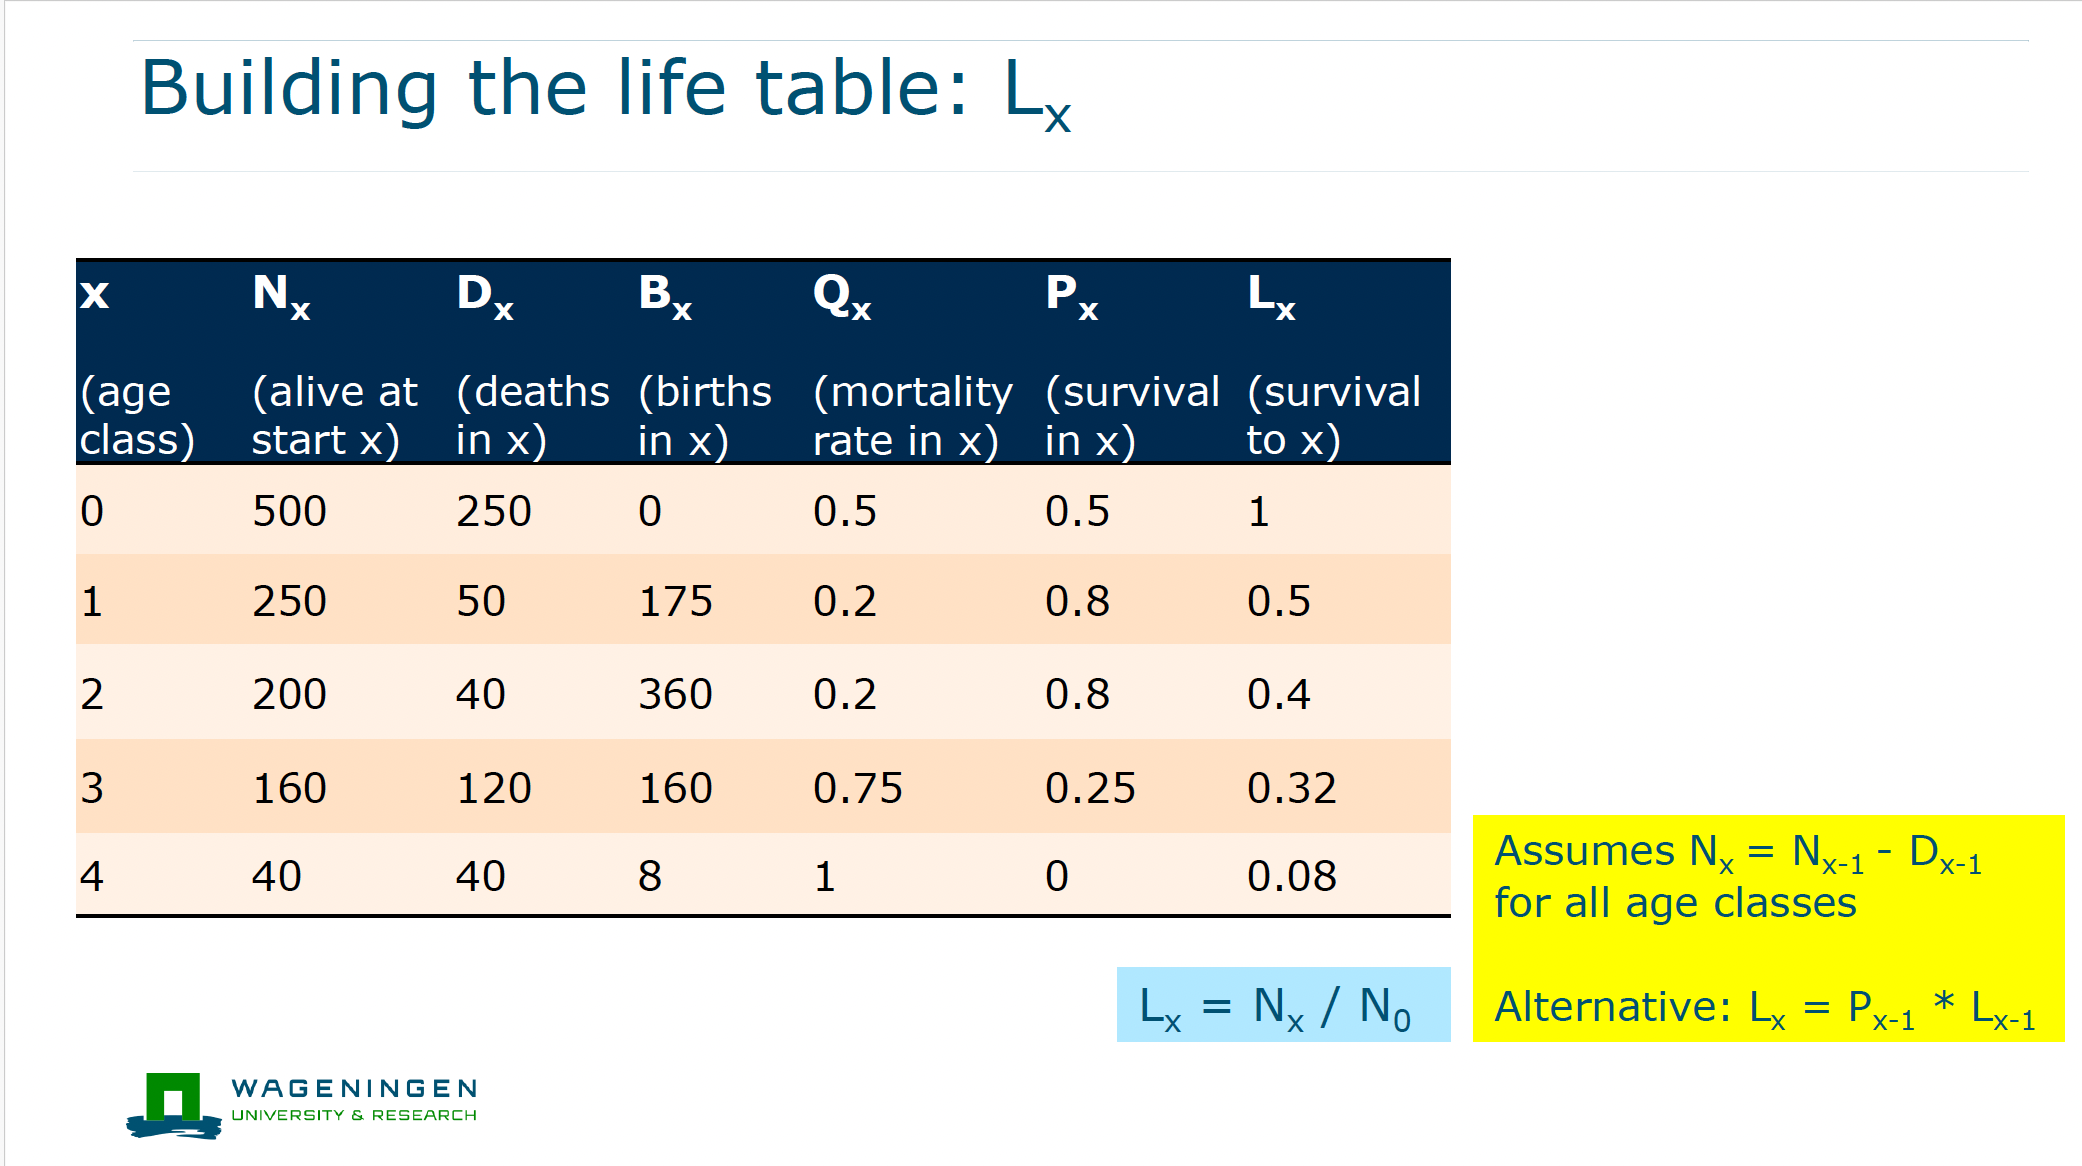
lx (cumulative survival)
The probability that a newborn survives to age x calculated as nx divided by n0
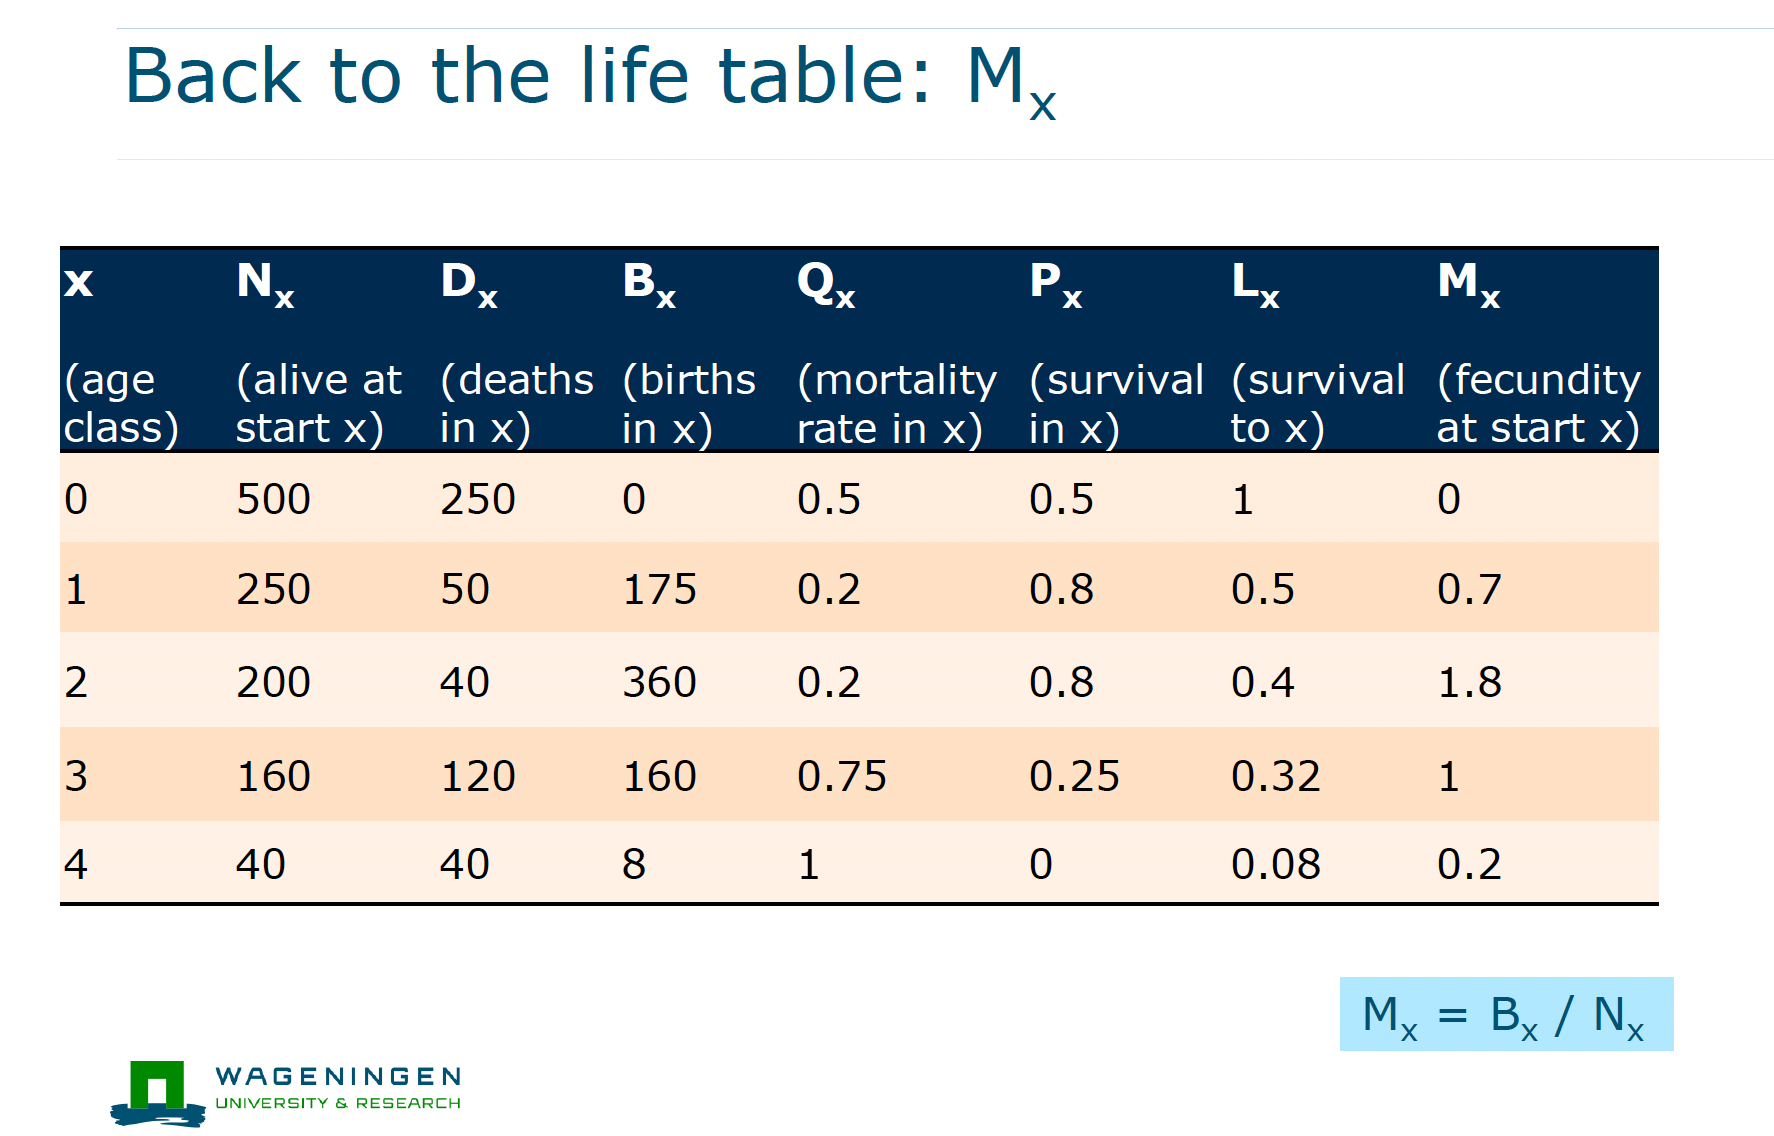
mx (fecundity)
The average number of same sex offspring produced by an individual at age x
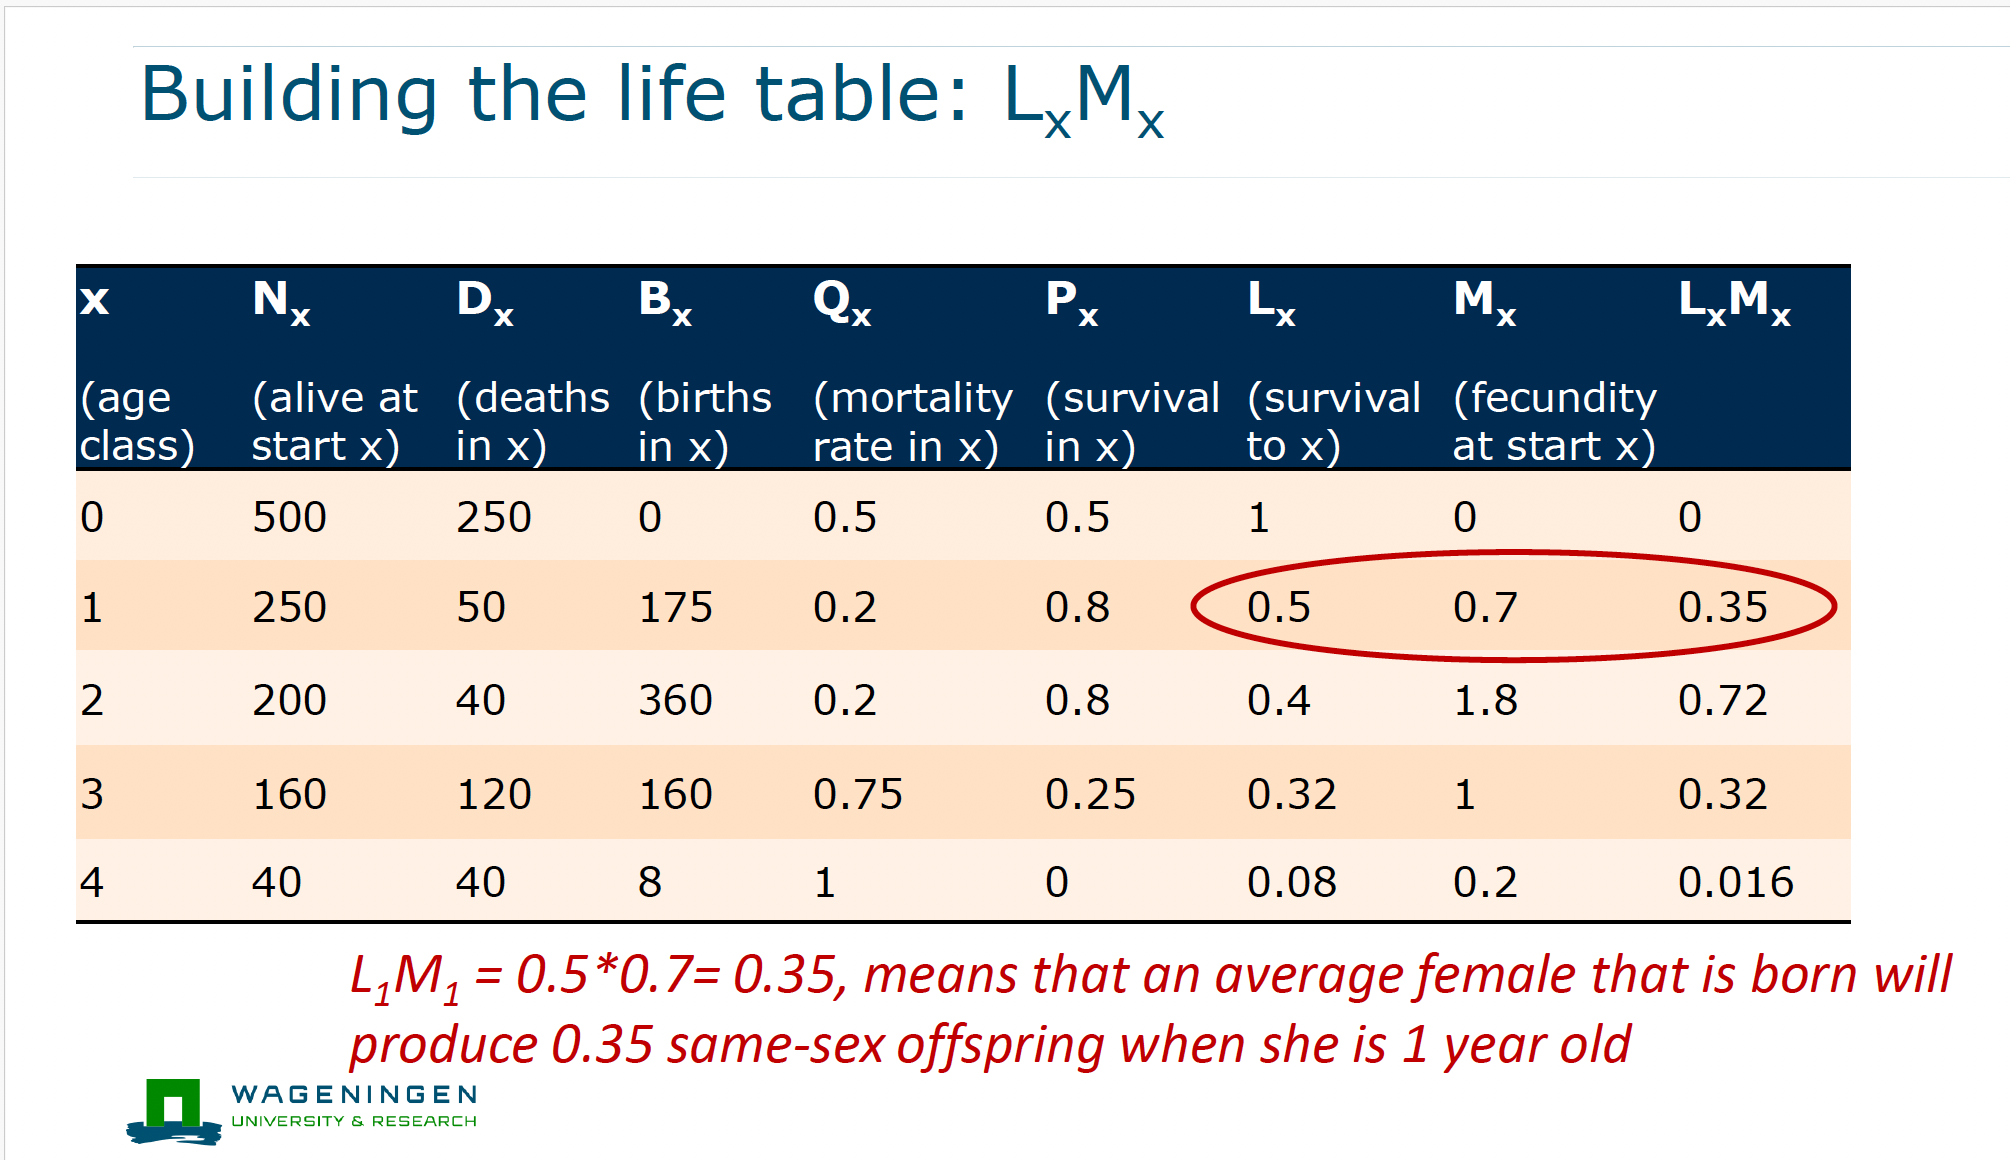
lx mx
The expected number of offspring produced at age x accounting for both survival and reproduction
Key idea of lxmx
It combines survival and reproduction to show real contribution to the next generation
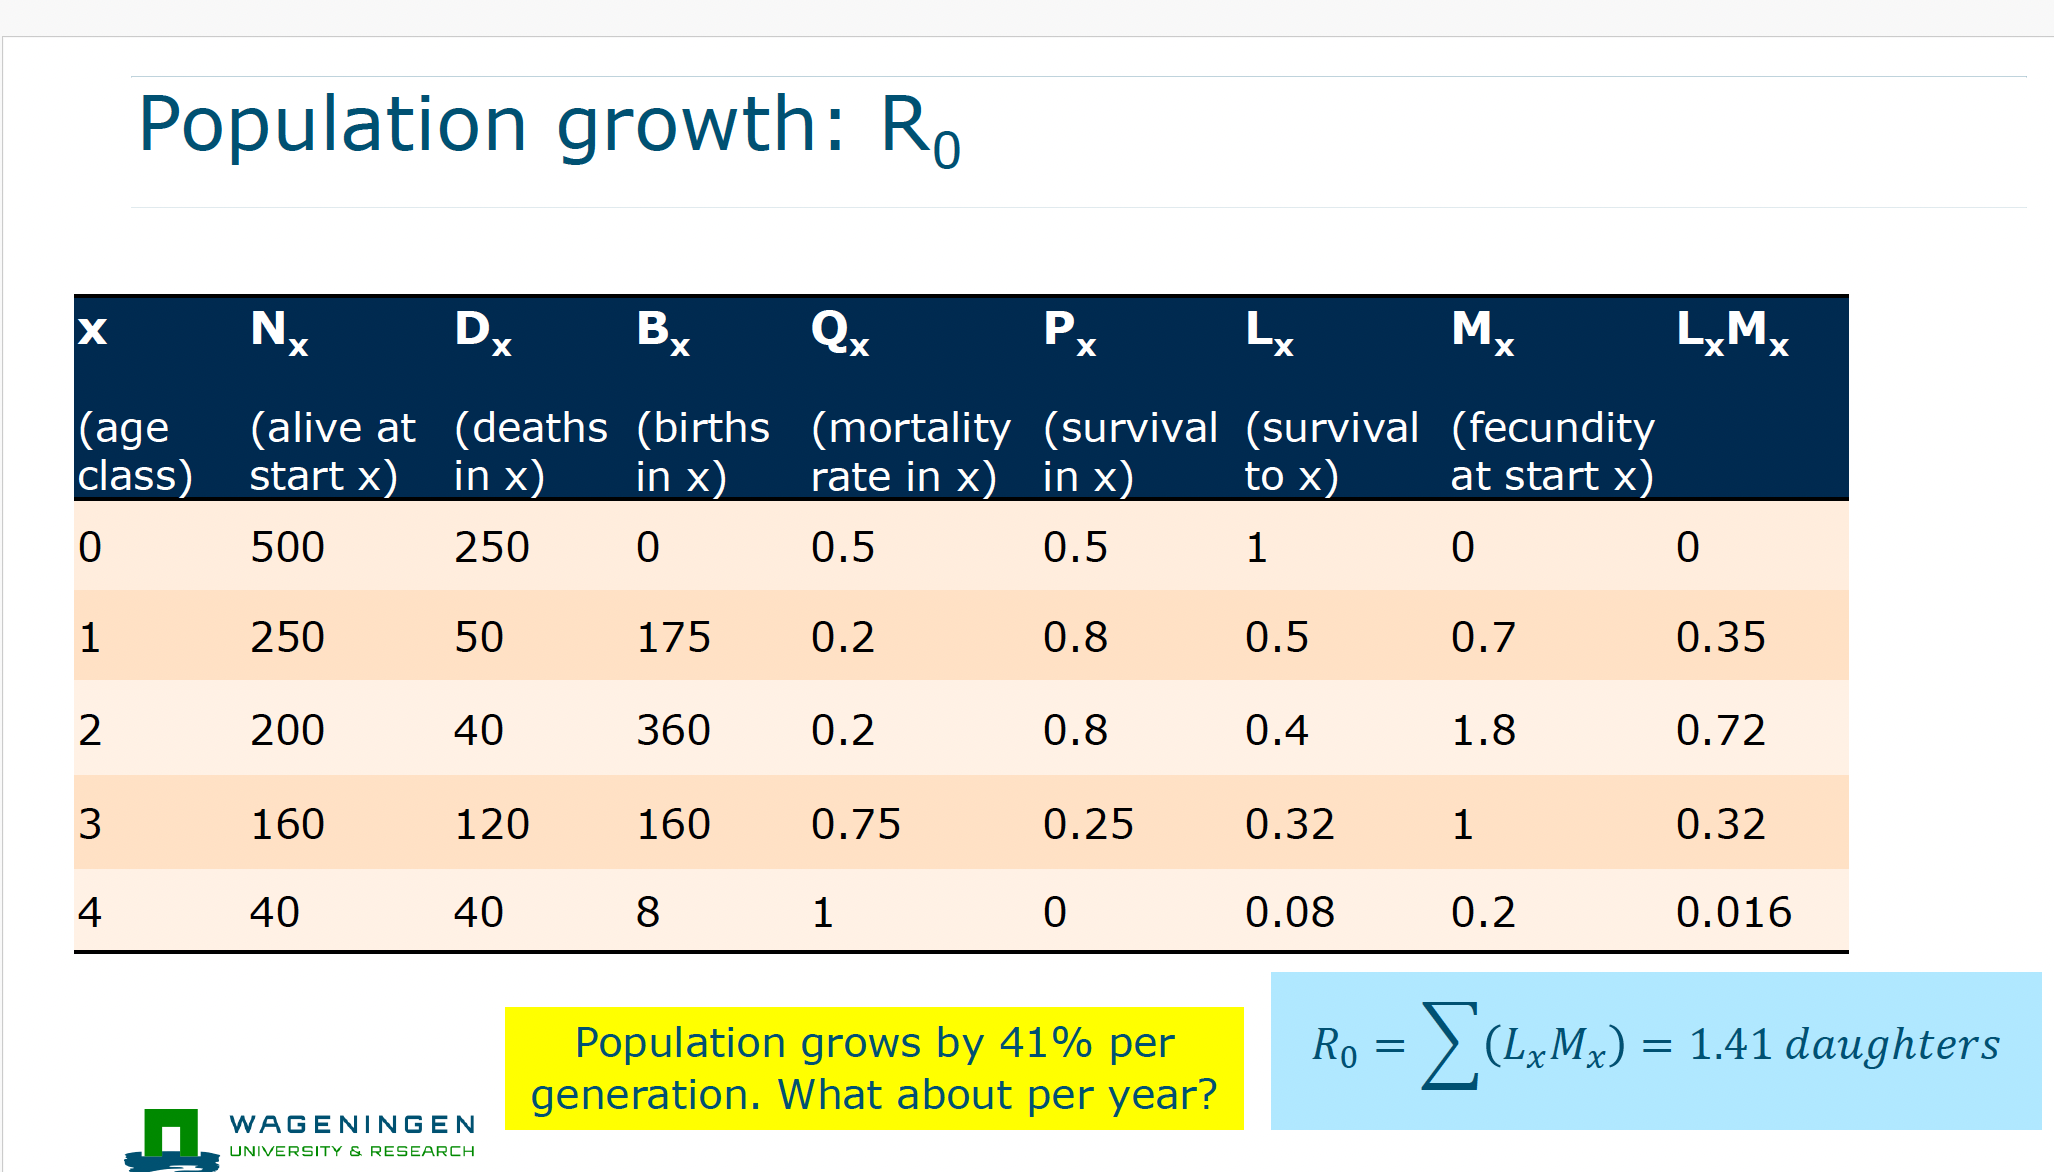
Net reproductive rate R0
The average number of same sex offspring an individual produces over its lifetime
R0 formula
R0 = sum of lxmx across all ages meaning total lifetime reproduction
Interpretation of R0 greater than 1
Each individual replaces itself with more than one offspring so population grows
Interpretation of R0 equal to 1
Each individual replaces itself exactly so population stays stable
Interpretation of R0 less than 1
Each individual produces less than one offspring so population declines
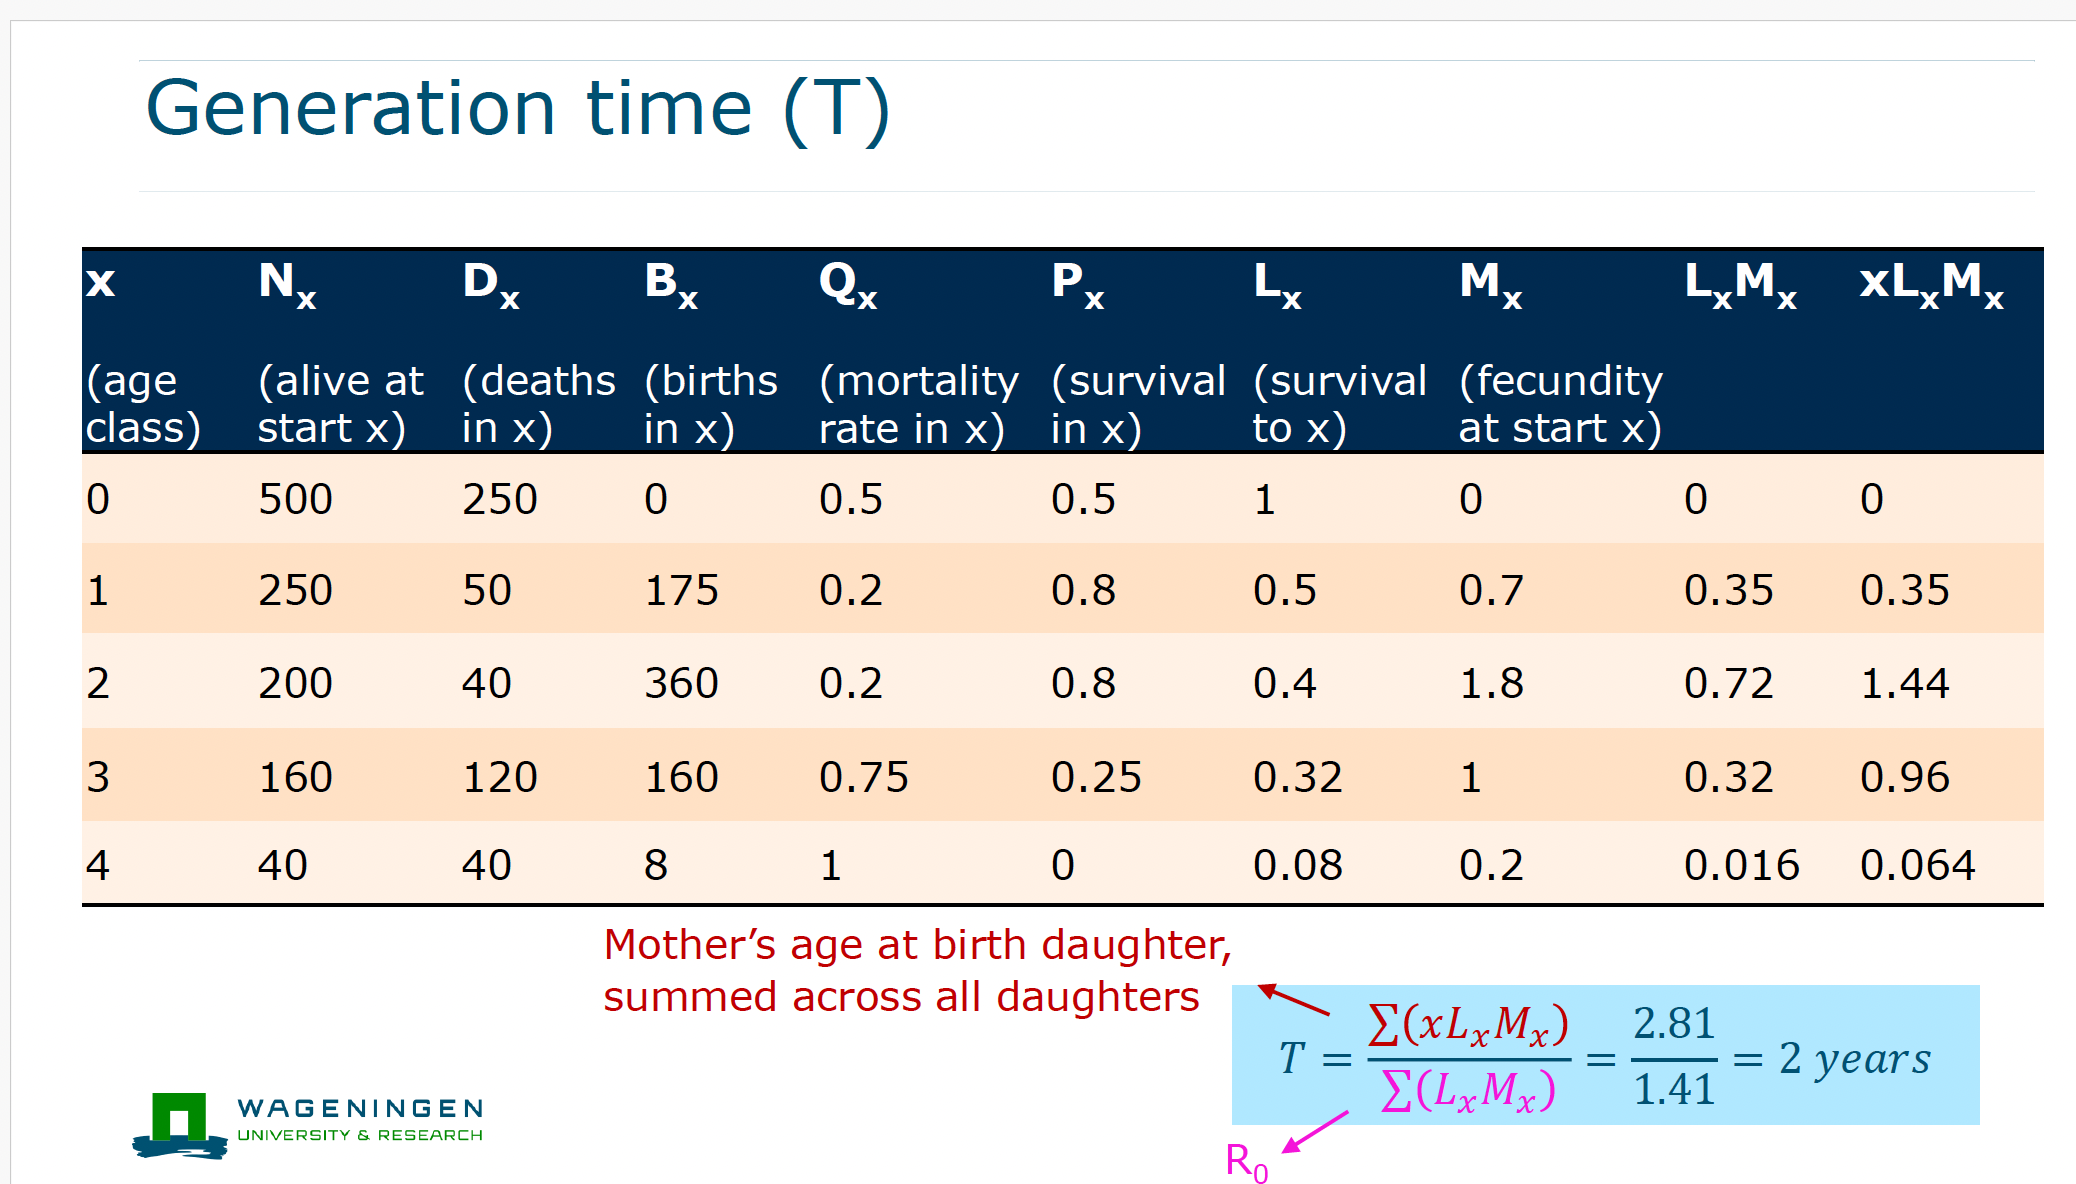
Generation time T
The average age at which individuals reproduce in a population
Generation time formula
T = sum of x times lxmx divided by sum of lxmx meaning weighted average age of reproduction
Why generation time matters
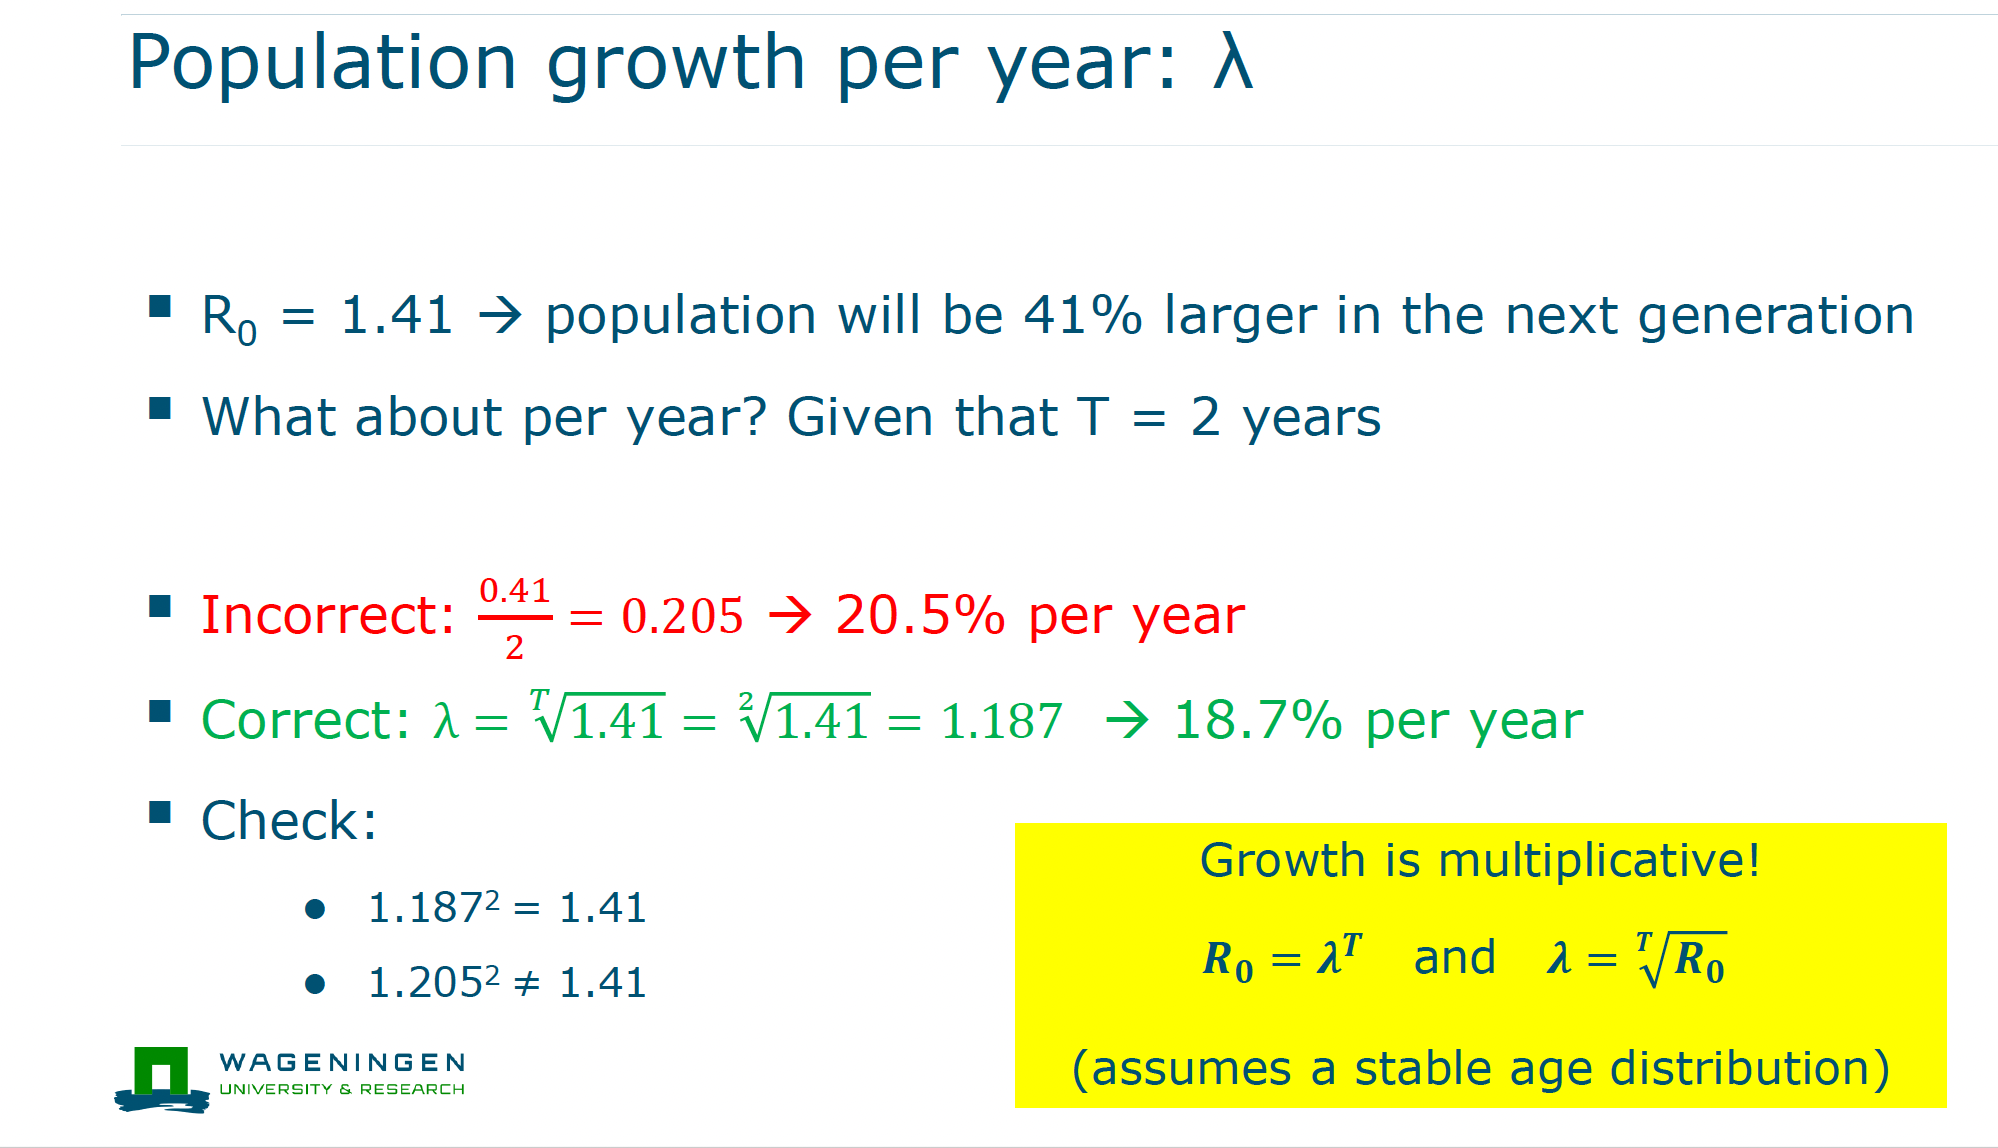
It links reproduction per generation to growth per year
Lambda λ (population growth rate)
The factor by which a population multiplies per time step usually per year
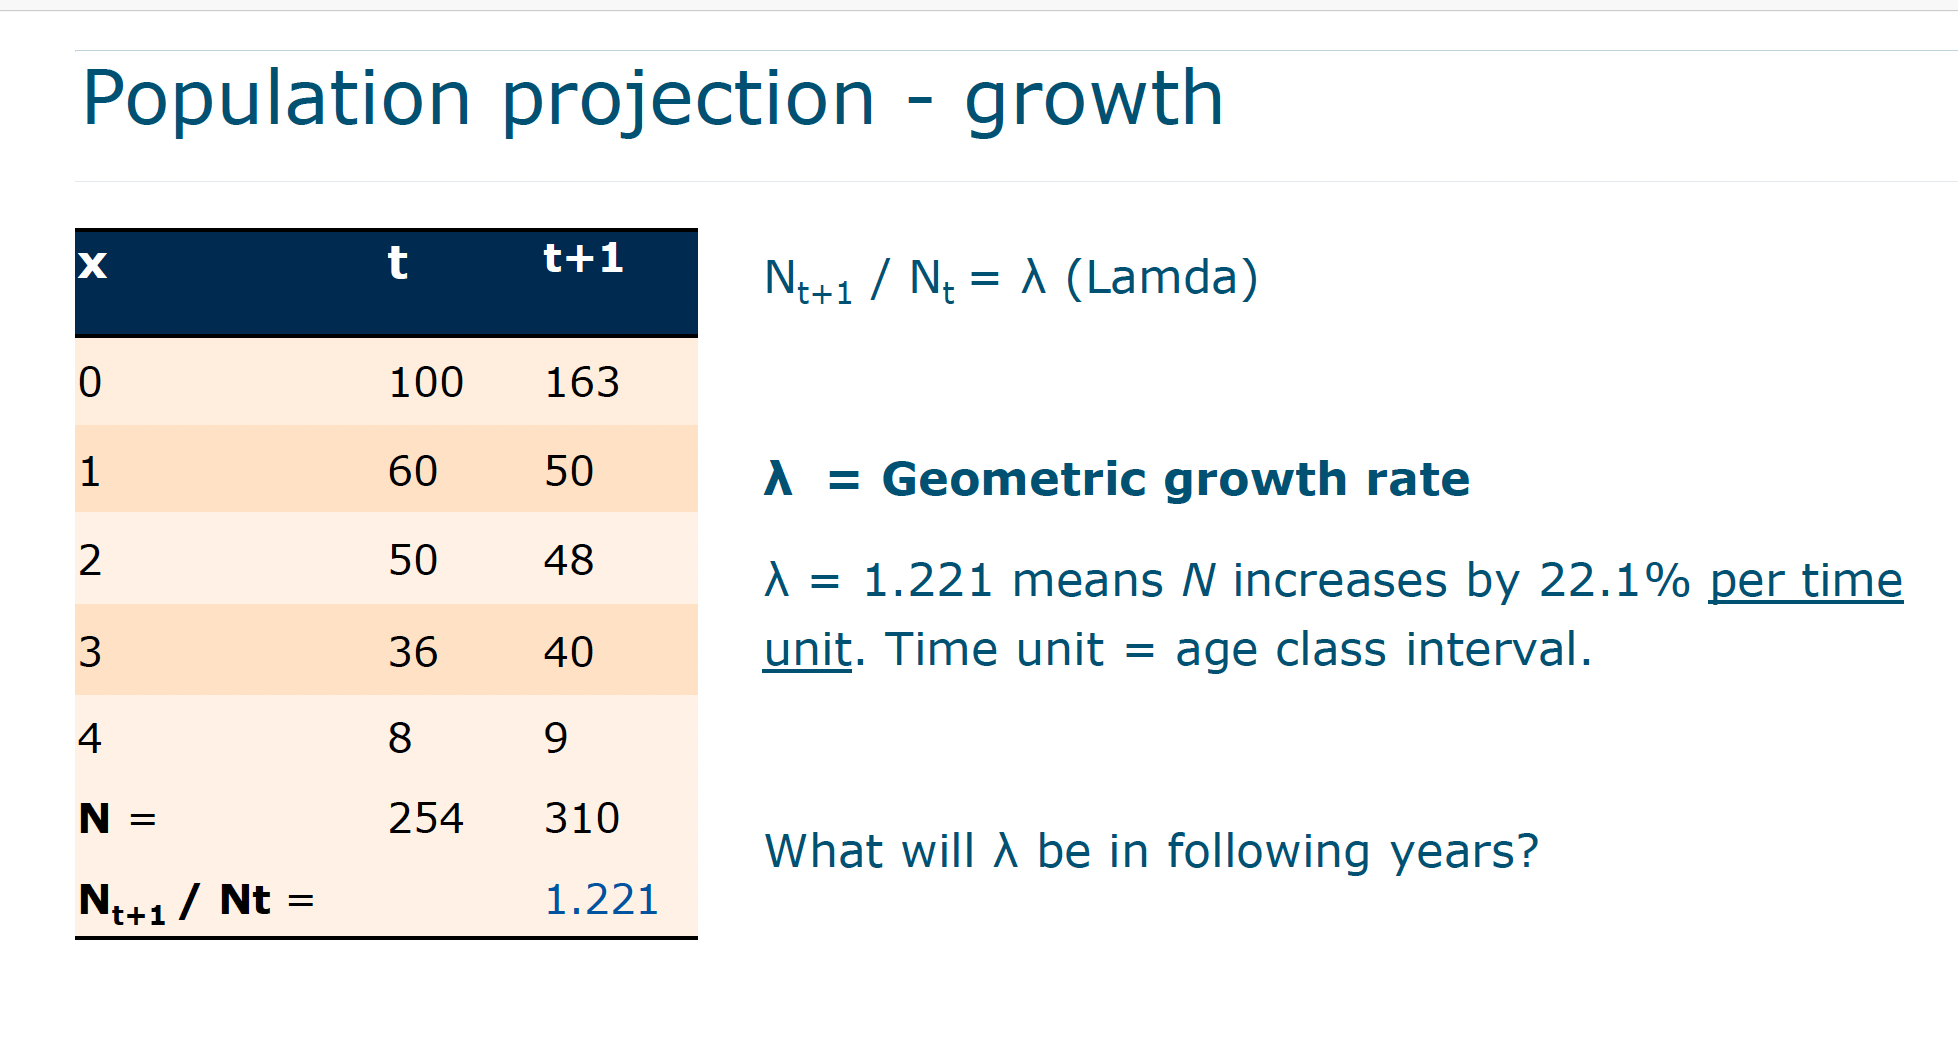
Lambda formula
λ = Nt+1 divided by Nt meaning how much the population changes between time steps
Interpretation of λ greater than 1
Population increases in size
Interpretation of λ equal to 1
Population remains constant
Interpretation of λ less than 1
Population decreases
Relationship between R0 T and λ
λ = R0 to the power of 1 divided by T converting growth per generation to growth per year
Continuous growth rate r
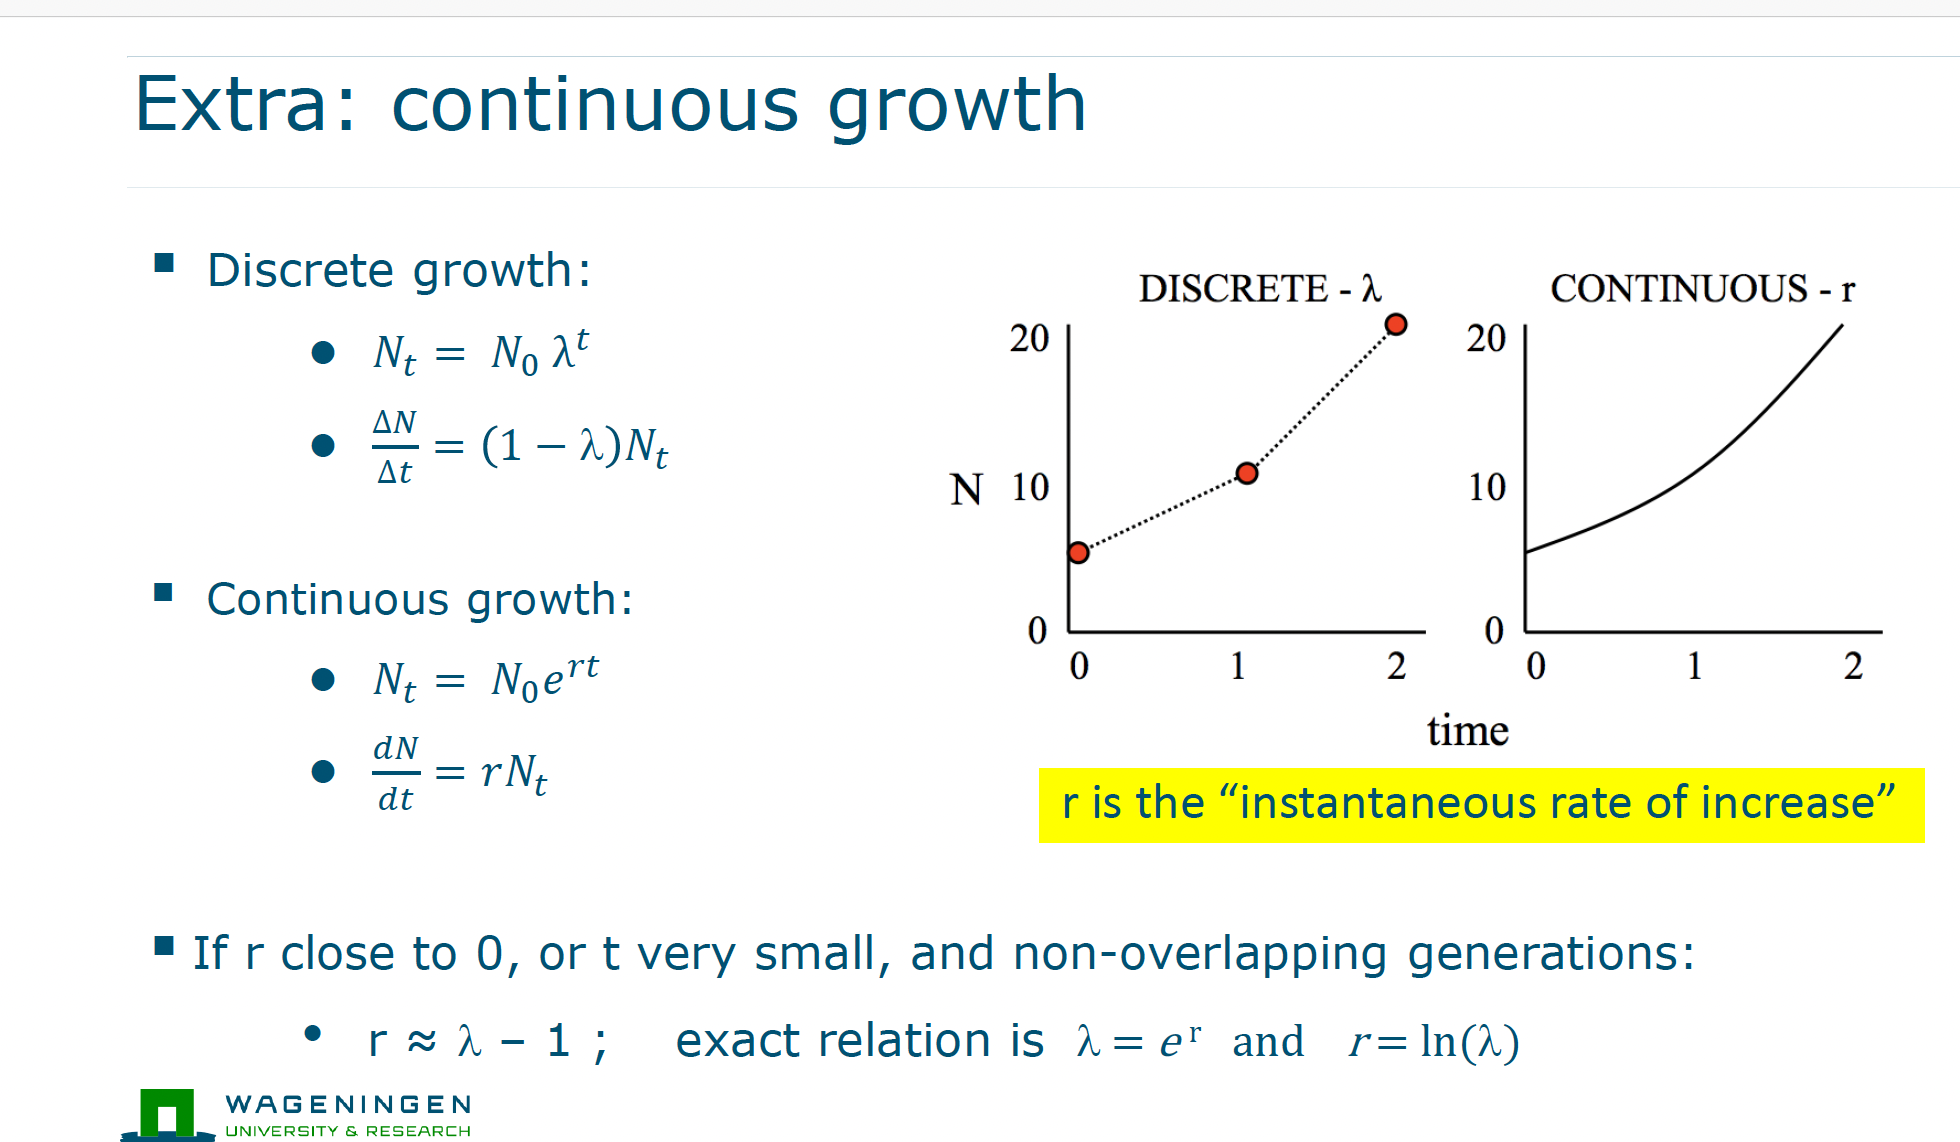
The instantaneous growth rate describing continuous population change
Relationship between r and λ
r = ln of λ and λ = e to the power of r
Intuition of r
It represents the underlying growth tendency of the population in continuous time
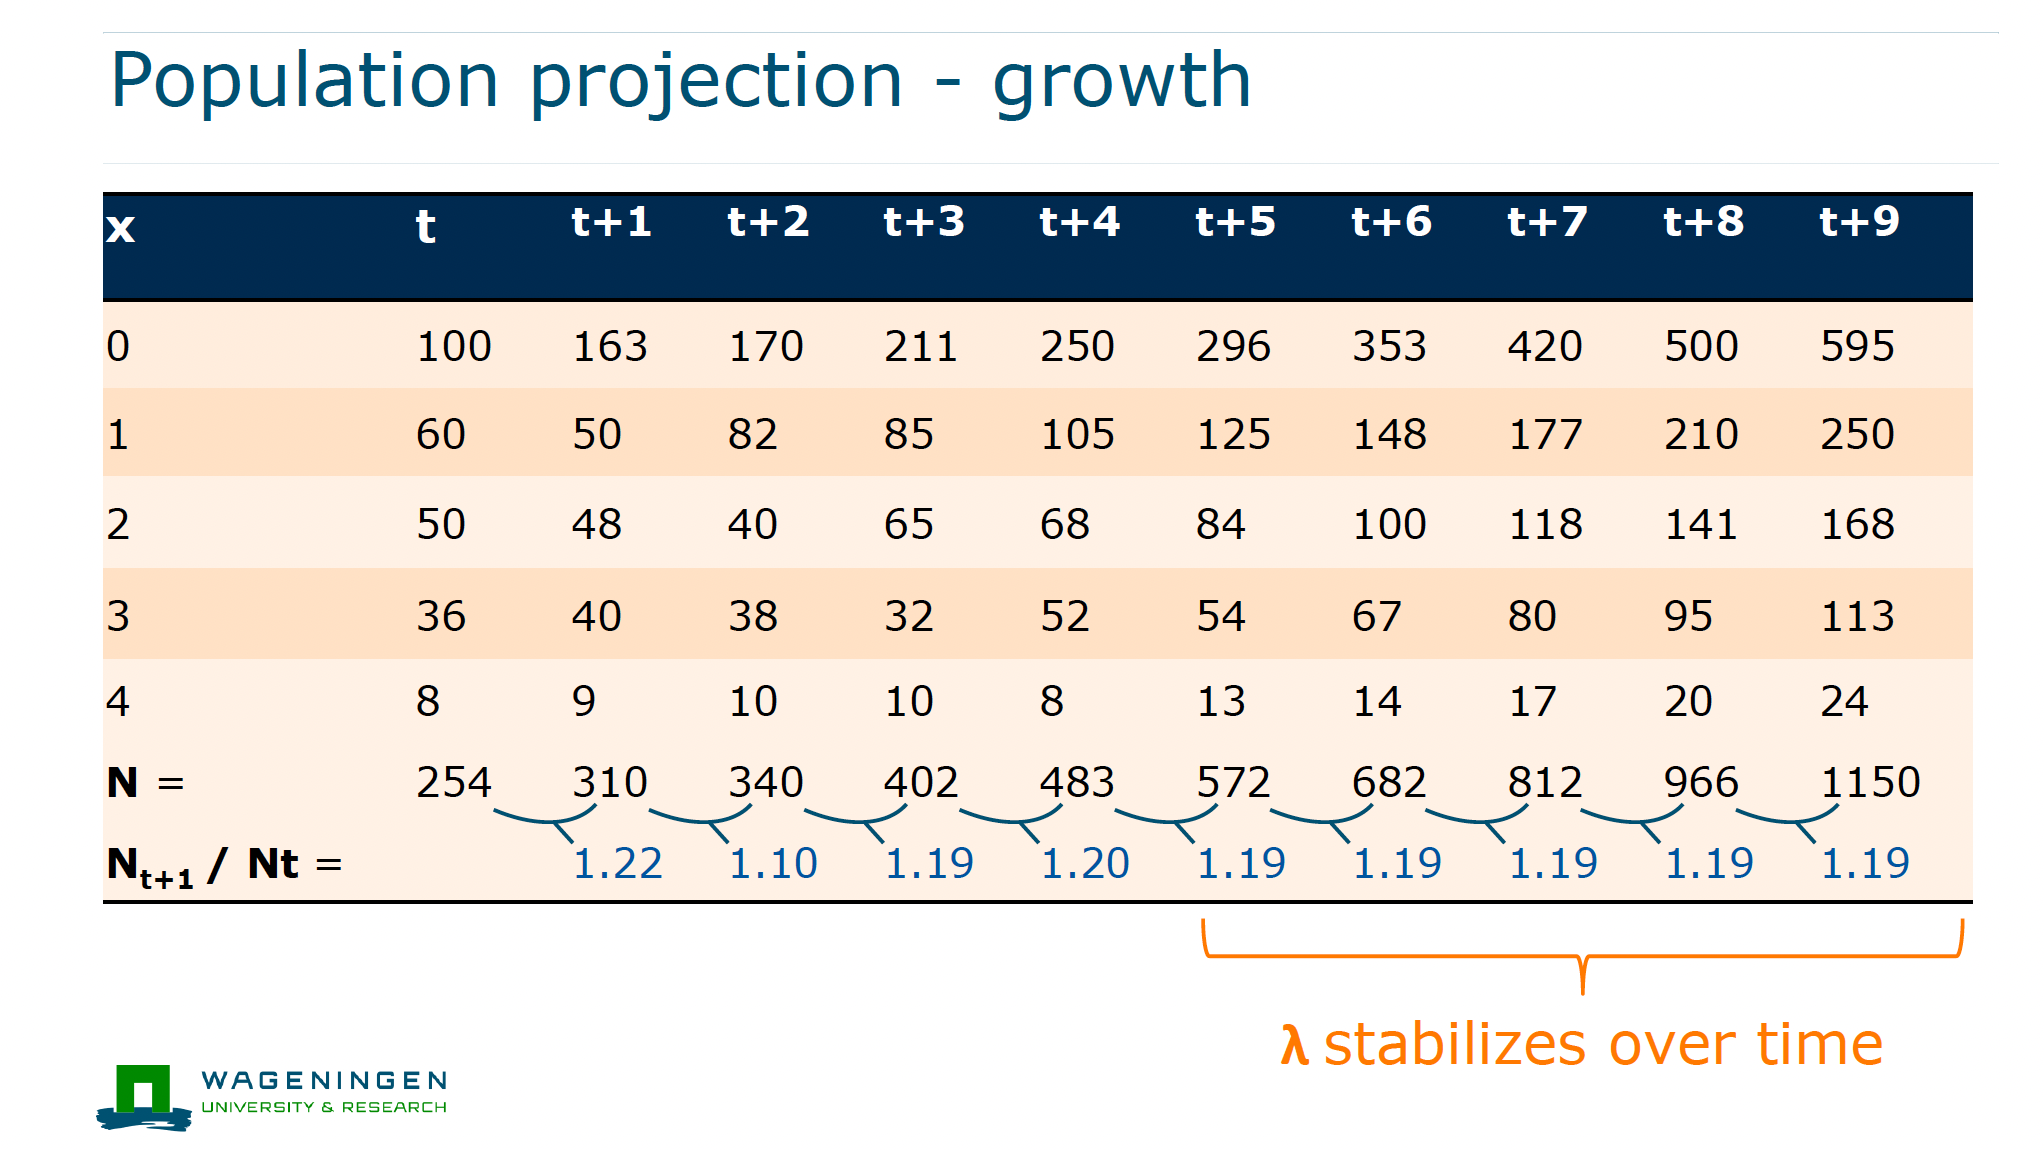
Population projection
A method to predict future population size and structure using survival and reproduction rates

Key idea of projection
Individuals either survive to the next age or produce offspring

Projection survival step
Number in next age class equals current number times survival rate px
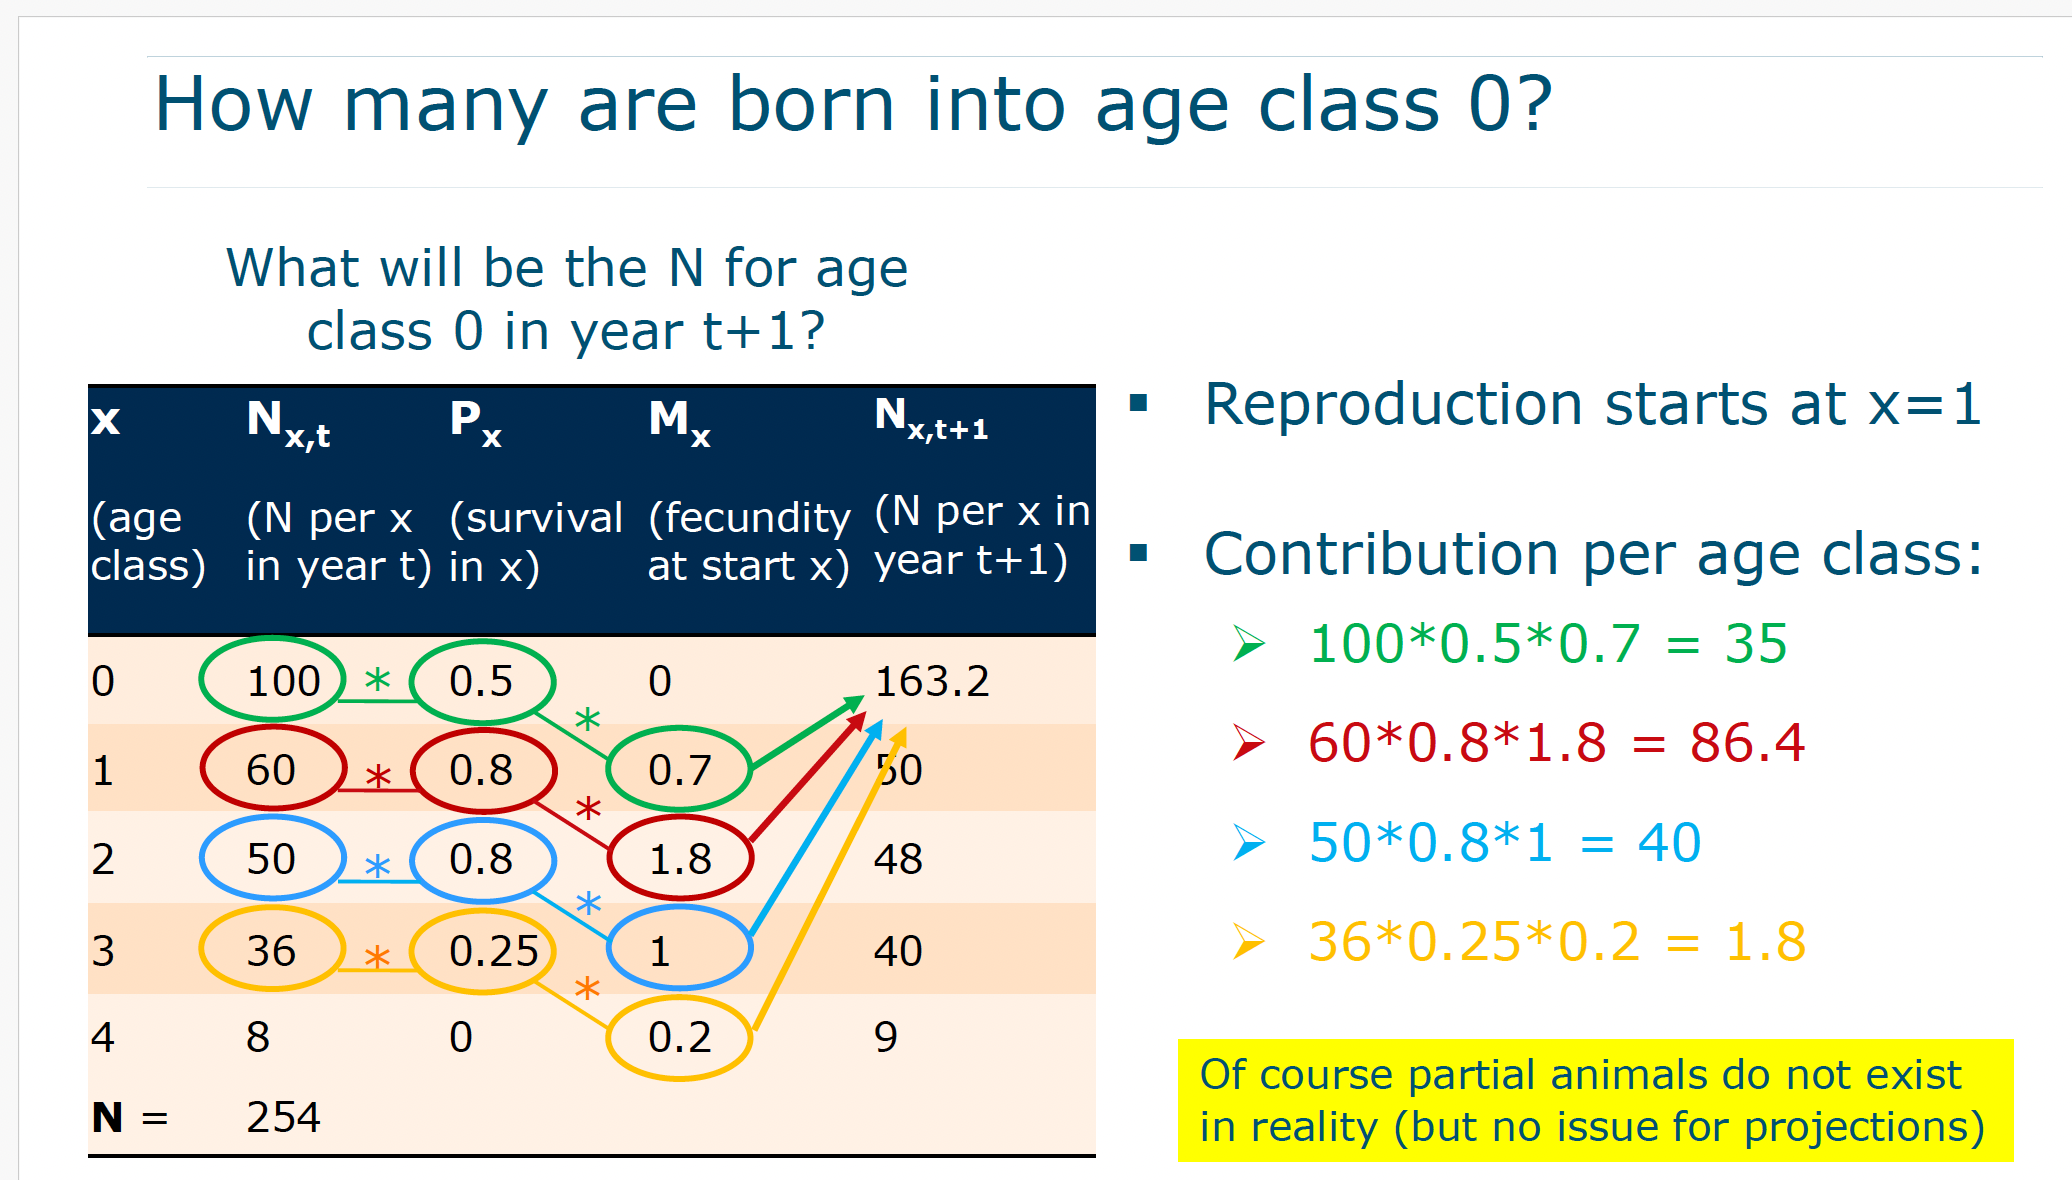
Projection reproduction step
Number of newborns equals sum of all individuals times px times mx
Why survival is applied before reproduction
Only individuals that survive can reproduce in the next time step
Total population size N
The sum of individuals across all age classes

Lambda from projection
λ can be calculated as Nt+1 divided by Nt after each projection step
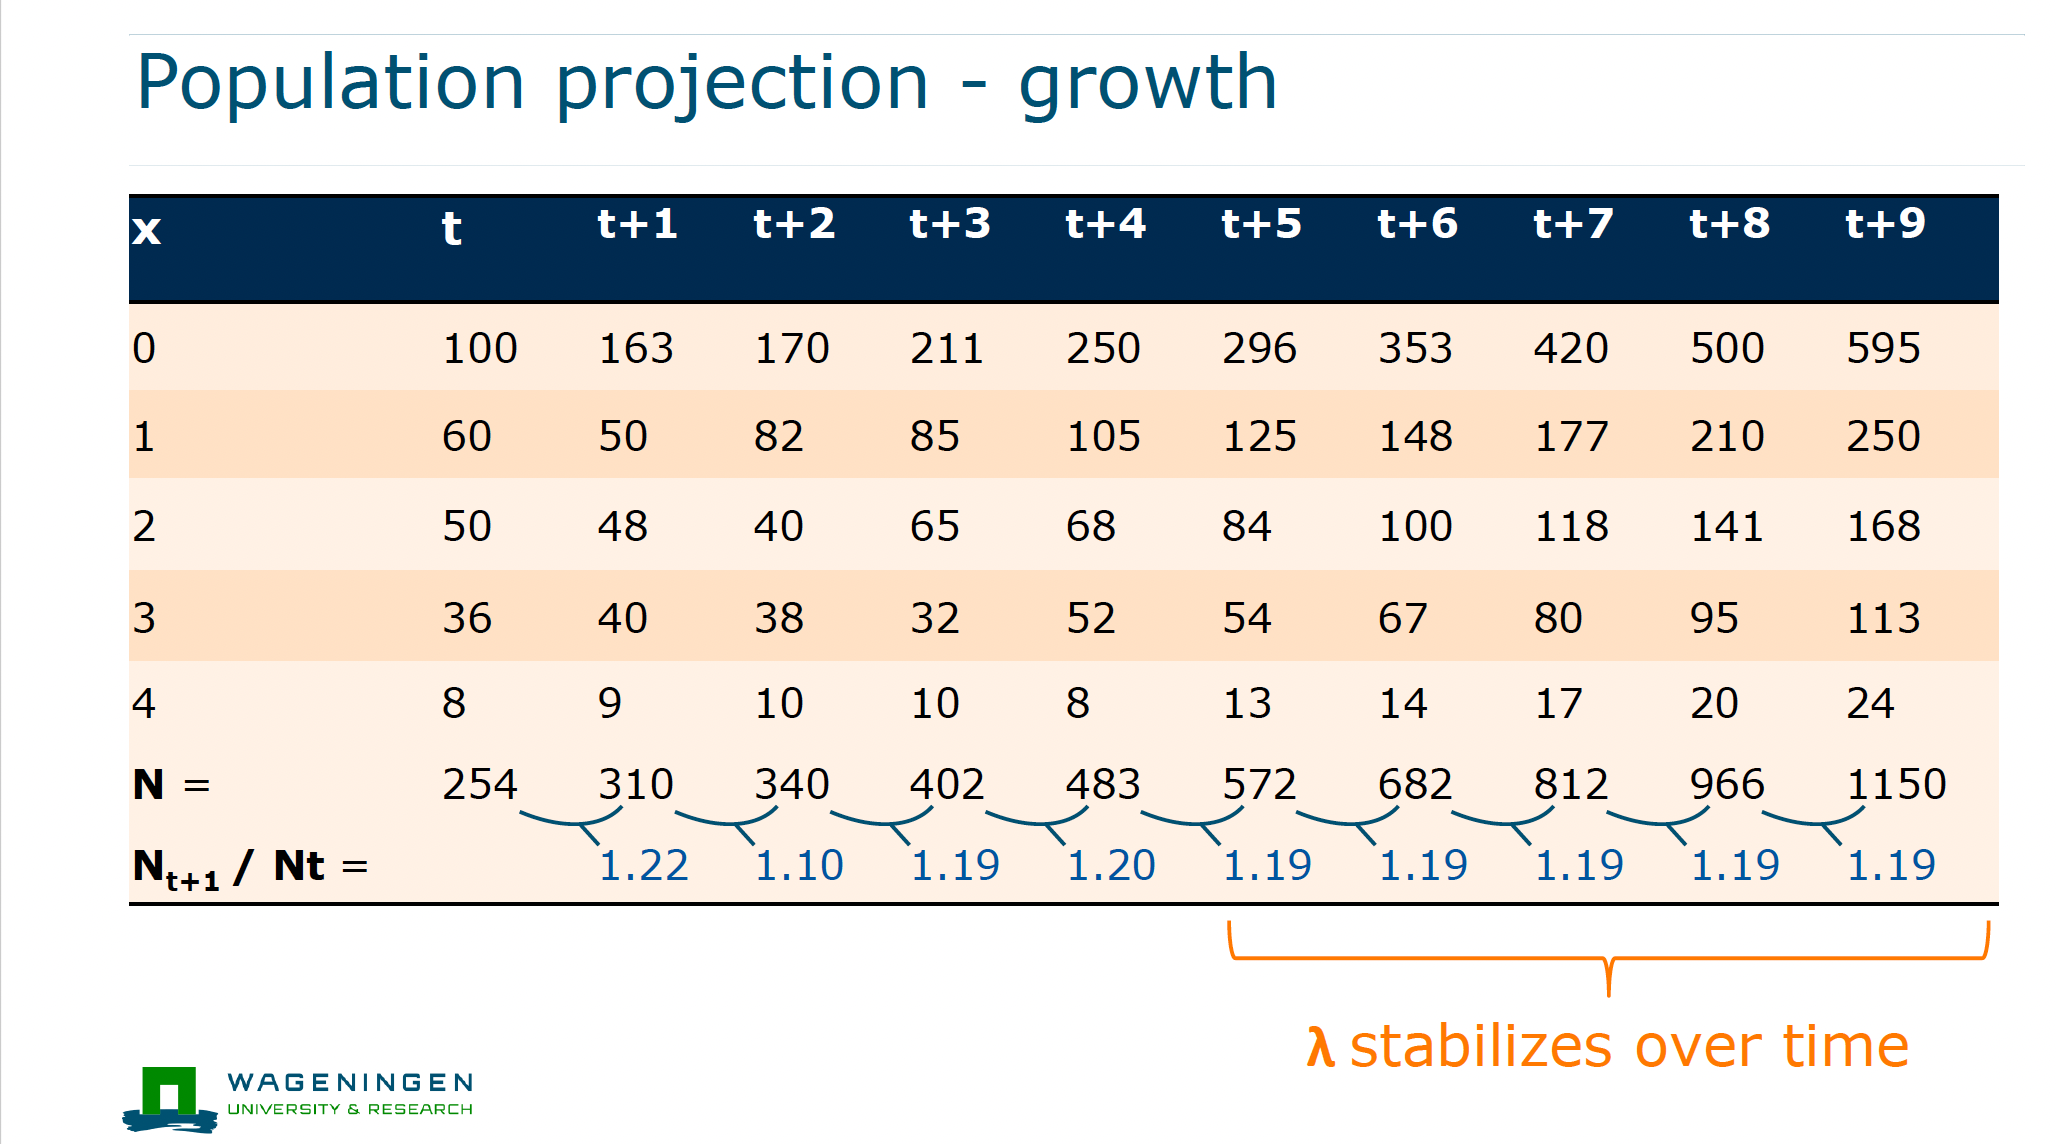
Why λ changes initially
The age structure is not yet stable so growth fluctuates

Stable age distribution
A situation where the proportion of individuals in each age class becomes constant

Why λ stabilizes
Once age structure stabilizes population grows at a constant rate
Deterministic projection
A projection assuming fixed survival and reproduction without randomness
Stochastic effects
Real populations vary due to randomness in survival reproduction and sex ratio
Carrying capacity K
The maximum population size the environment can sustain
Why populations do not grow infinitely
Limited resources predation disease and space restrict growth
Exponential growth
Population growth where numbers increase multiplicatively without limits
Logistic growth
Population growth that slows down as it approaches carrying capacity
Difference between exponential and logistic growth
Exponential ignores limits while logistic includes environmental constraints
r selected species
Species that reproduce quickly produce many offspring and invest little per offspring
K selected species
Species that reproduce slowly produce few offspring and invest heavily in each
Demography and genetics link
Population size and structure affect genetic diversity and inbreeding
Effect of small population size
Leads to stronger drift more inbreeding and loss of genetic diversity
Effect of unequal sex ratio
Reduces effective population size and genetic diversity
Inbreeding depression link
Increased inbreeding can reduce survival and reproduction
Why generation time matters in genetics
Evolutionary processes like drift and selection act per generation not per year
Population management goal
Maintain growth and genetic diversity while avoiding excessive inbreeding
Key exam insight
Population growth depends on both survival and reproduction and is always multiplicative not linear