Economics: Supply & Demand Curves, Equilibrium, and Market Interventions
1/157
There's no tags or description
Looks like no tags are added yet.
Name | Mastery | Learn | Test | Matching | Spaced | Call with Kai |
|---|
No analytics yet
Send a link to your students to track their progress
158 Terms
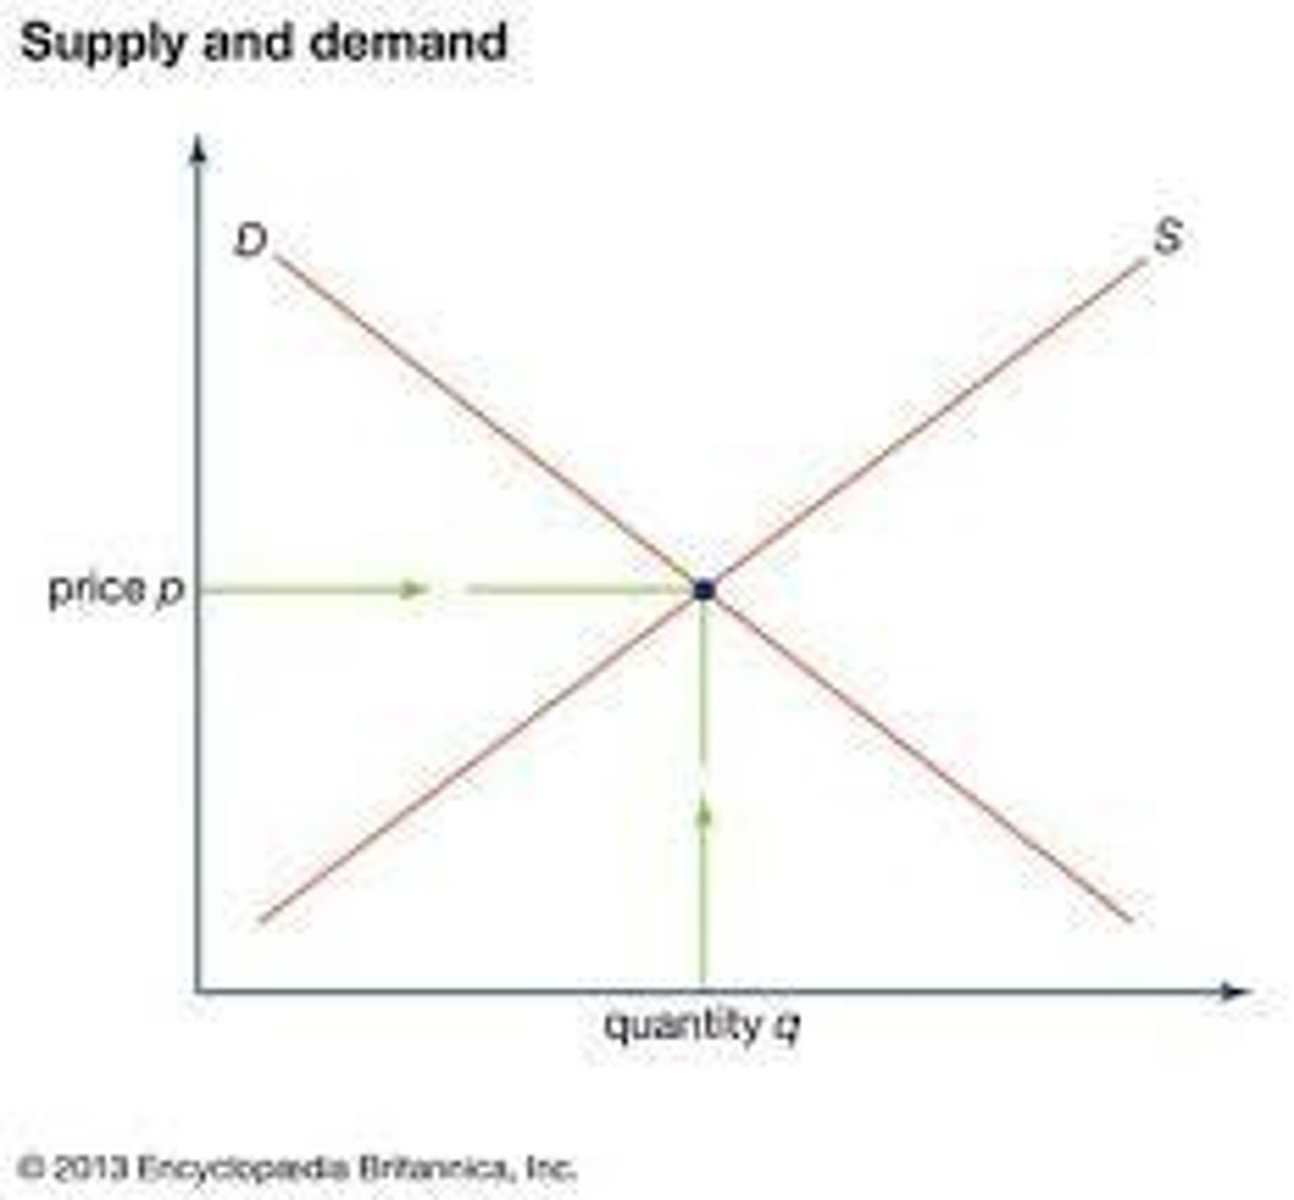
Supply curve
positive relationship between quantity supplied and price
Demand curve
negative relationship between quantity demanded and price
Equilibrium point
intersection point of the supply curve and the demand curve (Only at EP does Qs = Qd)
Price too low
shortage (Qd > Qs)
Price too high
surplus (Qd < Qs)
Price
primary allocator of resources in a free market system. (invisible hand = Adam Smith)
Shortage exists
prices will rise towards equilibrium
Surplus exists
prices will fall towards equilibrium
Price ceiling
law that says the price is not allowed to go above a certain price. (rent controls, price gouging laws)
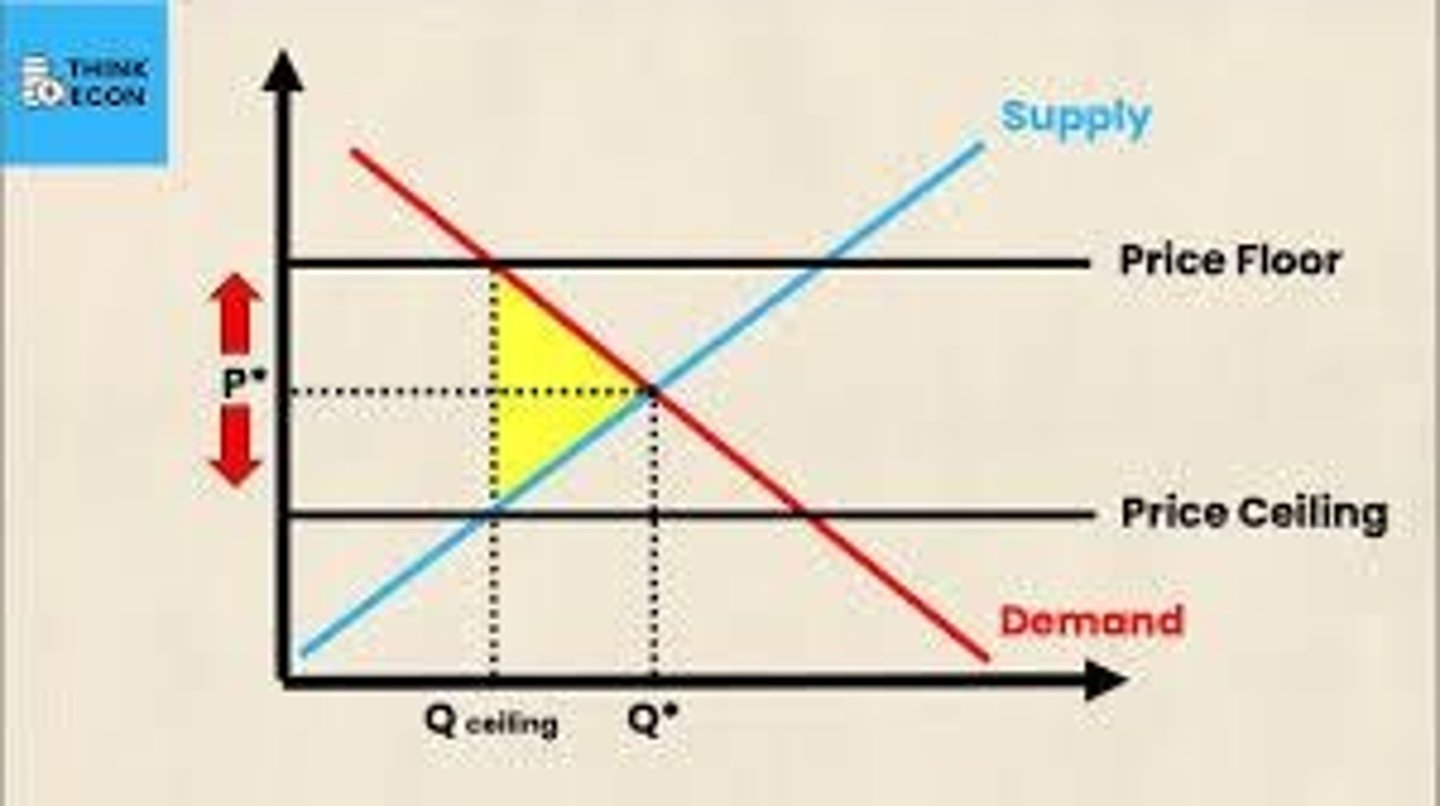
Price floors
Law that says the price is not allowed to go below a certain price. (daily price supports, minimum wage)
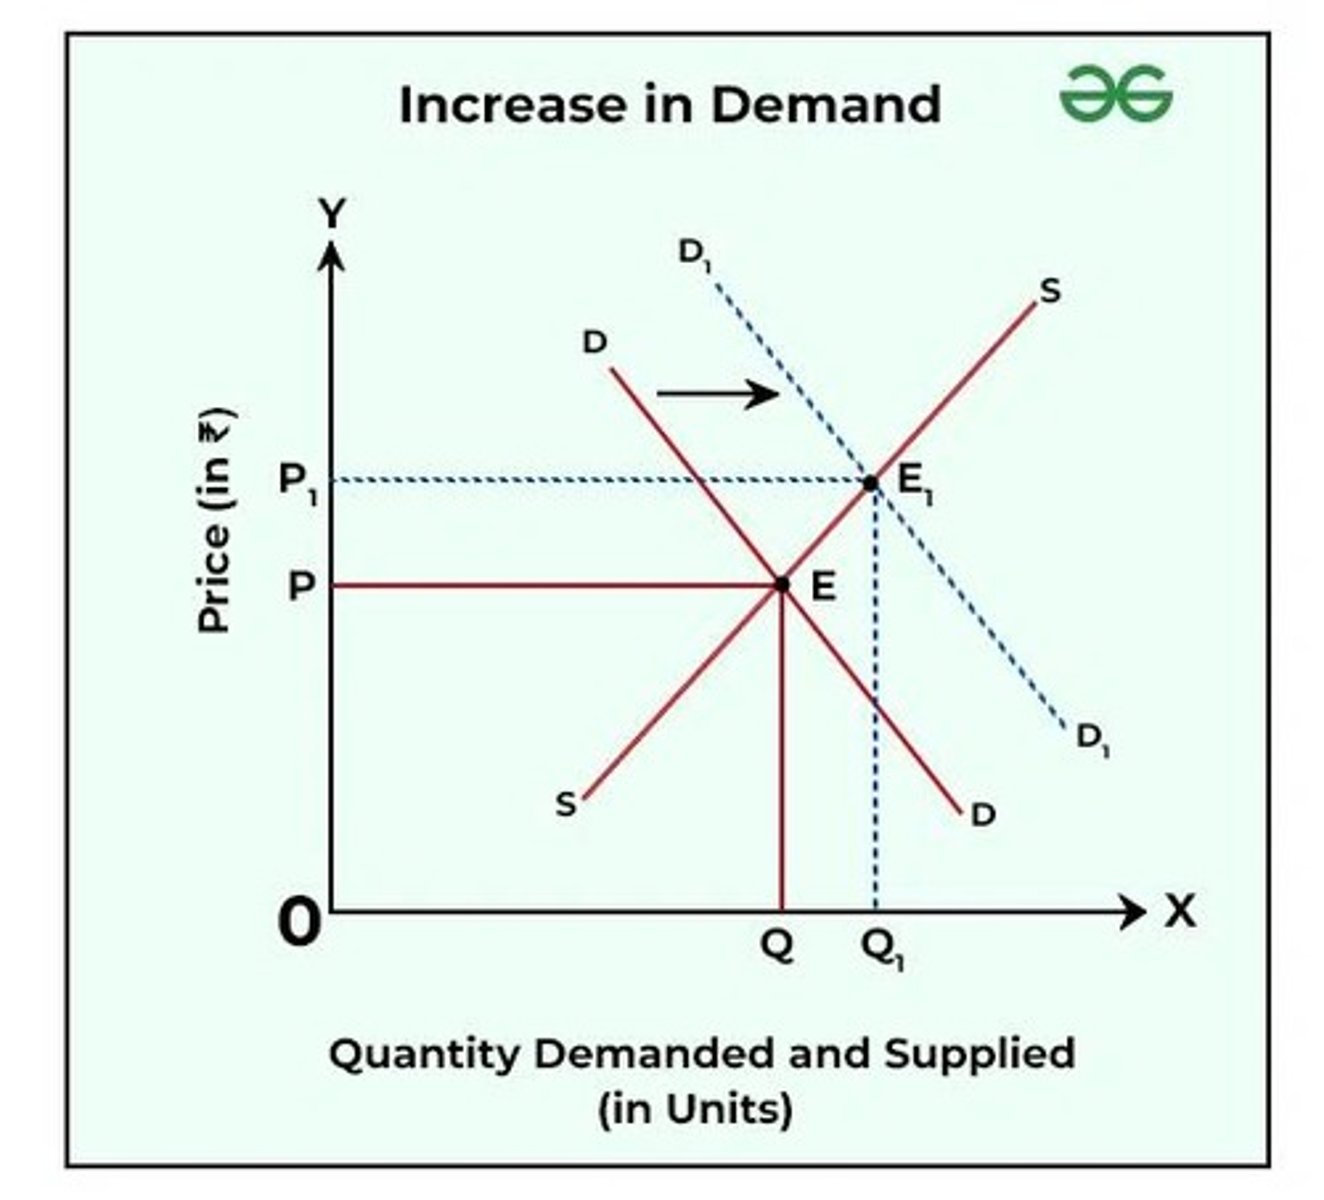
Demand increase
Demand curve shifts right, Price increases, Quantity increases
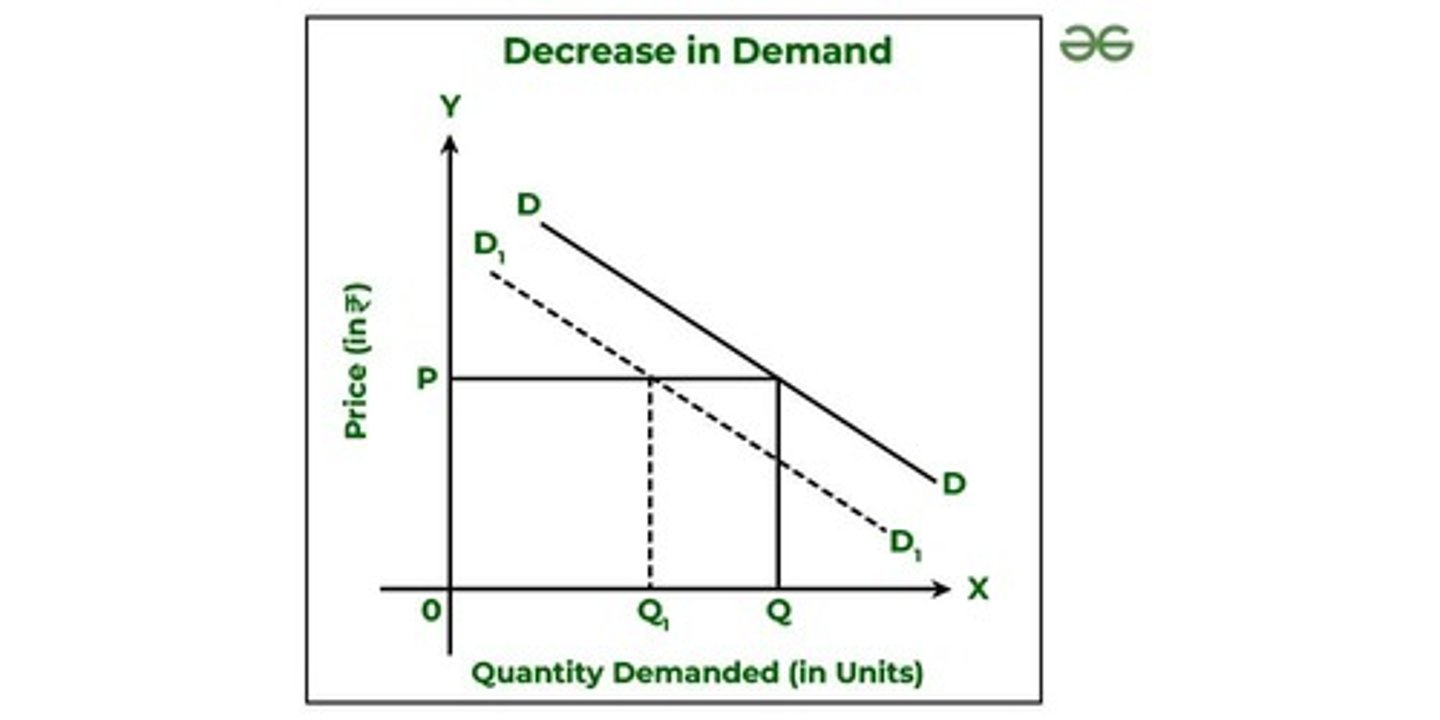
Demand Decrease
Demand curve shifts left, Price decreases, Quantity decreases
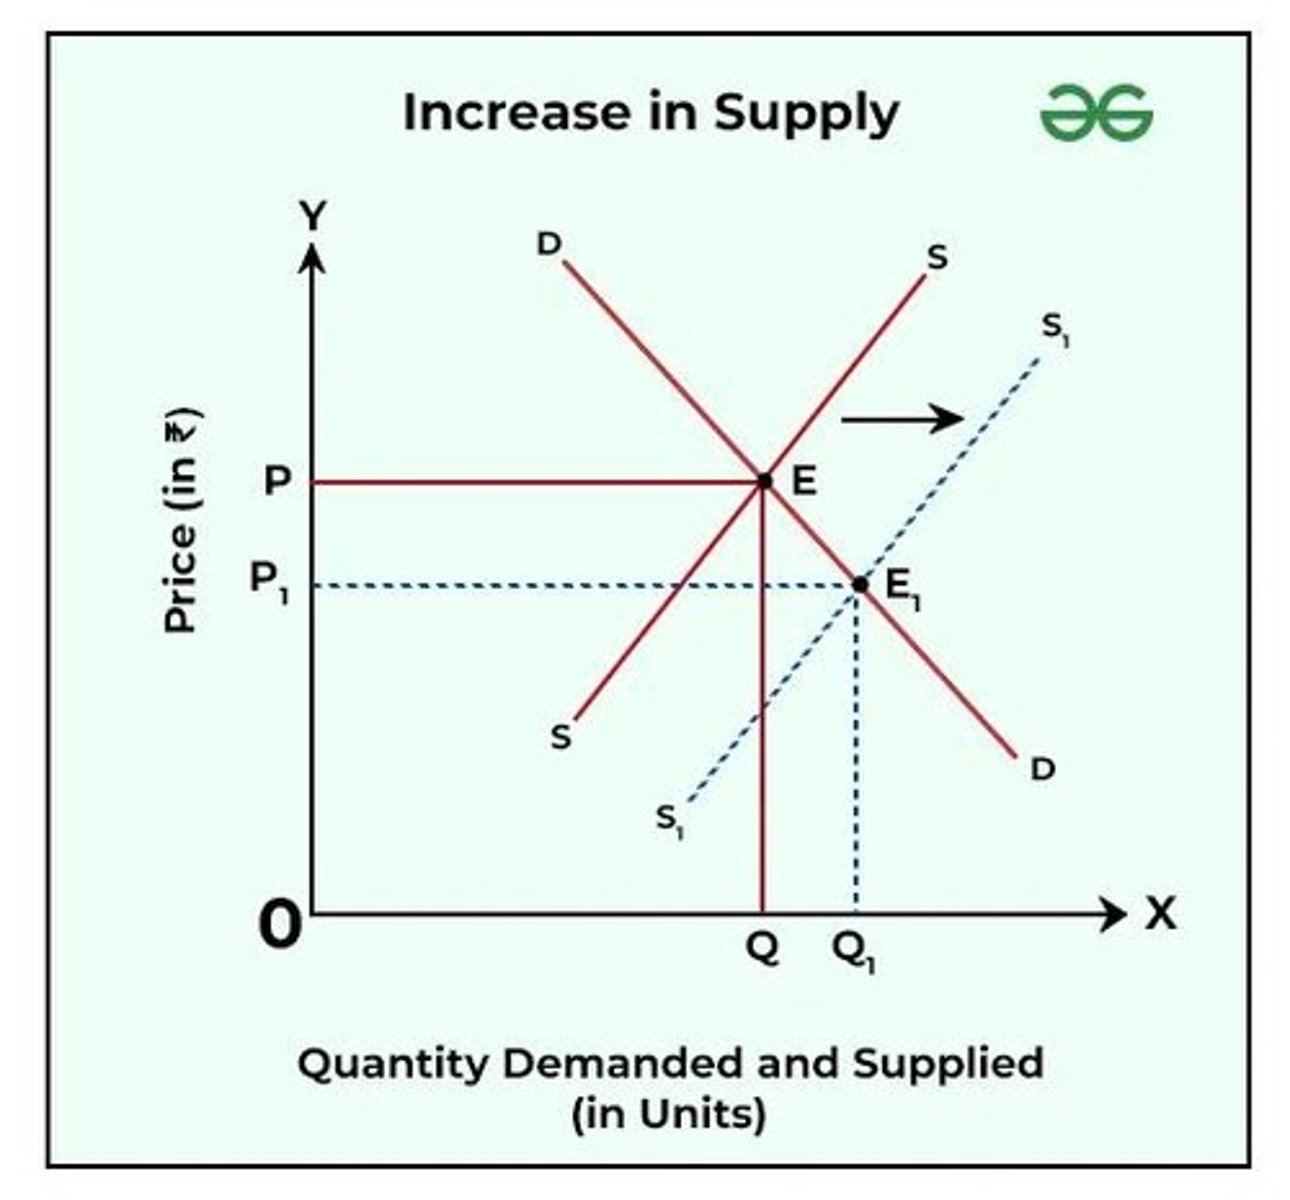
Supply Increase
Supply curve shifts right, Price decreases, Quantity increases
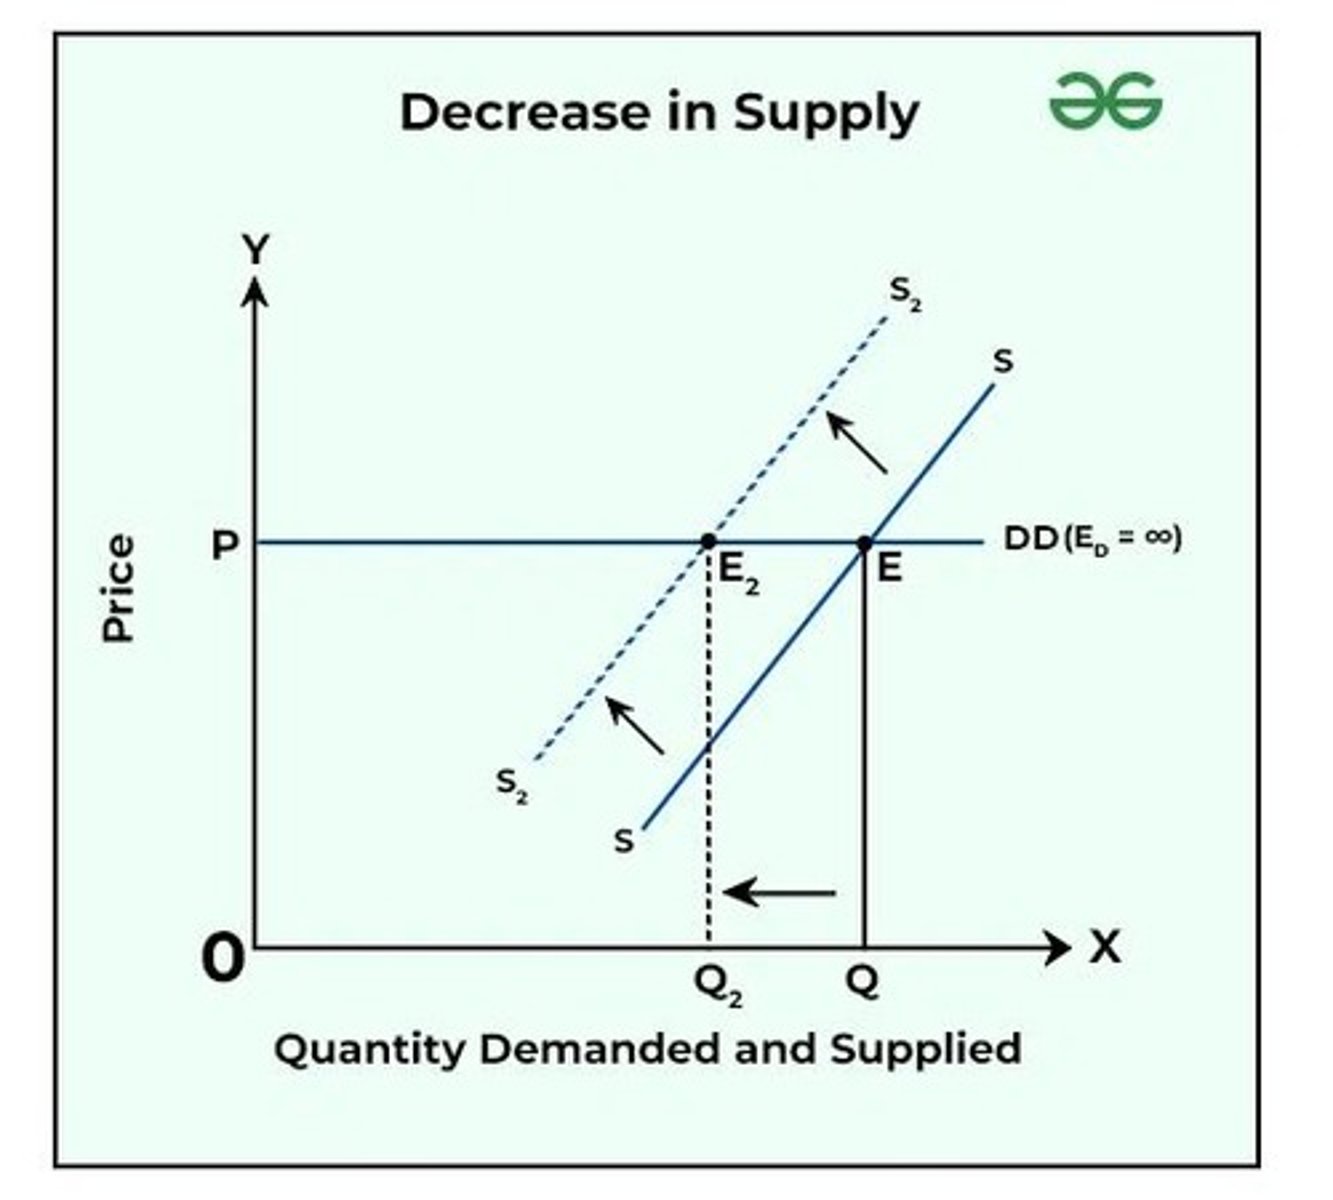
Supply Decrease
Supply curve shifts left, Price increases, Quantity decreases
Normative Economics
how things should be (opinions, values).
Positive Economics
how things are (facts, testable).
Cost-Benefit Analysis
Used by individuals, firms, and governments. Decision rule = Benefits - Costs.
Substitutes
Price of X ↑ → demand for Y ↑ (e.g., Coke & Pepsi).
Complements
Price of X ↑ → demand for Y ↓ (e.g., Coffee & Cream).
Normal Goods
Income ↑ → demand ↑ (e.g., vacations, restaurants).
Inferior Goods
Income ↑ → demand ↓ (e.g., ramen, cheap beer).
Network Effect
Demand rises as more people use it (e.g., social media, iPhones, colleges).
Exogenous Supply Shocks
Sudden events that decrease supply (e.g., storms destroying crops, war reducing oil supply).
Economics
the study of how society allocates scarce resources
Microeconomics
studies individual markets, firms, consumer
Macroeconomics
studies all markets together (the economy)
Scarcity
a limited amount of resources in society.
Opportunity cost
The cost of something is what you give up to get it. Opportunity cost is the value of the best foregone alternative.
You came to class today. What is your opportunity cost of coming to class
whatever you would be doing if you did not come to class
Specialization
when resources such as labor are devoted exclusively or overwhelmingly to a specific production task
Specialization Example
A tax accountant only does taxes. He doesn’t make his own milk from scratch. A dairy farmer makes milk. He doesn’t do his own taxes.
Trade
The foundation of all business activity. Part of everyday life.
Comparative Advantage
The ability of an individual, firm, or country to produce a good or service at a lower opportunity cost than another.
Absolute advantage
the ability to produce more of a good or service with the same amount of resources, or produce the same amount with fewer resources
Production Possibilities Curve
Illustration of the trade-off society faces from scarcity. (Production Possibilities Frontier)
Resources
Land, Labor, and Capital.
PPC shifting outwards
Good. (More output can be produced given the resources)
PPC shifting inwards
Bad. (pandemic, natural disaster)
Opportunity cost
Slope of PPC between 2 points
Ceteris Paribus
All Else Equal
Supply curve
= positive relationship between quantity supplied and price
Demand curve
= negative relationship between quantity demanded and price
Equilibrium point
= intersection point of the supply curve and the demand curve (Only at EP does Qs = Qd)
Price too low
= shortage (Qd > Qs)
Price too high
= surplus (Qd < Qs)
Price
= primary allocator of resources in a free market system. (invisible hand = Adam Smith)
Shortage exists
= prices will rise towards equilibrium
Surplus exists
= prices will fall towards equilibrium
Price ceiling
= law that says the price is not allowed to go above a certain price. (rent controls, price gouging laws) +(Government sets price ceiling = Qd > Qs = shortage)
Price floors
= Law that says the price is not allowed to go below a certain price. (daily price supports, minimum wage) (Government sets price floor = Qd < Qs = surplus)
Circumstances in which society may not want price to allocate resources
= (ex. Organ donations, ethical objections to “markets for everything”)
Demand curve shifts right
Price increases
Quantity increases
Demand Decrease
Demand curve shifts left
Price decreases
Quantity decreases
Supply Increase =
Supply curve shifts right
Price decreases
Quantity increases
Supply Decrease =
Supply curve shifts left
Price increases
Quantity decreases
%change in Quantity/% Change in Price ((NEW – OLD) / OLD)
Example = Suppose that a decline in the price of Good X from
$147 to $145 causes an increase in the quantity
demanded from 8,730 to 8,870.
8870 - 8730 / 8730 = 0.01604
145-147 / 147 = -0.0136
0.01604 DIVIDED BY -0.0136 = -1.179
Example #2 = Suppose that an increase in the price of Good Y from $1,050 to $1,080 causes a decrease in the quantity demanded from 204 to 200.
200 - 204 / 204 = -0.0196
1080 - 1050 / 1050 = 0.2857
-0.0196 DIVIDED BY 0.2857 = 0.0686
-0.686
Susie’s Consumer Surplus = 13600 – 12000 = 1,600
Bob’s Producer Surplus = 12000 – 11200 = 800
Economic efficiency (lesser DWL the better)
Distributional Effects (Vertical Equity)
Horizontal Equity
Simplicity in compliance and ease of administration
Politically acceptable way of raising revenue
Inputs from workers (labor) and other businesses (raw materials and capital / financing)
Costs
Accounting Profit formula
Revenue – Explicit Costs
Economic Profit formula
Revenue – Implicit Costs – Explicit Costs (Accounting Profit – Implicit Costs)
Opportunity costs that show up on a financial statement. Typically money exchanges hands. (Ex: Pizza place paying the bakery for dough.)
Must decide on how much output (Q) to produce. Must decide the method to produce the output. Must decide on product attributes. Must decide on any alternative pricing schemes
Marginal Cost
the additional cost incurred from producing one additional unit of output (the change in total cost from producing one more unit of output.)