Efficiency - Week 10
1/4
There's no tags or description
Looks like no tags are added yet.
Name | Mastery | Learn | Test | Matching | Spaced | Call with Kai |
|---|
No analytics yet
Send a link to your students to track their progress
5 Terms
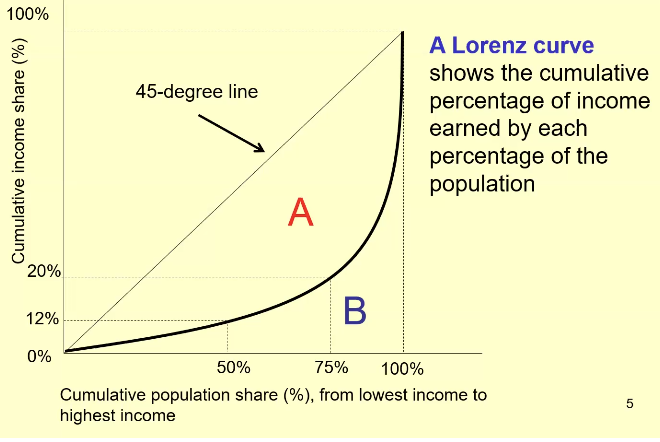
Lorenz curve
Shows the cumulative percentage of income earned by each percentage of the population. Top 25% at the bottom of the graph represents the top portion of high income earners (jointly earning) where cumulative income shoots up from 20% to 100%
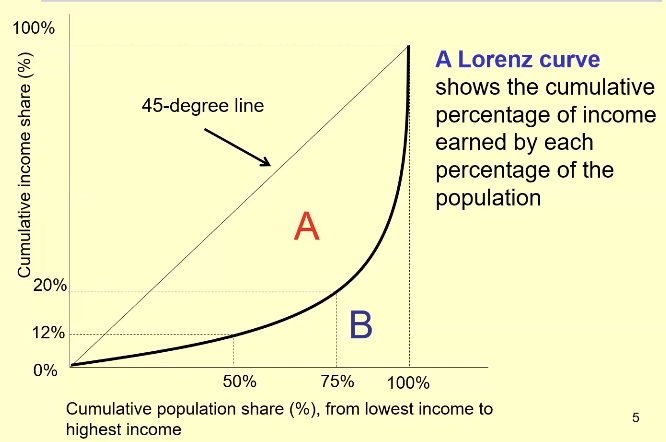
Gini coefficient
area A/ area A + area B
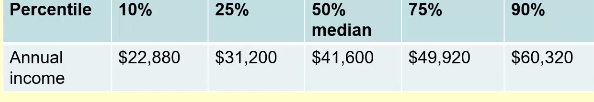
Percentile wage
Estimates the value of a wage which a certain percent of workers fall (belong)
Factors affecting skilled and less skilled workers
there has been a rise in the rate of return on education
there has been a rise in the number of educated
the supply of and demand for less skilled workers have declines
skilled labour market experienced both higher wages and higher employment
Key findings on income inequality
43% of adults pay no tax income
the top 1% of income taxpayers are male, middle aged and london based
these patterns become more pronounced at even higher income levels
the top 1% of income taxpayers are not a stable group- a quarter of those in the top 1% in one year will not be there in five years