Presentation of quantitative data
1/6
There's no tags or description
Looks like no tags are added yet.
Name | Mastery | Learn | Test | Matching | Spaced |
|---|
No study sessions yet.
7 Terms
Summarising data in table
Summary tables are not usually from the raw scores but the data has been converted into descriptive statics
Bar charts
Bar charts are used when data is dodged into categories, other wise knows as discrete information. The bars DO NOT touch each other which shows they are separate conditions
Histograms
In a histogram, the bars touch each other , which shows the x-axis data is continuous rather than discrete. The y-axis represents frequency
Scattergrams
These are used to show associations between co-variables rather than the differences
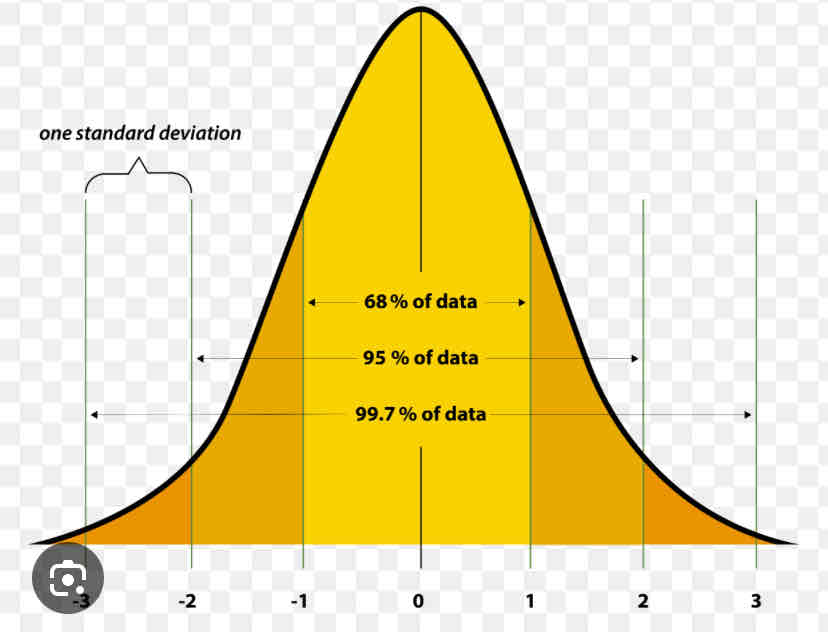
Normal Distributions
A symmetrical pattern of frequency data that forms a bell shaped pattern. The mean, mode and media all occupy the same midpoint of the curve
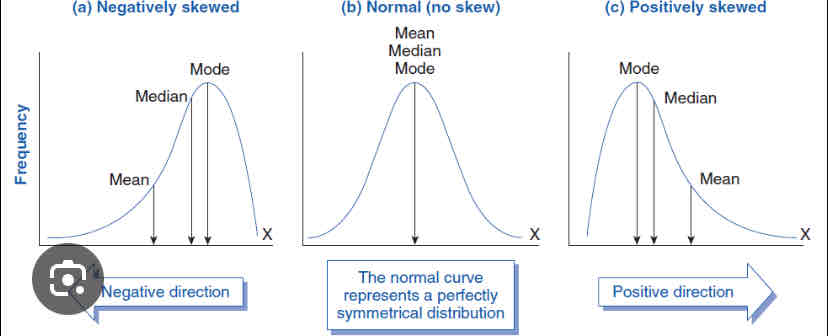
Skewed distribution
A spread of frequency data that is not symmetrical, the distributions lean to one side or the other. There are 2 types:
Positive skew - this is when most of the distributions lean to towards the left of the graph, resulting in a long tail on the right
Negative skew - this is when most of the distribution la lean towards the right of the graph, resulting in a long tail on the left
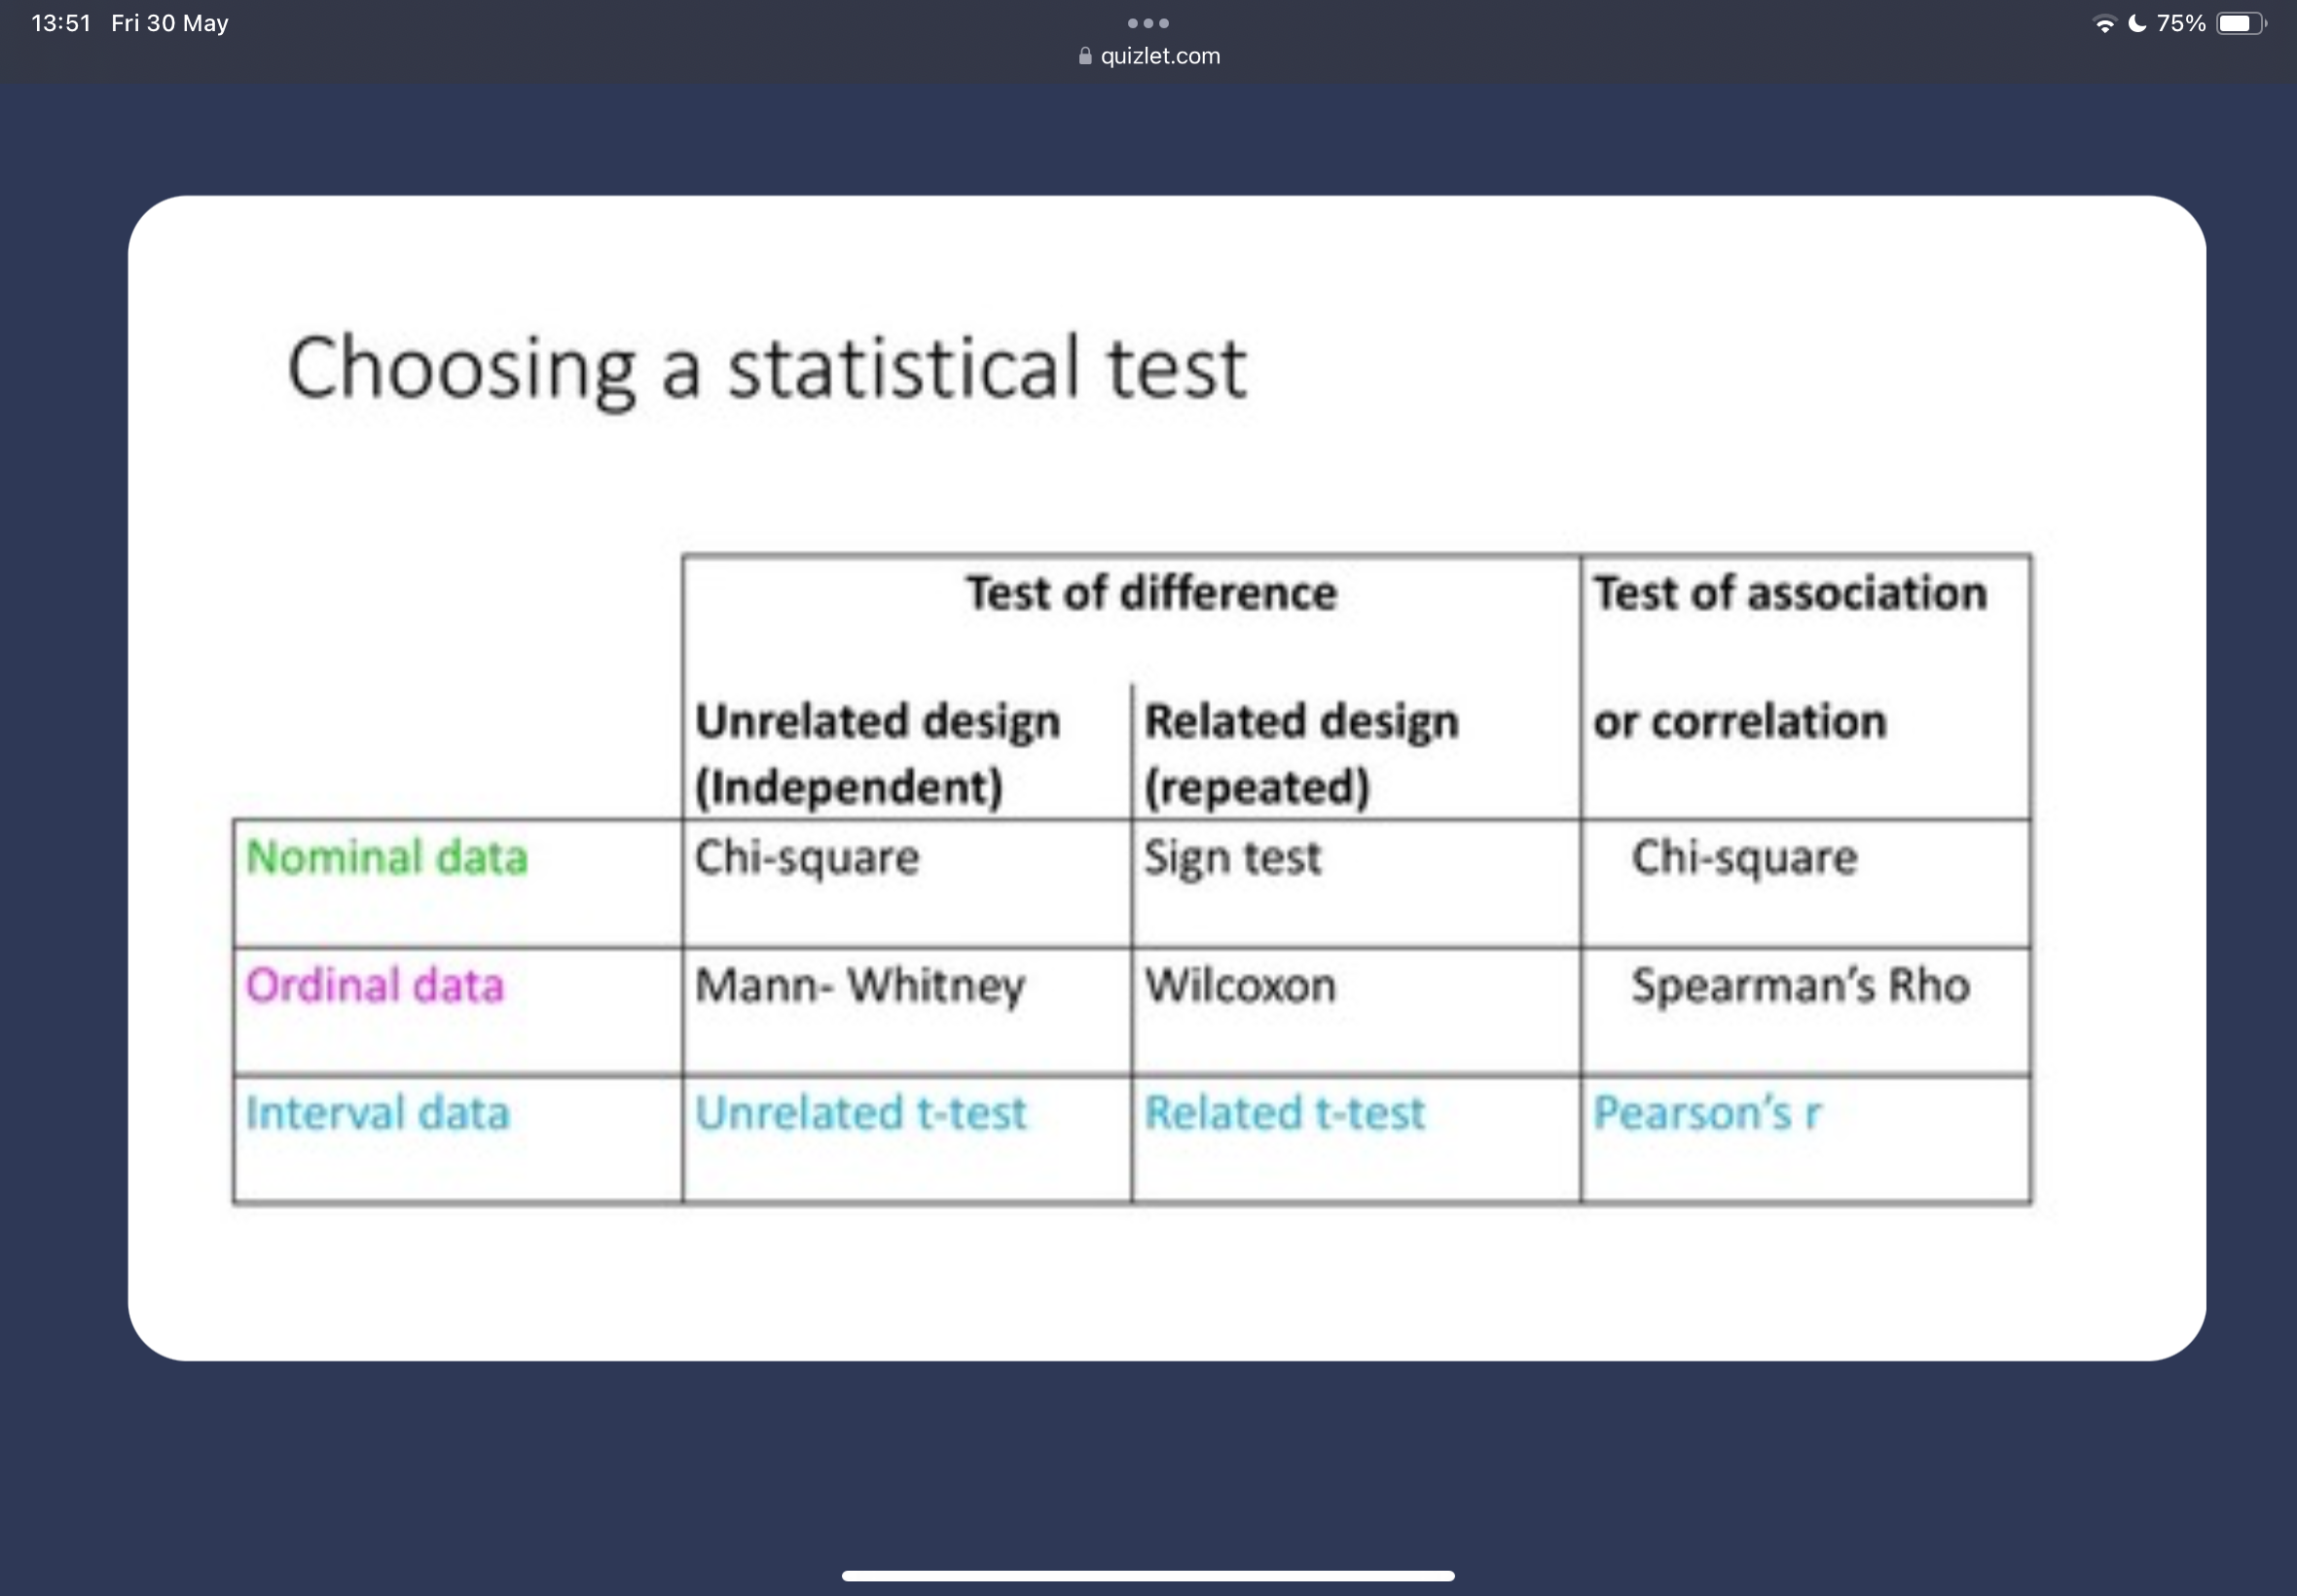
Statical tests
Table for statical testing