Week 8- The Neurobiology of Intelligence
1/19
There's no tags or description
Looks like no tags are added yet.
Name | Mastery | Learn | Test | Matching | Spaced | Call with Kai |
|---|
No analytics yet
Send a link to your students to track their progress
20 Terms
Common IQ tests (e.g. WAIS/WISC) and neurodivergence
• Some adjustments can be done
• Colourblind version of some tasks
• Visual/auditory versions
• In WAIS-V, clinician can skip some tasks
• However, tasks often applied without (all required) adjustments
• Neurodivergent individuals may be at a disadvantage
• Other populations (e.g. immigrants) may be as well
Wilson (2023) - Meta-Analysis
Data from 1,800 neurodivergent people (autism and ADHD) • Children and adults (WISC and WAIS)
• Autism performance: • Verbal and nonverbal reasoning: in typical range • Processing speed: ∼1 SD below the mean • WM: Slightly reduced
• ADHD performance: • Mostly at age-expected levels • WM: slightly reduced scores
Brain Size/IQ debate
Systematic review of published and unpublished studies. • 88 studies: 148 healthy and clinical mixed-sex samples (>8000 individuals). • Significant positive correlation (r = .24) between brain volume and IQ. • Generalised over age (children vs adults), IQ domain, Sex. • Evidence of publication bias in favour of studies showing strong positive correlations - with small and non-significant associations often omitted from reports.
CONCLUSIONS: >> the strength of the positive association of brain volume and IQ, although robust, has been overestimated in the literature. >> “While it is tempting to interpret this association in the context of human cognitive evolution and species differences in brain size and cognitive ability…it is not warranted to interpret brain size as an isomorphic proxy of human intelligence differences.”
correlation with number of nerons and iq
50 postmortem brains from Danish males (aged 20-52 years) for whom there was documentation of premorbid IQ (mean 94, SD 14). • Asked whether IQ correlates with the number of brain cells in the human neocortex or with brain weight?
• Found no correlation between IQ and number of brain cells.
• Only a weak correlation between IQ and brain weight
Sex differences, IQ and the brain.
On average, adult male brains have 10.8% larger total brain volume than women (Ruigrok et al., 2014).
• There is, on average, a 2.1 SD (or 131ml) difference.
• However, there is also a clear absence of sex differences in IQ (e.g. Dyliert et al., 2009; Flynn, 2012, Johnson et al., 2009).
• Hence, large brains do not necessarily translate in higher IQ in humans.
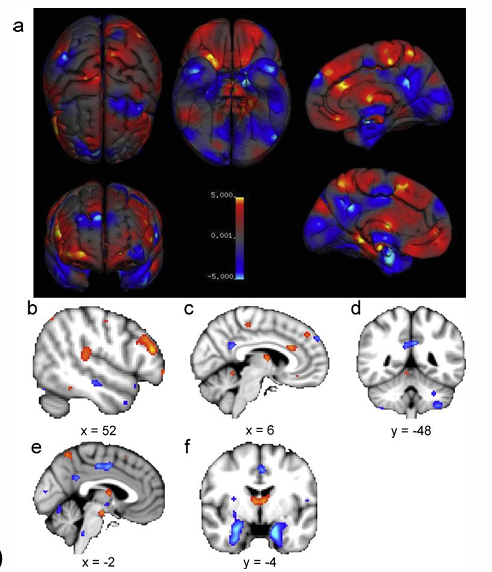
Voxel-based regional sex differences in grey matter volume
Women > Men in red and Men > Women in blue
so what do brain diffrenecs eman
• Changes in white matter as a result of learning an entirely new skill
learning juggling- whict matter changes in the skills
darwin barin evelution and cognative tasks
“No one, I presume, doubts that the large proportion which
the size of man’s brain bears to his body, compared to the
same proportion in the gorilla or orang, is closely related with
his higher mental powers”
farces galton
white higher educataed men havebiger brains
raicsum
sexsisum
and classisim
con- barin iq depbate
correlation if ral only contibuted to 2.1% of the population witch is negalable
london cabby testes
chnagesin brain structures
intensity inceraes in gary matter
geographical clustring
diffrent contries have diffrent prpoformaces in taks
reasion for diffrenecs in countrys
GDP
gender effct- gender agps, womans opertunities
Do some people just have more
efficient brains?
brain glucose activeity of teh barisn
-.77,-.67,075
highre metabolic rates
do task more effcetivly
Brain Efficiency?
(PET)Haier et al. (1992aand b)
• Haier et al. (1992a): after learning
a complex visuo-spatial task (Tetris)
> decreased cerebral metabolism
after practice
• Haier et al. (1992b): after learning
to play Tetris > more pronounced
decreased in cerebral metabolism
in higher IQ participants (measured
using Raven’s Advanced
Progressive Matrices)
Haier and Benbow
(1995):
22 male and 22 female participants
- half high SAT-Maths Scores / and
half average SAT-Maths Scores
• During the PET scan, each participant
completed a new SAT-Maths test.
• Male Participants: significant
correlations between the math score
and glucose metabolism in the
temporal lobes bilaterally (middle,
inferior, and posterior; analogous to
BAs 20, 21, 22)
more activity - but becasue of task dificulty
ryman et al 2016 - frontal priatal gray matter and white matter effciacny
white matter effeciancy preicting intelligance
• White Matter Efficiency Differences:
• In male participants: no correlation with IQ
• In female participants: positive correlation with IQ
• Grey Matter Differences:
• In male participants: a significant positive relationship between
fronto-parietal grey matter region volumes and intelligence.
• In female participants: total grey matter volume did predict
intelligence in females, but a regionally specific contribution of the
fronto-parietal grey matter volume was not evident.
Ryman et al. (2016) 54
These results suggest that:
• Efficiency of white matter organization and the total grey matter
volume was predictive of intelligence in females.
• While intelligence was related primarily to a fronto-parietal grey
matter volume in males
Finn et al. (2015) Nature Neuroscience
• fMRI obtained from 126 participants.
• 6 imaging sessions/participant (mixture of rest and complex cognitive tasks).
• Explored functional connectivity patterns (across the whole brain and within
10 key networks).
• Key = focused on individual differences (i.e. didn’t average participants
together) > computed a connectivity analysis for each person individually
for each condition.
all neral activity is atable and each indidvidual has a ‘fingerprint of there own activity
Outcomes:
• Individual connectivity patterns were stable
across all six conditions
• Connectivity patterns in the frontoparietal
network were the most distinctive
• Connectivity profiles appeared to be able
to predict levels of fluid intelligence
(measured using matrix reasoning)
hair 2009
not all brains work in the same way
Connectotyping
A connectotype describes the distinct pattern of brain activity that
characterizes the way each person’s mind works and implies that mental
processes do not necessarily enlist identical neural pathways in every
person.
• Moreover, much of the variation in connectotypes tends to occur within
the brain’s most sophisticated networks i.e. in the higher order control
regions in frontal and parietal cortices.
• Connectotypes are stable over time, have been evidenced in adults and
children, and in both humans and in non-human primates.
• Connectotypes are familial e.g. the connectotypes of family members
resemble one another more than those of strangers.
• Connectotypes appear to also be heritableable