ECG waves (P1)
1/7
There's no tags or description
Looks like no tags are added yet.
Name | Mastery | Learn | Test | Matching | Spaced | Call with Kai |
|---|
No analytics yet
Send a link to your students to track their progress
8 Terms
ECG
electrocardiogram
what is ECG
diagram shows the electrical activity of the heart over time

P wave - atrial depolarization
represents electrical activity as the atria contract
atria push blood into the ventricles
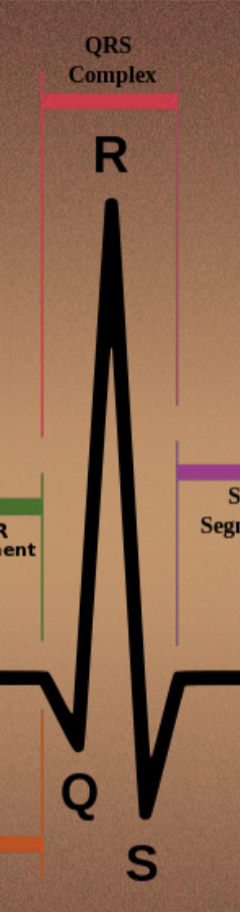
QRS complex - ventricular depolarization
represents electrical activity as the ventricles contract
strongest signal because ventricles are larger
atrial repolarization happens here but is hidden by the large signal
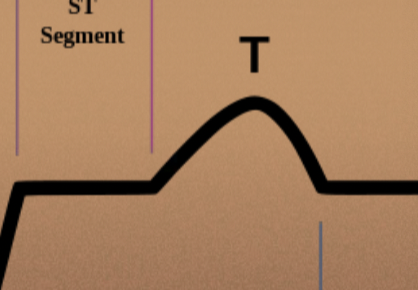
T wave - ventricular repolarization
represents ventrucles relaxing and resetting electrically
prepares the heart for the next beat
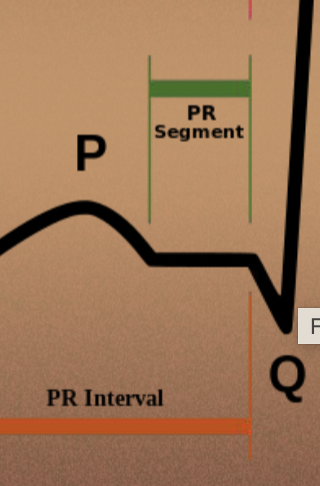
PR interval
shows time for electrical signal to travel from atria to ventricles
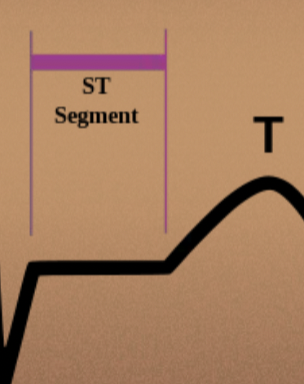
ST segment
ventricles are fully contracted
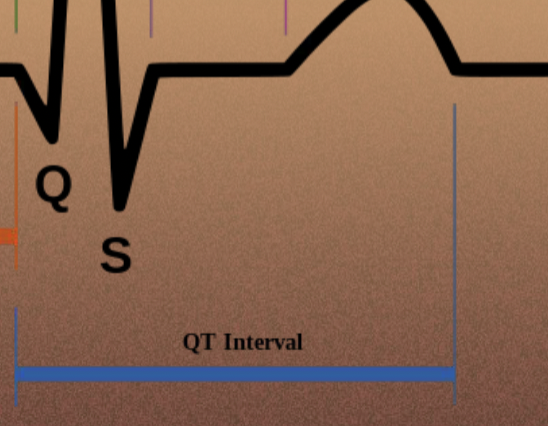
QT interval
total time ventricles take to contract and recover