corporations and financial analysis accounting
1/38
There's no tags or description
Looks like no tags are added yet.
Name | Mastery | Learn | Test | Matching | Spaced |
|---|
No study sessions yet.
39 Terms
sole proprietorship
1 owner: 1 capital, 1 drawings account
partnership
2 or more owners: each partner has a capital and drawings account
corporation
separate legal entity owned by shareholders/stockholders
characteristics of corporations
unlimited lifespan (can change owners, business doesn’t stop if an owner dies)
corp. can own property, sue others, enter into legal contracts just like people
pay separate income taxes (usually lower than most income taxes)
corporation: type of ownership
limited liability (if a business has debts, the owner can’t be personally responsible for paying them)
shareholders can only lose up to the amount theyve invested
requirements for owning a corporation
must have 50% of investments + 1 of the shares
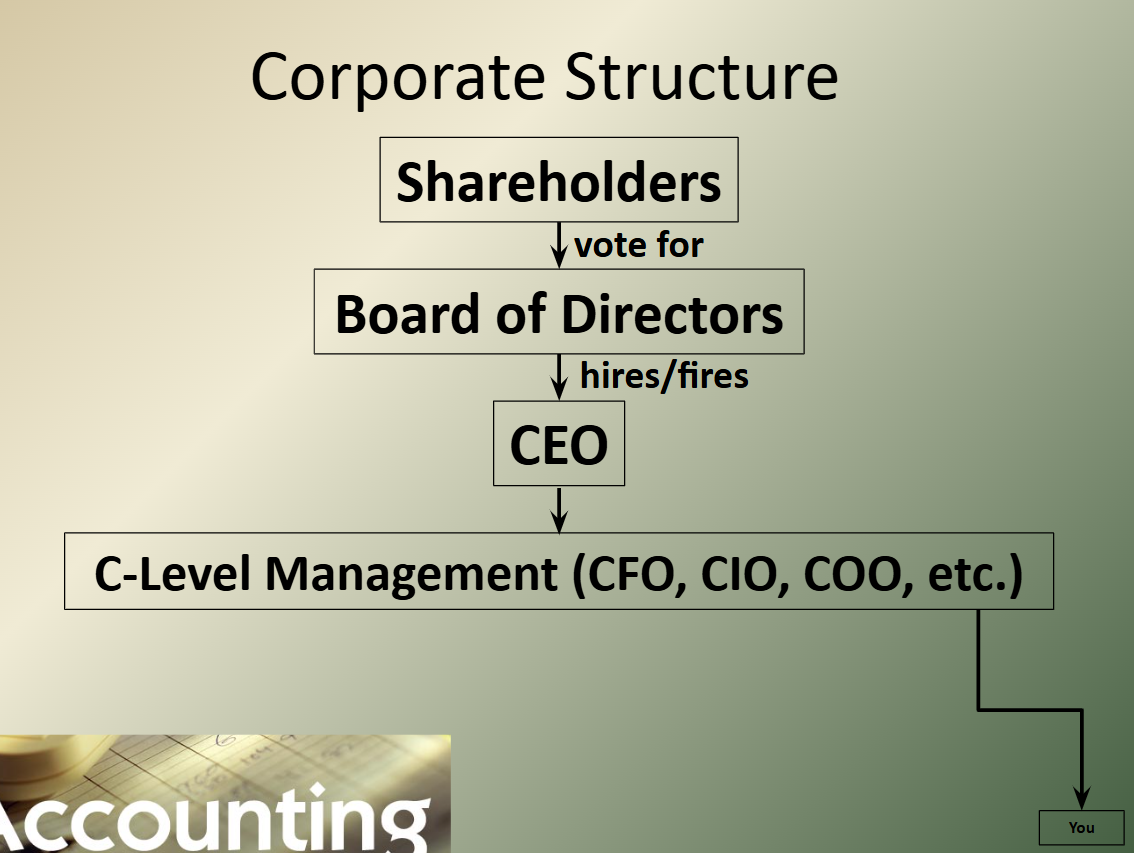
typical common shareholders’ rights
allowed one vote per share for board of directors
may receive dividends (part of company’s income)
may receive assets during liquidation (owners only get paid after liabilities)
board of directors
small group of advisors who meet 4x per year to discuss business. chairman of board is usually the CEO, the directors can be past CEOs, founders, or not related to business at all
meant to represent shareholders’ interests
corporate structure (img)
private corporation
has shares that are controlled (cant simply be bought/sold)
typically formed to take advantage of limited liability and is a small/medium business
public corporation
has shares that are freely traded on public stock exchanges
typically are public to get a large increase in cash from selling shares
only public corps are required by law to publish financial statements
limited liability
legal status in which a persons liability is limited to a fixed sum (the value of someones investment)
diff. between director and company officer/executive?
a director oversees the broader strategic direction and governance, while company officers (like a CEO or CFO) handle the day-to-day operational management
corporation equity
NO CAPITAL OR DRAWINGS ACCOUNTS!
share capital: money obtained through initial sale of stock
retained earnings: all income and losses since incorporation, minus dividends (in other words: all the earnings a company has RETAINED after paying off dividends)

selling new shares (journal entry)

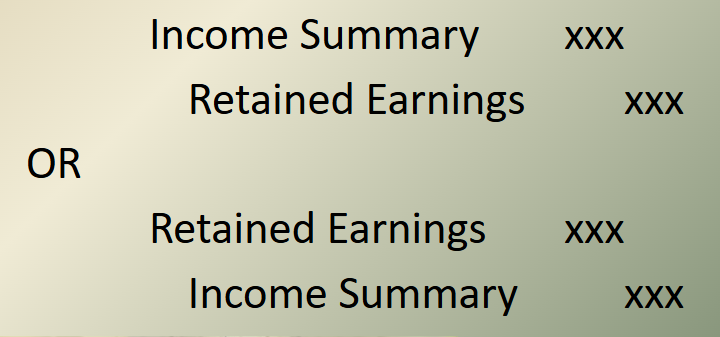
net income/loss
recorded in closing entries to income summary, then to retained earnings
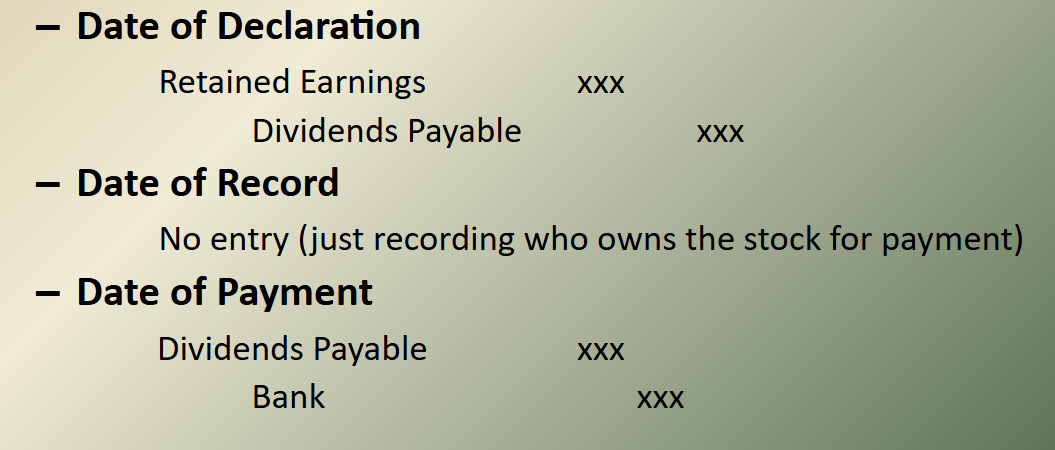
what happens when a board elects to pay dividends? (3 dates involved)
date of declaration: board “declares” (commits) to the dividend payment
date of record: company will pay dividend to whoever owns shares on this date
date of payment: company pays the dividend
journal entries for dividend payments
preferred vs common shares
may issue multiple types of common shares/preferred shares to raise additional money
preferred shares do not have voting rights, but are guaranteed a dividend before common shareholders
retained earnings formula
RE at end of year = previous RE + profit/loss - dividends
cash flow
the total amount of money being transferred into and out of a business. cash flow =/= profit
cash flow statement
shows inflows (positive) and outflows (negative) of cash (cash flow). helpful for investors to see how the company handles money/earning profit
cash flow statement sections
operating activities, investing activities, financing activities
operating activities
related to normal, daily operations (selling goods/services and paying expenses)
investing activities
related to long-term assets (buying and selling plants, land, etc) can be related to investing in other companies’ stocks and bonds as well
financing activities
related to borrowing and paying loans, or selling stocks or bonds (for corporations)
cash flow analysis
removes certain “paper” expenses or events (like depreciation)
looks at the 3 main sections to determine if the business is able to pay its bills on its own, if it’s expanding, if it has a lot of debt, etc.
operating activities: pos or neg?
should be positive (business is bringing in more cash through sales than is spending. higher number = better)
investing activities: pos or neg?
negative suggests growth (buying more assets to invest in success) but positive may be good or bad (could be selling old assets, securities)
financing activities: pos or neg?
only concerning if results suggest this is primary inflow for cash (which would mean company is relying on loans/not generating enough money on its own)
3 primary types of financial analysis
horizontal (comparative), vertical (common size), ratio
need other company’s data / industry averages to tell if company is doing well or not, especially for ratios
horizontal (comparative) + formula
allows us to see how each account has changed in the past year
Can compare growth in one line to another (i.e. Gross Profit vs Net Income before Taxes)
Used to compare company’s growth to other companies
formula: (Year 2 – Year 1) / Year 1 x 100%
vertical (common size) + formula
allows us to compare companies to each other (eg. coke to apple)
base number for balance sheet is total assets, for income statement its net sales
Shows where the company spends / invests money – critical assets/ largest expenses/etc.
Used to compare a company’s allocation of money to other companies
formula: (Line Item) / (Base Number) x 100%
ratio (in financial analysis)
gives very specific information about a company
2 primary types: liquidity (how easily company can pay debts) and profitability (how capable company is of earning profit)
Often used to compare companies to industry averages
liquidity ratios: current ratio
(Total Current Assets) / (Total Current Liabilities)
compares current assets with immediate debt (how easily can we pay debt through normal operations?)
measures company’s ability to pay off short-term liabilities
what do too low (<1) and too high (>3) liquidity ratios mean?
too low: difficulties in meeting short-term obligations (not enough assets)
too high: inefficient use of assets (like holding too much idle cash/inventory)
liquidity ratios: debt ratio
(Total Liabilities) ÷ (Total Assets) x 100%.
shows % of company’s assets that are financed by debt (how much of the business is “owed” to outsiders)
<50% preferred
liquidity ratios: equity ratio
(Total Equity) ÷ (Total Assets) x 100%
% of assets financed by owners (shareholders) rather than borrowed. >50% preferred
reflects financial independence + sustainability of the company
profitability ratio: return on net sales/net profit margin
(Net Income) ÷ (Net Sales) X 100%
tells you what % of revenue being generated that the company keeps as profit after covering all expenses
It shows how efficient and profitable a company is.
It allows comparisons across companies or time periods.
It helps investors and analysts assess cost control and pricing strategy.