Physics of living systems Lecture 1
1/15
There's no tags or description
Looks like no tags are added yet.
Name | Mastery | Learn | Test | Matching | Spaced |
|---|
No study sessions yet.
16 Terms
Null hypothesis
1 - Explanation against your anticipated cause and effect based on the action of chance alone
2 - Statement in statistics that assumes there is no real effect or relationship between variables and any observed effect is due to random chance
Standard error
It is the standard deviation of means
Protocol of investigation statistics
Propose a hypothesis
Undertake experiments and acknowledge assumptions
Analyse results
Statistics; Was cause and effect apparent, or could the results be explained by a probabilistic argument (null hypothesis)
Power of the test - small nos vs large nos
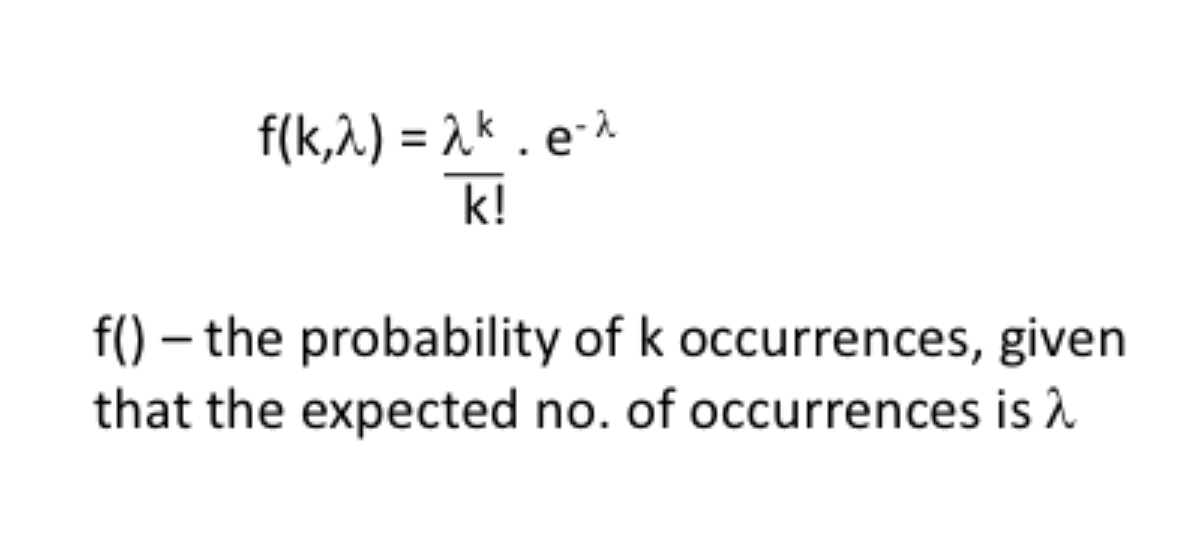
Poissons distribution
Discrete so whole numbered value no upper bound but as number gets bigger probability gets really small; our lambda in this case is our mean mew; our sigma squared our our variance is also equal to lambda so ie variance is equal to the mean. Poisson estimate of SD = SQRT mean
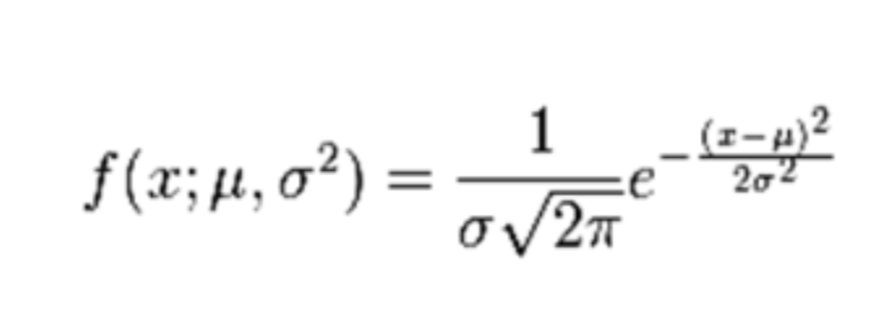
Gaussian Distribution
Continuous and goes to infinity; area under the curve is 1
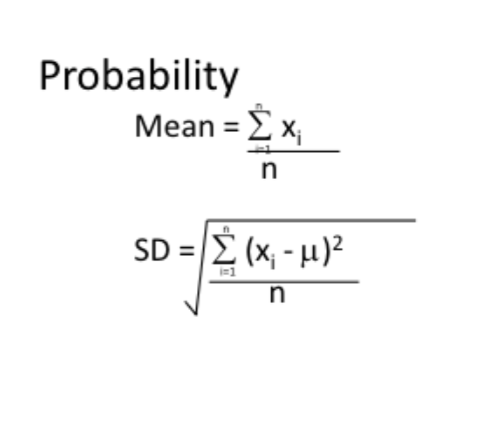
Mean and standard deviation formulas
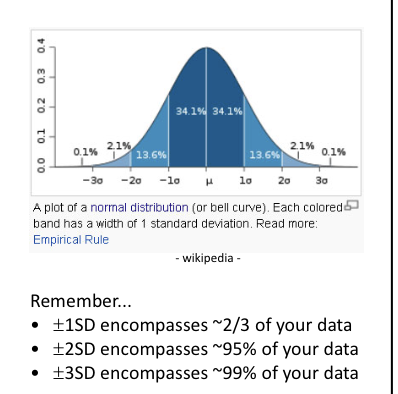
SD data encompassation, median mode
Median - 50th percentile; Mode - most common
Cnetral limit theorem
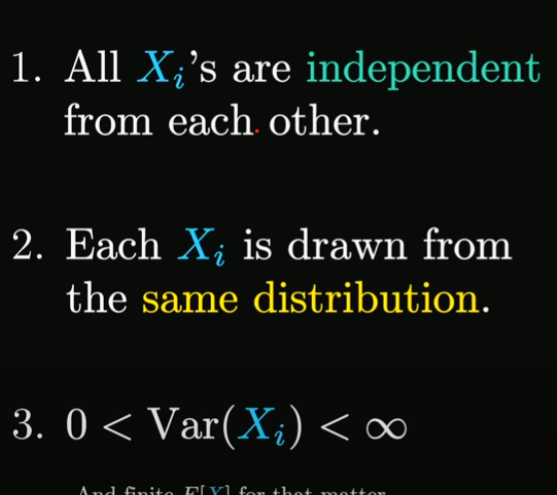
If you take a large number of random samples from any population (regardless of the original distribution), the average (mean) of those samples will tend to follow a normal distribution, as long as the sample size is large enough
Standard error mean (SEM)
Standard Deviation / sqrt n
Popoulation vs Sample
Population refers to the entire gorupp we are interested in studying - for example, all adult females in the UK
It has a true but unknown population mean and population standard deviation
Sample is a subset drawn from the population, sucha s 50 adult females meaased in a biiomechanics experiment
Sample mean and sample sd
Variability and error
natural variability
Humans duffer inherently due to genetics, physiology, biomechanics etc
No 2 measurements will be exactly the same even in ideal conditions
Experimeental error (noise)
Instrumentation: calibration errors, imprecision in sensors
Operator bias: inconssistent technique or measurement skill
Reporting errors: Misrecording data or appling incorrect units
Significance Testing and p-values
The p-value quantifies the probability of obtaining the observed data (or more extreme) if the null hypothesis (H₀) is true.
In biomechanics, we often ask:
"Are the observed differences between two groups (e.g., males vs females, treatment vs control) likely to have occurred by chance?"
Null Hypothesis (H₀)
Assumes no difference between groups.
We seek to find evidence against H₀.
Arbitrary Threshold:
Conventionally, if p < 0.05, we reject H₀ and call the result statistically significant.
A p-value < 0.05 means that the observed difference is unlikely (less than 5% probability) to have arisen by chance alone.
Poissons distribution definition
Discrete distribution that can be used to calculate the probability of a given number of independent events occurring in a fixed time interval or defined space
Assumptions that follow the Central Limit Theorem
Standard Deviation
defined as the root of the mean of the sums of the squares of the
deviations