1.4 Government Intervention
1/42
There's no tags or description
Looks like no tags are added yet.
Name | Mastery | Learn | Test | Matching | Spaced | Call with Kai |
|---|
No analytics yet
Send a link to your students to track their progress
43 Terms
Indirect taxes
A mandatory levy on the production or sale of a good/service which addresses overproduction/consumption (partial market failure)
Indirect tax - specific tax
The same tax rate is charged regardless of output or price
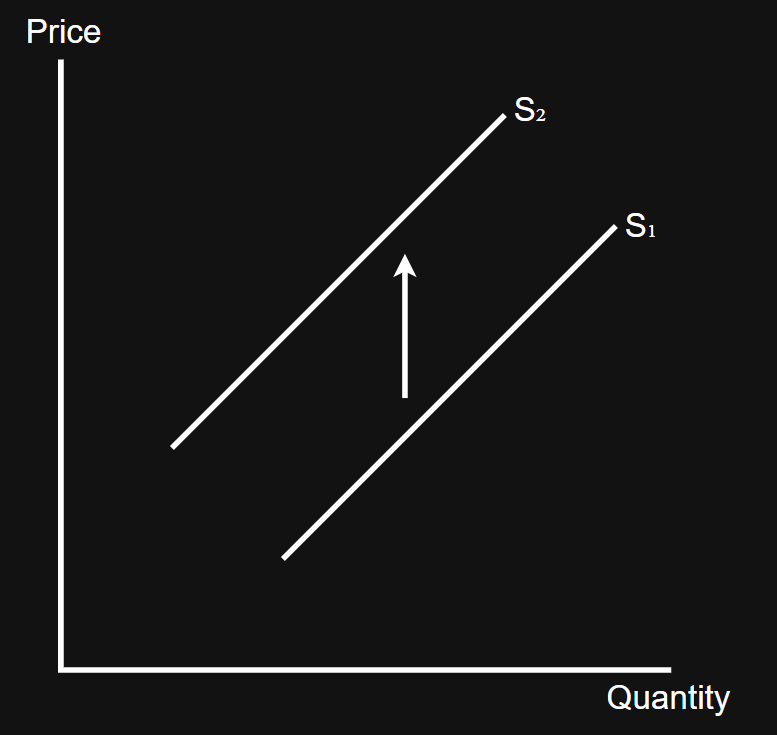
Represented by a leftward shift in supply
E.g. alcohol and smoking tax
Indirect tax - ad valorem tax
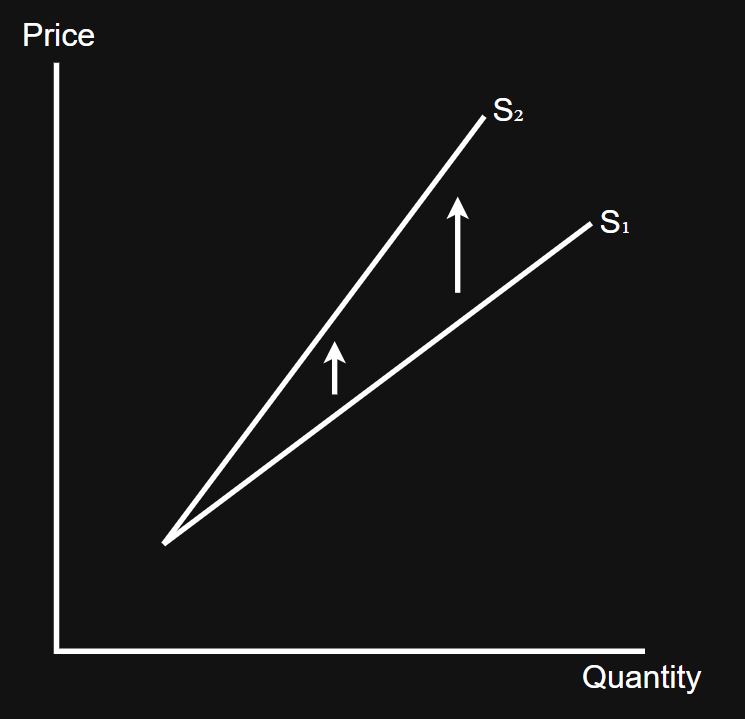
The tax amount increases as the price of the good/service increases
E.g. VAT or property tax
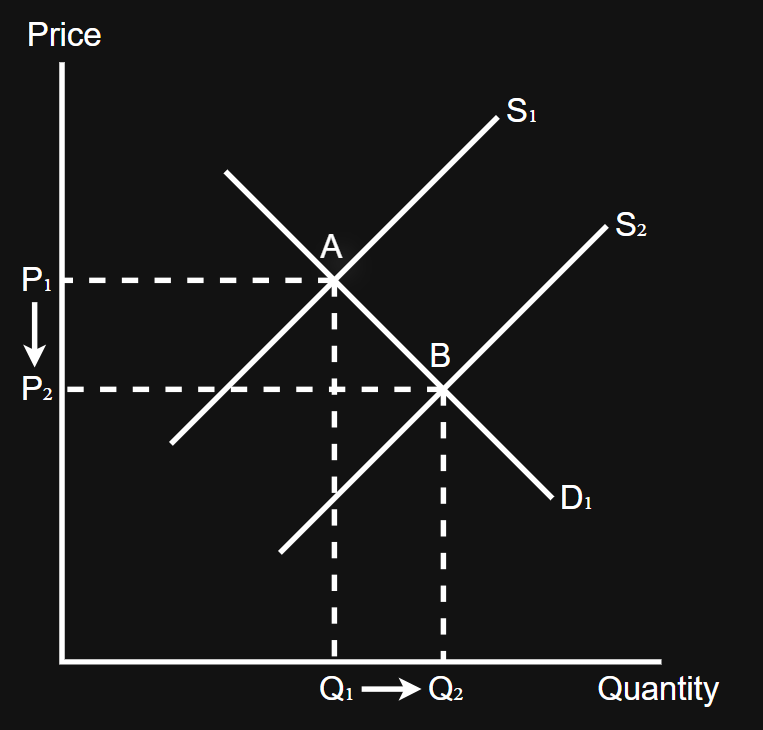
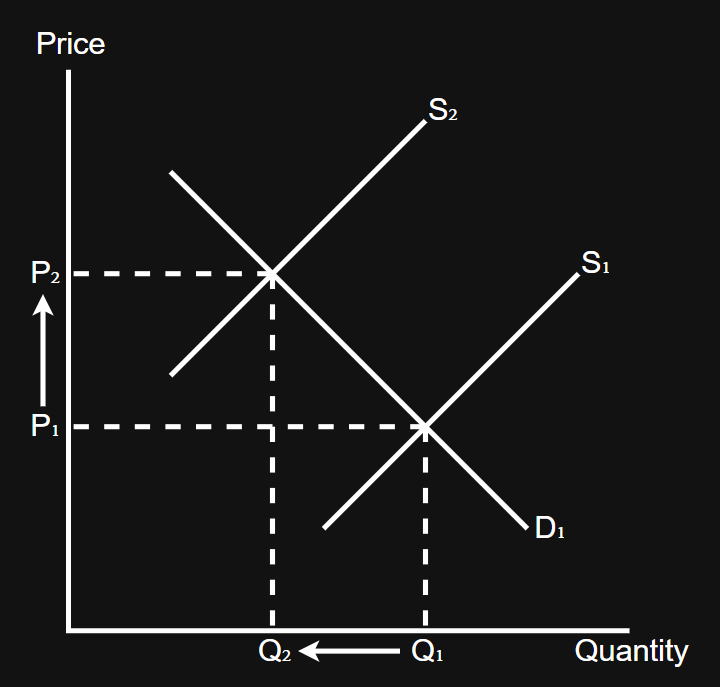
Indirect taxes in relation to overproduction/consumption
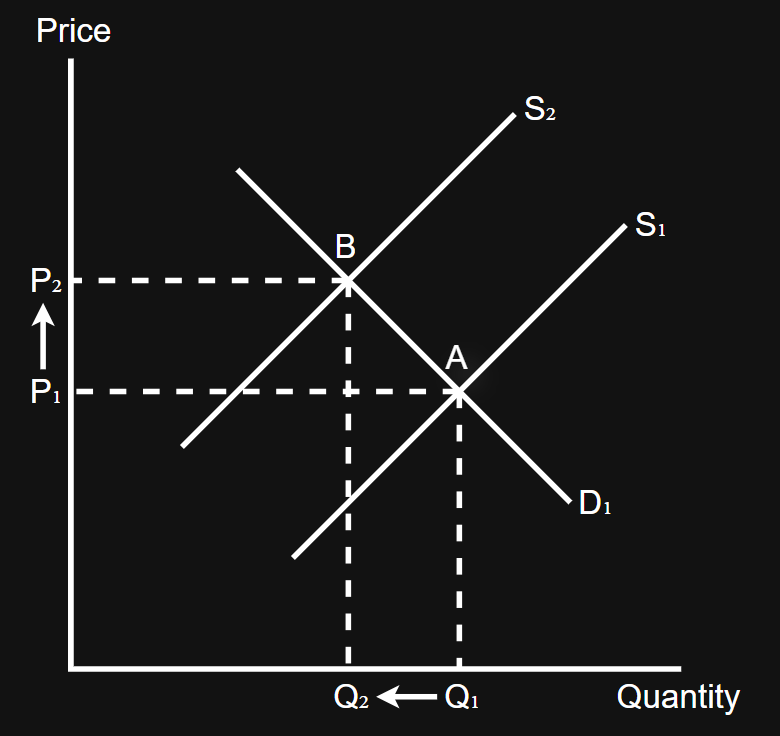
An increase in indirect taxes increases the cost of production for firms, resulting in supply decreasing and equilibrium price increasing from P₁ to P₂; this causes demand to contract from A to B, and hence less people are consuming the demerit good, correcting the partial market failure
Complex explanation of indirect taxes in relation to overproduction/consumption
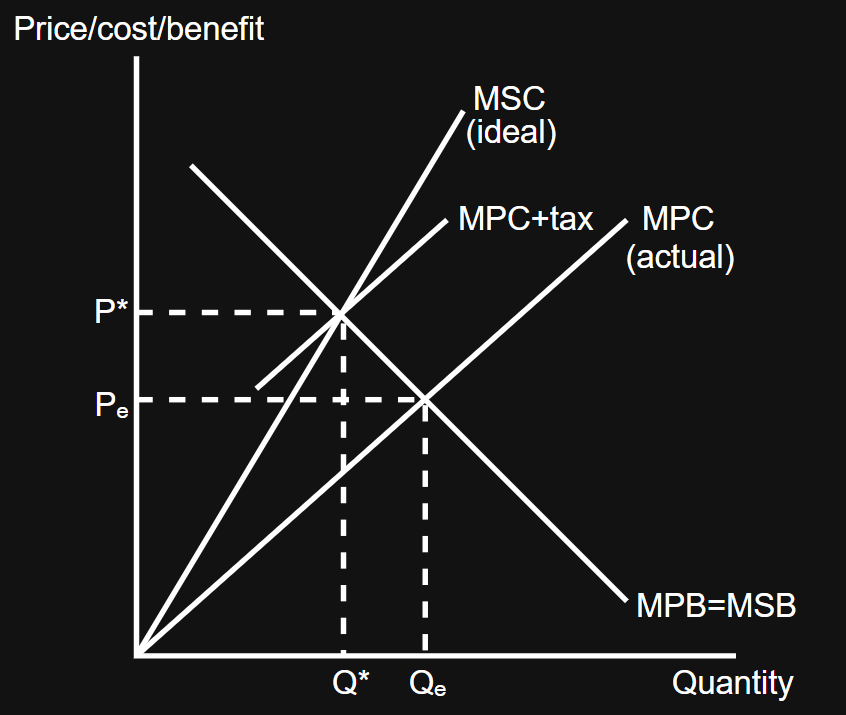
An increase in indirect taxes increases the cost of production for firms, resulting in supply decreasing and equilibrium price increasing from P₁ to P₂; this causes demand to contract from A to B, thus the market moves to the social welfare optimum (point P* and Q*) and therefore the welfare loss triangle is removed meaning less people are consuming the demerit good, correcting the partial market failure
This allows the government to manipulate the supply and demand of the good and therefore manipulate the price and output
Indirect taxes internalising externalities
As the external costs fall outside the market (as it effects third parties), producers/consumers ignore the marginal external cost as they are not paying for the social cost of the product
Advantages of indirect taxes
Removes/reduces the welfare loss
Taxes generate revenue which can be hypothecated (taxing the problem and using its revenue to fix the problem)
More tax revenue is generated when PeD<1 (inelastic demand)
Disadvantages of indirect taxes
Difficult to judge the correct level to set the tax, as it is difficult to judge the size/extent of market failure, thus it may lead to underconsumption if you tax too much
Taxes reduce standard of living, consumer surplus and real disposable income
Indirect taxes are regressive, therefore they take a higher % of income from lower income consumers
Taxes may be ineffective if PeD<1 (inelastic) as consumers will not respond to an increase in price
If PeD<1, the producers will pass most of the tax onto consumers
Subsidies
Grants given to producers by the government which addresses overproduction/consumption
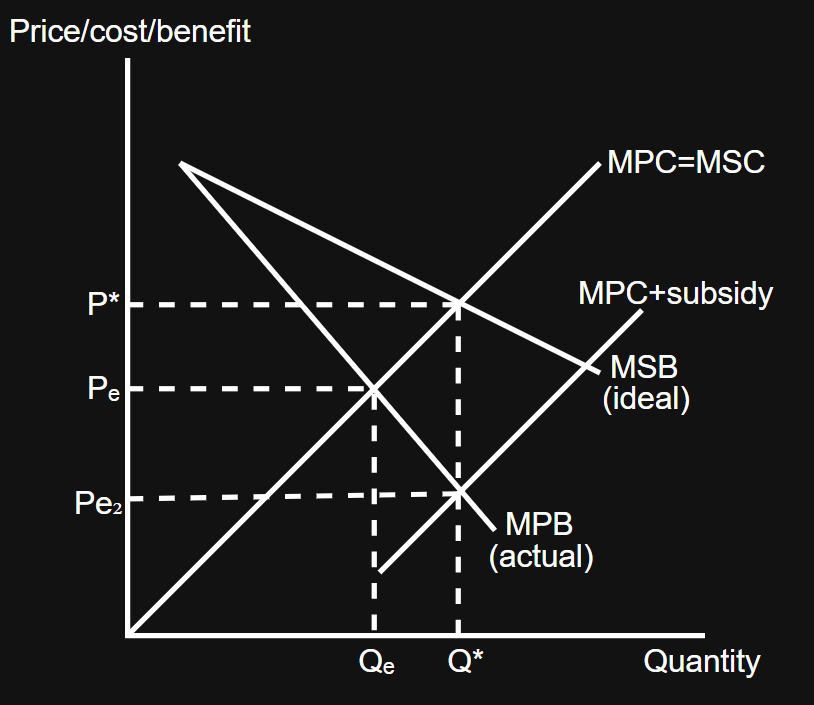
Subsidies in relation to underproduction/consumption
The government granting a subsidy would decrease the cost of production for firms, resulting in supply increasing and equilibrium price decreasing from P₁ to P₂; this causes demand to extend from A to B, and hence more people are consuming the merit good, correcting the partial market failure
Complex diagram of subsidies in relation to underproduction/consumption
The government granting a subsidy would decrease the cost of production for firms, resulting in supply increasing and equilibrium price decreasing from P₁ to P₂; this causes demand to extend from A to B, thus the market moves to the social welfare optimum (point P* and Q*) and therefore the welfare loss triangle is removed meaning more people are consuming the merit good, correcting the partial market failure
Subsidies internalising externalities
Producers/consumers ignore the marginal external benefits of their actions as they do not receive these benefits, however subsidies increase the benefit of production/consumption for sellers/buyers; as the external benefit is now given to producers and consumers, they will increase output and demand in line with the overall social benefit
Advantages of subsidies
Removes/reduces the welfare loss
Increases the standard of living, consumer surplus and real disposable income by lowering prices, which also helps lower income groups
Increases producer surplus and profits for firms, which they can use to reinvest, innovate and engage in research and development which could improve product quality or technology over time
Disadvantages of subsidies
Subsidies will not be effective at increasing consumption if PeD<1 (inelastic), as consumers will not respond to lower prices with a significant increase in demand, thus the subsidy fails to address the underconsumption of the merit good
Subsidies have a large opportunity cost as to fund subsidies, money must be sacrificed from the NHS or education spending
The UK’s current national debt is approximately 2.9 trillion (96.4% of GDP), thus it is hard to afford a large subsidy programme
Subsidies can encourage inefficiency as firms are over-reliant on subsidies and thus, their incentive to innovate and compete would decrease, therefore they are solely relying on the subsidy to survive
Minimum prices
A legal price below which a good cannot be sold (price floor); typically used to discourage consumption of demerit goods or to make goods more expensive (protecting producers)
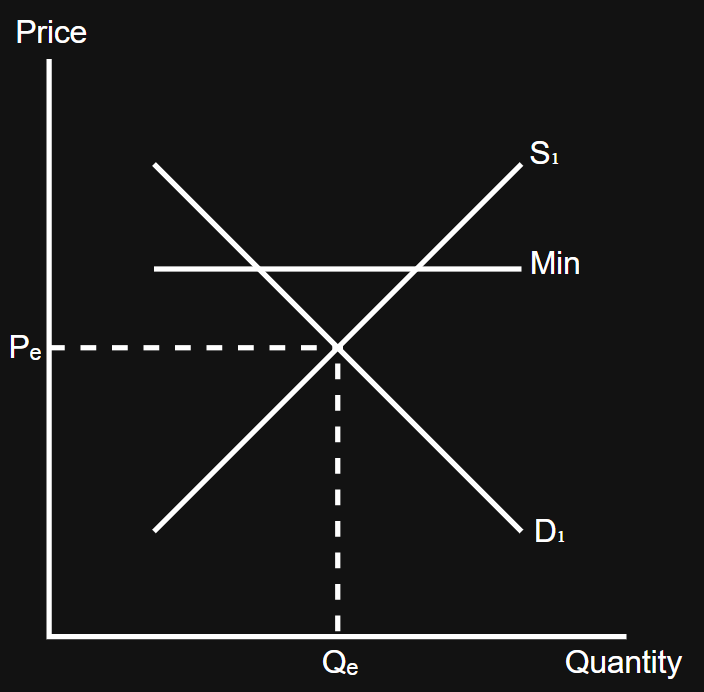
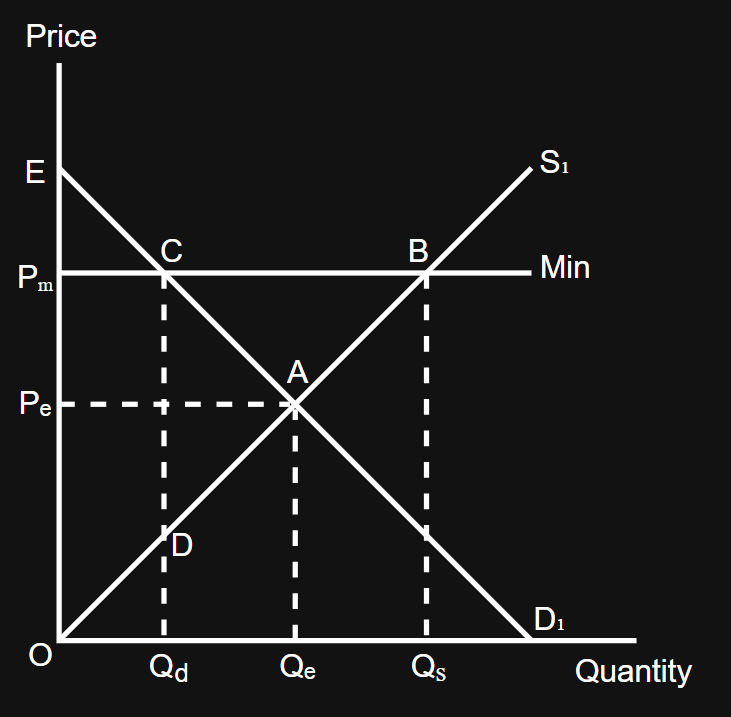
Minimum price diagram in relation to excess supply
Original consumer surplus = AEPₑ
New consumer surplus = CEPₘ
Original producer surplus = OAPₑ
New producer surplus = ODCPₘ
Area ‘X’ = the producer surplus gained
Area ‘Y’ = the producer surplus lost
Area ‘X’ > area ‘Y’, therefore, minimum prices increase producer surplus, thus it is beneficial for producers
Total revenue after the increase in price = (Qd x Pₘ) or area ODCPₘ

Explanation of the minimum price diagram in relation to excess supply
When a minimum price is set, prices increase (Pₑ to Pₘ) causing supply to extend (A to B) as producers are incentivised by the higher prices; however as prices increase, demand contracts (A to C) as some consumers are unwilling to pay at the higher price, this in turn creates excess supply, however producers cannot correct this due to the price floor
As a result, living standards and real disposable income decreases, taking a higher % of income from poorer consumers as minimum prices are regressive
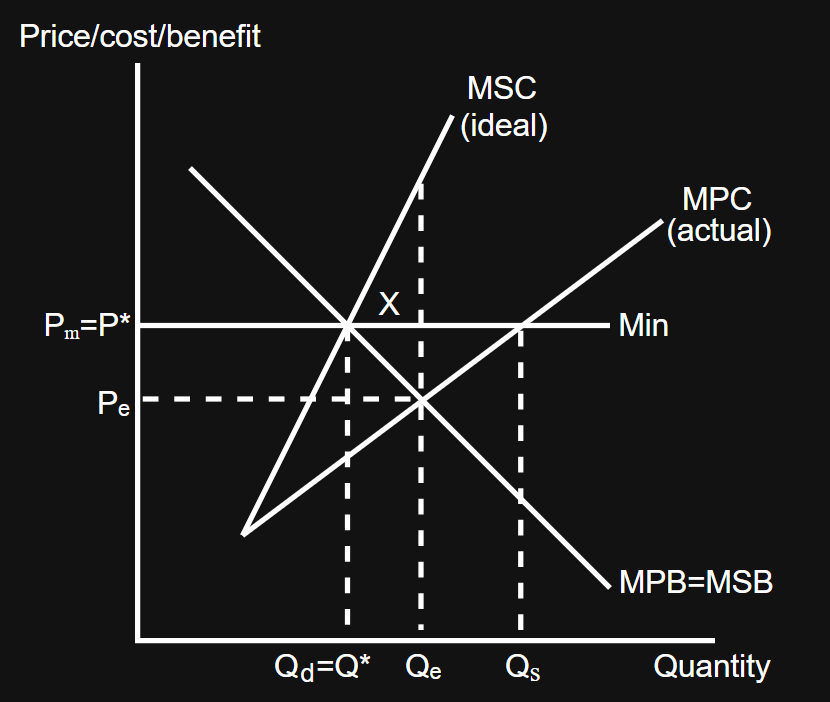
Minimum price diagram in relation to correcting overproduction/consumption
Area ‘X’ = welfare loss
Setting the minimum price at the social optimum (P* or Pₘ) will contract demand to Q* or Qd, eliminating/reducing the welfare loss triangle
Evaluation of minimum prices
It is very difficult to set minimum prices correctly (markets are unlikely to reach a ‘true’ equilibrium and have constantly changing prices due to shifts in supply and demand)
If the minimum prices end up below the equilibrium, it has no effect
The magnitude of the contraction of demand is dependent on the PeD of the good/service, if PeD is <1, there would be a small decrease in quantity demanded; the magnitude of the extension of supply is dependent on the PeS of the good/service, if PeS is <1, there would be a small increase in quantity supplied; therefore the magnitude of excess supply (Qs - Qd) is dependent on both the PeD and PeS, if both are inelastic there would be little excess supply, if both are elastic there would be large excess supply
Guaranteed minimum prices
A legal price below which a good cannot be sold (price floor), whereby the government will buy up any excess supply
Guaranteed minimum prices diagram
No change in consumer surplus compared to a regular minimum price diagram
Original producer surplus = OAPₑ
New producer surplus = OBPₘ
Area ‘OBPₘ’ > area ‘OAPₑ’, which is much better for producers
(Qs - Qd) x Pₘ or area ‘BCQdQs’ represents the total government spending on buying the excess supply
Evaluation of guaranteed minimum prices
The government may have to pay for storage/disposal costs for the surplus purchased
The amount the government spends on purchasing the excess supply is dependent on the PeD and PeS of the good; if both are elastic, then the government would have to spend a lot, if both are inelastic, then the government would have to spend a little
Maximum prices
A legal price above which a good cannot be sold (price ceiling); typically used to encourage consumption of merit goods or to make necessities more affordable (protect consumers)
Maximum price diagram in relation to excess demand
Original consumer surplus = AEPₑ
New consumer surplus = BDEPₘ
Original producer surplus = OAPₑ
New producer surplus = OBPₘ
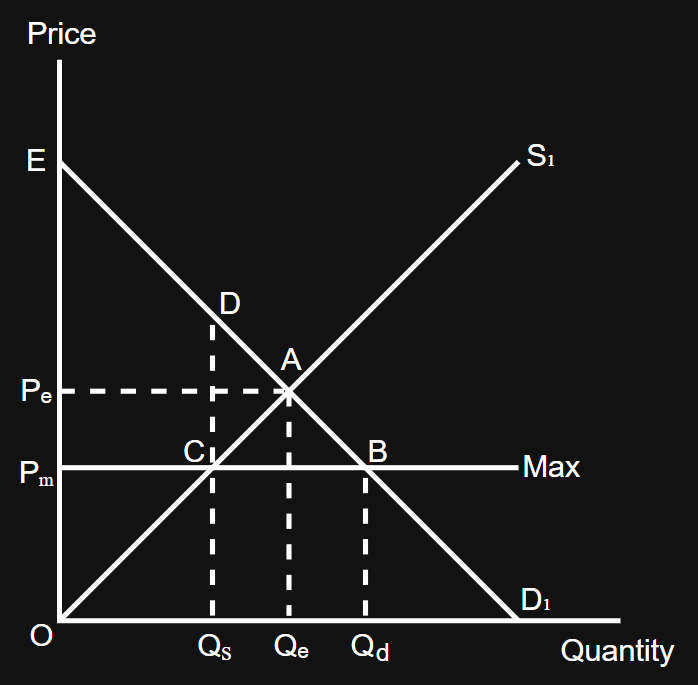
Explanation of the maximum price diagram in relation to excess demand
When a maximum price is set, prices decrease (Pₑ to Pₘ) causing supply to contract (A to B); however as prices decrease, demand extends (A to C) as consumers are incentivised to purchase at a lower price, this in turn creates excess demand, however consumers cannot correct this due to the price floor
As a result, living standards and real disposable income increases, saving a higher % of income from poorer consumers
Evaluation of maximum prices
It is very difficult to set maximum prices correctly (markets are unlikely to reach a ‘true’ equilibrium and have constantly changing prices due to shifts in supply and demand)
If the maximum prices end up above the equilibrium, it has no effect
The magnitude of the extension of demand is dependent on the PeD of the good/service, if PeD is <1, there would be a small increase in quantity demanded; the magnitude of the contraction of supply is dependent on the PeS of the good/service, if PeS is <1, there would be a small decrease in quantity supplied; therefore the magnitude of excess demand (Qd - Qs) is dependent on both the PeD and PeS, if both are inelastic there would be little excess demand, if both are elastic there would be large excess demand
Maximum prices are also self-defeating, as whilst the intention is to lower prices and allow more consumers to afford the good, by discouraging suppliers and contracting supply, the policy will actually reduce access and create shortages, meaning fortunate consumers who can acquire the limited supply will benefit from the lower prices, whereas other consumers lose out from lack of supply, therefore overall consumption will be lower, and thus maximum prices does not fully increase consumption of merit goods
Provision of public goods
Avoids the free-rider problem; corrects the ‘missing market’ as the good will now be provided
(only applies to correcting the problem of correcting public goods)
Evaluation of provision of public goods
The good being provided may be a quasi-public good, therefore the provision may not be necessary, as the firm may instead produce them, as profit can be made
High costs and national debts (£2.9 trillion), make it hard for the government to provide them; they may have to raise taxes to fund the provision of public goods
Technology can turn a public good into a private good over time (e.g. the music industry)
Provision of information
Avoids information gaps; prevents under/overconsumption/production due to a lack of info
(e.g. the government would give consumers perfect information, hence demand shifts to the ideal level of price and quantity, with the welfare loss triangle (area ‘ABC’) being removed/reduced)
(only applies to the problem of correcting information failure)

Evaluation of provision of information
Consumers may be irrational and fail to respond to the information (due to the three reasons of irrationality)
If consumers/producers engage in screening/signalling behaviour, they may address the information gaps themselves, so government intervention is unnecessary
The government may not have perfect information themselves, in which case, the provision of information is unlikely to be effective
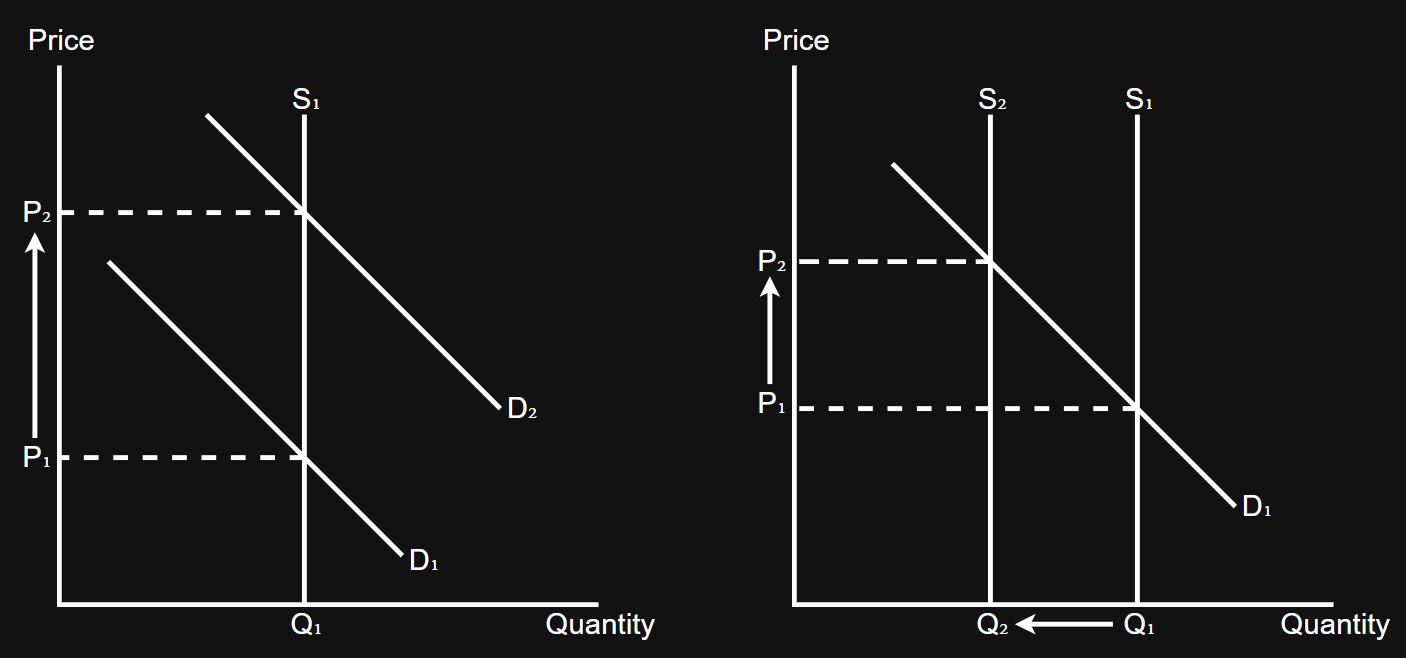
Pollution permits
The government initially sets an overall target for emissions/pollution (e.g. 1000 tonnes of carbon dioxide per year)
The government then creates legal permits (i.e. the right to pollute) and distributes these to firms, up to the target limit
Firms may then buy and sell these permits between themselves in an internal market
Firms that have exceeded their set permit amount will have to buy extra permits from others, incurring extra costs, and hence reducing profit
Firms that have polluted under their set permit amount are able to sell their extra permits to others, increasing revenue and hence increasing profit
This provides rewards to producers who are environmentally friendly, whilst simultaneously punishing producers who over-pollute
(only used to address a specific negative externality, pollution)
Advanced analysis of pollution permits
If pollution increases, demand for permits increases, and therefore the price of permits increase
This means if the MEC (pollution) is very large, firms will have a higher extra cost for spare permits; if the MEC (pollution) is very small, firms will have a smaller extra cost for permits, as they are cheaper
This means the externality is internalised, and this internalisation is automatically adjusted; this is unlike taxes and subsidies, which need to be manually adjusted if they were implemented instead
Additionally, the government can reduce the number of permits they give out each year, which would gradually increase the prices of permits as supply shifts, incentivising firms to be more environmentally friendly
Evaluation of pollution permits
The government may set the incorrect level of permits; too few, and the prices may be so high that they bankrupt firms; too many permits would not successfully reduce pollution
It may be very difficult to measure industrial firms’ pollution levels and also monitor the policy successfully
As pollution is a global issue, it is very difficult to solve with national permit policies, therefore firms can simply move to countries where permits are not required (e.g. China), meaning pollution is not reduced on the global level, and the country implementing the permits loses out on jobs and tax revenue the firms would have generated
Regulations
A government law that prohibits or makes mandatory a specific economic action, without directly changing costs or prices
(e.g. bans on smoking for under 18’s, quality controls, testing requirements, health and safety)
(taxes and subsidies are not regulations)
Regulations - fines
Fines are a monetary penalty used to impose an extra cost on firms for undesirable economic activity, as firms increase the cost of undesirable activity, then, assuming ceteris paribus, the costs will be relatively higher in comparison to the benefits, this decreases the incentive for firms to engage in the undesirable action
(same concept can be used for consumers)
Regulations - costs
Regulations typically increase the cost of production, therefore, regulations shift supply to the left
Firms may have to alter their production process in order to meet the regulations, which may require additional costs
Firms may face compliance costs (i.e. cost of compliance staff or advisory services, LSEG)
Evaluation for regulations
Fines may be too small (no/little effect), large (too much extra cost for firms, may bankrupt them) or weakly enforced if the probability of getting caught and fined is low (firms may risk engaging in the regulation activity as they think they can avoid the additional cost)
Fines and regulations may result in firms moving abroad to less heavily regulated countries; developing countries often compete to attract investment by weakening regulations
Regulations can be very difficult to monitor and enforce (depending on the regulation); e.g. underage drinking, smoking and fly tipping can be done at night
Government failure
When government intervention either fails to improve welfare or even results in greater welfare loss
Types of government failure
Unnecessary admin costs
Imperfect information
Unintended consequences
Distortion of price signals
Unnecessary admin costs
Private sector costs tend to be too high because:
a) governments have no profit motive, so there is little incentive to keep costs low, as without profit, there is no reward for doing so
b) all policies require monitoring and enforcement costs; monitoring is when the government pays for inspectors and checks on firms to ensure they are upholding the policies; enforcement is legal costs (e.g. when prosecuting cases against regulation breachers)
If the costs of monitoring, enforcement or admin outweigh the benefits of the intervention, government failure occurs
Imperfect information
When the government may lack perfect information on the costs and benefits of the economic activity it intervenes in, leading to no improvement in welfare or welfare loss
(e.g. the government does not know the exact MEC or MEB when correcting externalities; they do not know the exact equilibrium to set prices at for minimum and maximum prices; they do not have perfect information when providing consumers with information)
Unintended consequences
The law of unintended consequences states that the economic system is so complex that any intervention is guaranteed to have unintended and unpredictable consequences
(e.g. when the US government banned alcohol, producers started making it illegally, leading to increased ethanol content and increased volume of alcohol-related deaths; US prohibition)
Distortion of price signals
If the government distort the equilibrium price, it prevents the correct signals, incentives and rationing from taking place, leading to a misallocation of resources; if the government distorts price signals, the number of successful transactions would decrease compared to the number of successful transactions at equilibrium
The excess demand (Qd - Qs) and the excess supply (Qs - Qd) mean there are not enough sellers or enough buyers in the market, respectively, causing welfare loss (area ‘ABC’)
