SOC252 Week8-Week10
1/23
There's no tags or description
Looks like no tags are added yet.
Name | Mastery | Learn | Test | Matching | Spaced | Call with Kai |
|---|
No analytics yet
Send a link to your students to track their progress
24 Terms
Untestable general assumptions of regression
无法确认是否成立的假设
A1: All relevant independent variables are included in the regression model (i.e., no omitted variable bias)
无法确定是否还有模型之外的影响变量
A2: All non-relevant independent variables are excluded from the regression model (i.e., no non-
relevant controls)
无法确定放入的变量相关与否
Testable general assumptions of regression
The independent variables have additive effects on dependent variable
Linearity
No perfect (or high) multicollinearity
No influential outliers
Additive effects
存在多个自变量(如x1,x2)时,这两个自变量不会互相影响对方对因变量Y的作用方式,对因变量Y的影响结果是多个自变量效应的相加。Y = b0 + b1*x1 + b2*x2
反面例子:Y是“人们对工作的满意度”,x1是“从事面对客户的工作”,x2是“是否内向”。内向者从事对客户的工作会导致对工作满意度的降低,则x1的系数(对Y的影响程度)取决于x2,违反了additive effects
If we have a clear reason to hypothesize that non-additive effects exist in our regression model, 加入interaction terms,𝑦 = 𝑏0 + 𝑏1*𝑥1 + 𝑏2*𝑥2 + 𝑏3 *𝑥1 * 𝑥2
In Ststa: reg y x1 x2 c.x1#i.x2
#是交互项,c.表示continuous,i.表示categorical
Careful! Adding interaction terms to a model changes the interpretation for some coefficients.
Interactive effects Interpretation
和additive effects相反的
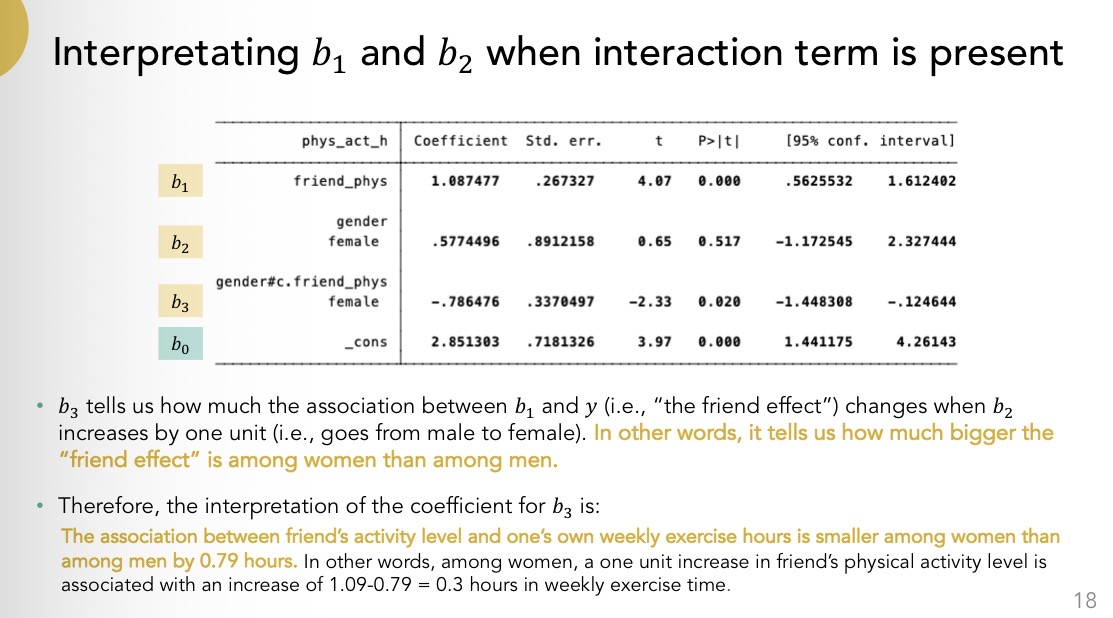
E.g. How does friends’ physical exercise level (from 0 to 4, 0 being very inactive and 4 being very active) affect individuals’ own weekly hours of exercise? We suspect that gender (0=male, 1=female) is a confounder
b3解释见图
b1和b2的解释:先按照没有交互项时的习惯解释,如果有,加一句“among those who have a zero for the other variable in the interaction……”
Moderate
如果x1对y的影响,会随着x2的不同而改变,那么x2就在moderates x1对y的影响。gender moderates the effect of friends’ activity level on exercise hours
如果交互项系数不显著,我们就没有足够证据说 x_2 是 moderator。
测moderation的原因
担心additive effects assumption被违反
了解某个自变量x对因变量y的效应是不是在不同群体中不一样
Linearity
Regression will take for granted that independent variables are linearly related to dependent var
Assumption is violated if the relationship is instead clustered or curved
applies to categorical variables, too, but is automatically satisfied
quadratic term
For y, x1, x2, we suspect that has a non-linear relationship with y
𝑦 = 𝑏0 + 𝑏1 * 𝑥1 + 𝑏2 * 𝑥2 + 𝑏3 * 𝑥2 * 𝑥2
Stata: reg y x1 c.x2##c.x2
Interpretation of non-linearity regression (quadratic)
E.g. How does football players’ age affect their
earnings? (Curved)
According to scatter plot, players get older between age 18 and 30, they seem to earn more; after 30, they seem to earn less the older they are
Earning = b0+b1*age + b2*age²
If b1 > 0, b2 < 0, it is in a reverse U-shape
If b1 < 0, b2 > 0, it is a U - shape
If b1*b2 > 0, 不是典型弯曲
无法直接解释系数,年龄对收入的影响不是固定的,而是随着年龄本身变化,最好可视化一下
Should I just always add quadratic terms?
No; the most typical case where you should add a quadratic term is when you are dealing with age or time.
Adding unnecessary quadratic terms make your model more complex than it needs to be. It also 让系数没法简单地解释大小
(Only add quadratic term if you have a suspicion that the relationship between an independent variable and the dependent variable is curved. If you are unsure, look at a scatterplot)
Dummies
Another way to address non-linearity
dummy 方法就是把连续变量切成几段,变成分类变量。原来平滑的曲线关系,被改写成不同区间之间的均值差异比较 (categorical variable 做一个 linear regression),回归也就能按分类变量的方式正常解释
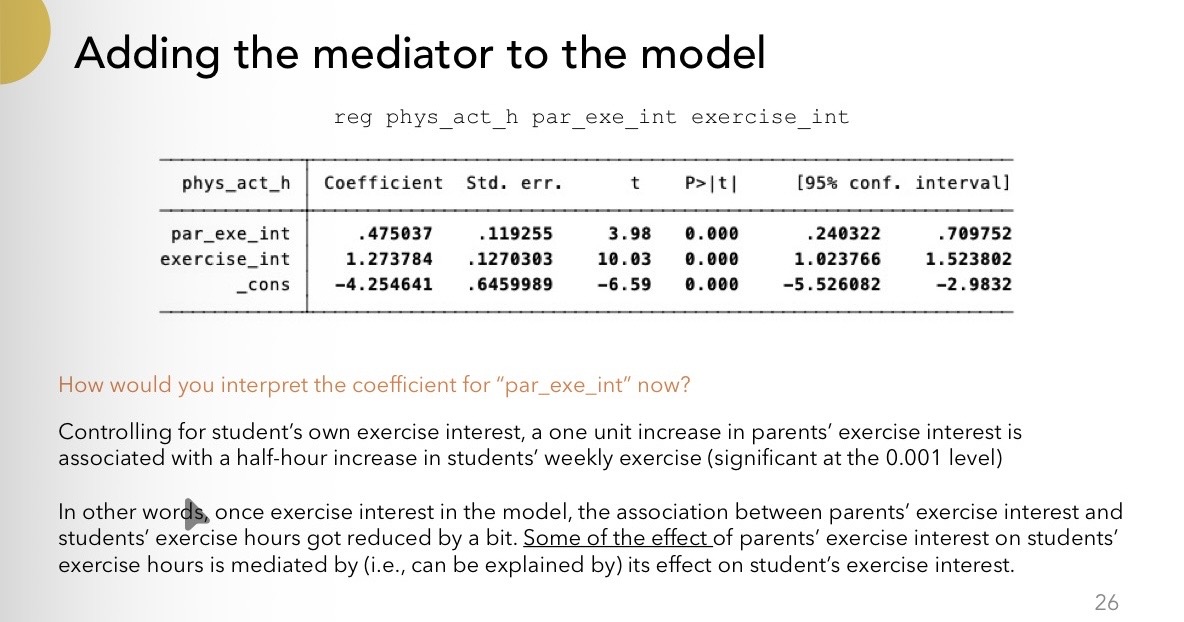
Mediation
什么因素解释了x对y的影响,细致地拆分总效应中,每个中介效应起到了多少作用
例子:父母是否喜欢运动 (X) → 孩子运动时长 (Y)
mediation解释,父母对运动感兴趣为什么会让学生运动更多
一些在中间起作用的变量,比如“父母锻炼带动孩子”,“家里鼓励”等等,就是mediator:X → Mediator → Y
mediator 通常只是众多可能中介路径中的一个,X到Y之间可能存在
direct effect (去掉包含在regression里的mediator,direct + indirect为total)
mediator path 1
mediator path 2
……
对比moderation:moderation分类一个x在不同条件下对y的影响效应不同,mediator研究什么在x对y的影响中间起到传导作用
,
interpretation of mediator
𝑃𝑟𝑜𝑝𝑜𝑟𝑡𝑖𝑜𝑛 𝑚𝑒𝑑𝑖𝑎𝑡𝑒𝑑 =
(𝑇𝑜𝑡𝑎𝑙 𝑒𝑓𝑓𝑒𝑐𝑡 − 𝑑𝑖𝑟𝑒𝑐𝑡 𝑒𝑓𝑓𝑒𝑐𝑡) / 𝑇𝑜𝑡𝑎𝑙 𝑒𝑓𝑓𝑒𝑐𝑡
No perfect (or high) multicollinearity
Perfect multicollinearity:模型里的某个自变量,可以被另一个自变量或其他几个自变量用线性关系完全表示出来(相关系数是1或-1),比如
年龄 = 2024 - 出生年份
年龄和出生年份完全线性相关
一天的总时间 = 睡觉 + 工作 + 其他
这三个变量之间存在完全线性关系,在回归里,这三个不能同时全放进去,
High multicollinearity: 自变量相关系数绝对值很接近1 (一般大于0.8),容易造成结果不稳定和误差增大,比如
x1: 英语成绩, x2: 总成绩
总成绩里往往包含英语成绩,而且和英语成绩高度相关
We should not have things that share a ver high correlation with each other
如果出现perfect multicollinearity,会怎么样
回归没法同时估计这些完全共线的变量
比如在Stata里写reg covidrate female male
female和male加起来是100%所以有多重共线性,所以这俩变量提供的是同一条信息,模型没有办法去分结果是哪个变量再解释
Stata提示:male omitted because of collinearity,其中一个变量被省略了
VIF
方差膨胀因子,某个自变量因为和其他自变量太相关,导致它的系数估计有多不稳定、标准误被放大了多少
VIF = 1 完全没有共线性
VIF 高(>2.5) → standard errors are inflated
Common solutions to multicollinearity
Create a scale/index that contains both variable
把immigration 中foreign-born population proportion & non-official mother tongue proportion 合成,变成一个immigration index
Take out a variable / estimate the associations separately
删掉其中一个,或者分成两次抛回归
Influential outliers
删掉时,回归结果明显改变,比如系数方向,大小以及显著性
有些outlier是填写错误(养老金800万美元,每周工作168小时)
有些outlier可能是真实的,看情况有时候删有时候不删
We only need to remove outliers if they are also influential - because they alter out results.
solution to influential outliers
remove the influential outliers
Careful not to be too liberal in removing them - ask yourself: am I tho urging away unusual cases ro part of my actual data that I should care about?
Homoscedastic residual
在不同自变量取值下,残差围绕回归线的分散程度大致相同,也就是误差项方差恒定
homo开头
The spread of the observations around the regression line should be roughly of equal size for the different values of 𝑥1 (and 𝑥2 and so on)
heteroscedastic
hetero开头
在不同x水平下,y的波动本来就不一样
omitted variables,比如研究身高x1和体重y的关系时没有控制“动物种类x2”这个变量,不同种类的体重波动就会不一样
Heteroscedasticity is super common and is almost always the case with observational data
Solution to heteroscedasticity
If residuals are not homoscedastic, then they are heteroscedastic → SEs will be biased → Need to use robust standard errors by adding “, rob” to the end of your regression command
Normally distributed residuals
Only relevant for small sample! Therefore rarely applies
If we graph the distribution of th residuals, they should be normally distributed - or else we might not have accurate p= values
When samples are large (n ≥ 30), the central limit theorem applies → sampling distribution is approximately normal → we can use the 68=95-99.7 rule → we can trust our 95% confidence intervals and p values regardless of whether residuals are normally distributed
小样本时残差最好接近正态不然p值和置信区间可能不准。大样本没事因为CLT
Uncorrelated residuals
Cases in our data should not be related to each other
What person A answers in their questionnaire is uncorrelated with (i.e. independent of) what B answers in their questionnaire
Examples for when cases are related to each other:
We want a sample of individuals but have members of the same family / students from the same school in our data
Consequence of violation: the SE of coefficients are downwardly biased (t大 p小 易被误以为显著)
Solution: use clustered standard errors by adding “, cluster(variable name)” to the end of your reg command (we won’t need to do that ourselves this semester. But keep this in mind when you think about samples / populations!)