Ch6 quality control and six sigma
1/25
There's no tags or description
Looks like no tags are added yet.
Name | Mastery | Learn | Test | Matching | Spaced | Call with Kai |
|---|
No analytics yet
Send a link to your students to track their progress
26 Terms
SQC = statistical quality control
= setof tools used to evaluate organizational quality
descriptive statistics
statistical process control
acceptance sampling
SQC : descriptive statistics
describe quality characteristics and relationships
SQC : statistical process control
inspect a random sample to decide whether a process is functioning properly
SQC ; acceptance sampling
inspect a random sample to decide whether to accept an entire lot
sources of variation
variation leads to quality defects and product inconsistency
common or random causes
unavoidable due to slight differences in processing
important to determine the range of natural random variation
assignable causes :
can be identified and eliminated
examples : defective machine, low quality materials, unexperienced workder
mean(x)
measures central tendency of a set of data
standard deviation
measures amount of data disperion around the mean
range (R)
measures the difference between the largest and smallest observation in the set of data
statistical process control
monitors the production process to make sure that it stays within the range of common variation
control chart
checks whether a sample of data falls within the control limits that separate common and assignable variation
control limits are usually set at 3 standard deviations from the mean → captures 99.47% of the normal variation
statistical process control : type 1 error
chance of detecting assignable variation when it does not exist (alpha)
statistical process control : type II error
chance of not detecting assignable variation when it exists (beta)
which charts can we use for variables
(values that can be measured on a continuous scale)
→ combination of X chart and R chart
which charts can we use for attributes
discrete values that can be counted (incl yes or no decisions)
use either P-chart or C-chart
control charts for attributes : P-chart
observations belong to either of two groups (ex product is accepatble or not)
total sample size is known → proportion of defects can be computed
control charts for attributes : c-chart
defects are counted per unit, but proportion of defecta can not be computed → example : number of complaints at a hotel
control VS capacity
process control : does the process fall within ranges of common variation
process capability : does the process meet it’s predefined tolerances (specifiaction limits) imposed by design specialists
→ a process must be both in control and capable
six sigma quality
Motorola (1980s)
ensures that mu falls +-6sigma falls within speciifcation limits
only 3.4 ppm instead of 2600ppm are defective
six sigma quality requires
technical tools : statistical quality control and problem solving tools
people involvement : training and responsibility
acceptance sampling
randomly inspecting a number of items form a lot to decide whether the entire lot is accepted
before or after (not during) the production process
→ typically if testing every item is too expensive or impossible destructive testing)
Operating Characteristics Curve
shows the discriminating power of a sampling plan
→ steeper : better
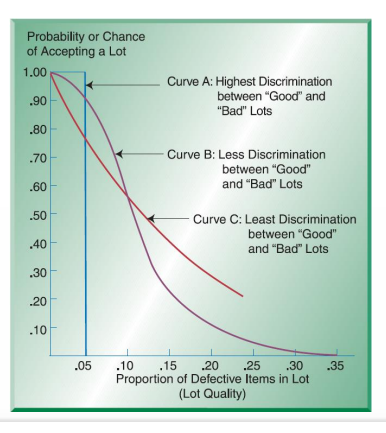
Operating Characteristics Curve : acceptable quality level AQL
small percentage of defects that customers are willing to accept
Operating Characteristics Curve : lot tolerance percent defective LTPD
maximum percentage of defective items in a lot that customers tolerate
Operating Characteristics Curve : consumer risk (type II error)
chance of accepting a lot that contains more that LTPD defects
Operating Characteristics Curve : producer risk (Type I error)
chane of rejecting a lot that contains less than AQL defects
acceptance sampling : average outgoing quality AOQ
expected proportion of defective items passed to the customer
AOQ is typically low for very good and very bad lots, but higher in between