7.2 - bronsted-lowry theory of acids and bases
1/37
There's no tags or description
Looks like no tags are added yet.
Name | Mastery | Learn | Test | Matching | Spaced | Call with Kai |
|---|
No analytics yet
Send a link to your students to track their progress
38 Terms
acid
a substance that neutralises a base forming a salt and water:
acid + base ⇌ salt + water
2HCl (aq) + CaO (s) ⇌ CaCl2 (aq) + H2O (l)
Acids are also substances that release hydrogen ions when they dissolve in water:
HCl(g) → H+(aq) + Cl- (aq)

common acids and what they dissociate into in water
Hydrochloric acid
HCl forms H+ + Cl– in water
Nitric acid
HNO3 forms H+ + NO3– in water
Sulfuric acid
H2SO4 forms H+ + SO42– in water
Ethanoic acid
CH3COOH forms H+ + CH3COO– in water
monoprotic acid
an acid that can donate only one proton (hydrogen ion) per molecule in a chemical reaction
inorganic vs organic acid dissociation
Monoprotic inorganic acids, such as hydrochloric acid, fully dissociate into their ions
Organic acids, such as carboxylic acids, do not fully dissociate into their ions
Only some of the hydrogen atoms can form ions
base
A base is a compound that neutralises an acid forming a salt and water
acid + base ⇌ salt + water
2HCl (aq) + CaO (s) ⇌ CaCl2 (aq) + H2O (l)
A base is a substance that accepts hydrogen ions or a compound that contains oxide or hydroxide ions
For example, when the base ammonia is added to water, the ammonium ion and hydroxide ions are formed:
NH3 (g) + H2O (l) → NH4+ (aq) + OH– (aq)
For example, when sodium hydroxide is dissolved in solution, sodium ions and hydroxide ions are formed:
NaOH (s) + aq → Na+ (aq) + OH– (aq)
A base that is soluble in water is called an alkali
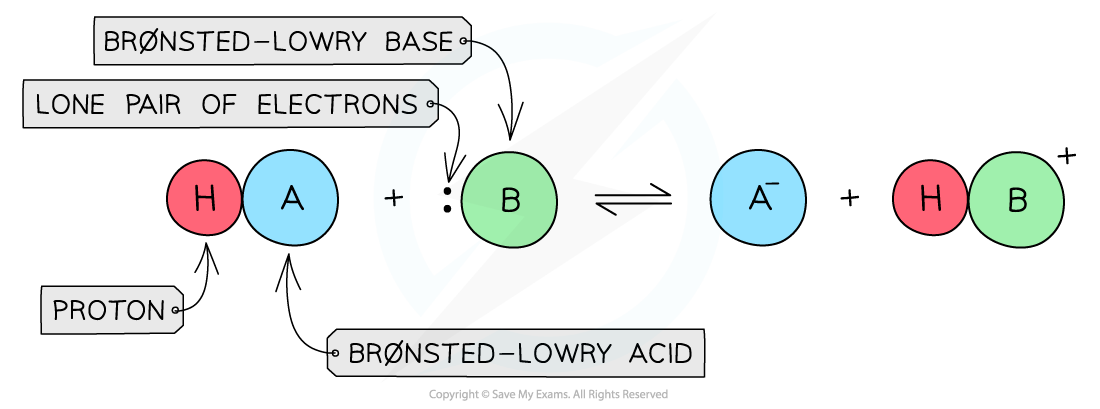
The Brønsted-Lowry Theory
defines acids and bases in terms of proton transfer between chemical compounds
A Brønsted-Lowry acid is a species that gives away a proton (H+)
A Brønsted-Lowry base is a species that accepts a proton (H+) using its lone pair of electrons
amphoteric
Species that can act both as acids and bases are called amphoteric
Eg. water as a Brønsted-Lowry acid
Water acting as a Brønsted-Lowry acid

The diagram shows water acting as a Brønsted-Lowry acid by donating a proton to ammonia which accepts the proton using its lone pair of electronsDot and cross diagram showing the Brønsted-Lowry behaviour of water with ammonia

The diagram shows a dot & cross diagram for the reaction of water with ammonia to show how water acts as a Brønsted-Lowry acid and ammonia as a Brønsted-Lowry base
E.g. water as a Brønsted-Lowry base
Water acting as a Brønsted-Lowry base

The diagram shows water acting as a Brønsted-Lowry base by accepting a proton from hydrochloric acid proton using its lone pair of electronsDot and cross diagram showing the Brønsted-Lowry behaviour of water with hydrochloric acid

The diagram shows a dot & cross diagram for the reaction of water with hydrochloric acid to show how water acts as a Brønsted-Lowry base and ammonia as a Brønsted-Lowry acid
is Brønsted-Lowry Theory only for aqueous solutions
The Brønsted-Lowry Theory is not limited to aqueous solutions only and can also be applied to reactions that occur in the gas phase
A Brønsted-Lowry acid and base reaction

HCl acts as a Brønsted-Lowry acid by donating a proton while ammonia acts as a Brønsted-Lowry base by accepting a proton
examiner tips and tricks
An atom of hydrogen contains 1 proton, 1 electron and 0 neutrons.
When hydrogen loses an electron to become H+ only a proton remains, which is why a H+ ion is also called a proton.
strong acid
an acid that dissociates almost completely in aqueous solutions
E.g. HCl (hydrochloric acid), HNO3 (nitric acid) and H2SO4 (sulfuric acid)
The position of the equilibrium is so far over to the right that you can represent the reaction as an irreversible reaction
Diagram showing the dissociation of a strong acid in aqueous solution

solution formed from a strong acid
The solution formed is highly acidic due to the high concentration of the H+ / H3O+ions
Since the pH depends on the concentration of H+ / H3O+ ions, the pH can be calculated if the concentration of the strong acid is known
The concentration of H+ / H3O+ ions can be written as [H+ (aq)]
pH is the negative log of the concentration of H+ / H3O+ ions and can be calculated, if the concentration of the strong acid is known, using the stoichiometry of the reaction
pH = –log10 [H+ (aq)]
weak acids and the solution they form
A weak acid is an acid that partially (or incompletely) dissociates in aqueous solutions
E.g. most organic acids (ethanoic acid), HCN (hydrocyanic acid), H2S (hydrogen sulfide) and H2CO3 (carbonic acid)
The position of the equilibrium is more to the left and an equilibrium is established
Diagram showing the dissociation of a weak acid in aqueous solution

In an aqueous solution, a weak acid does not fully dissociate
The solution is less acidic due to the lower concentration of H+ / H3O+ ions
Finding the pH of a weak acid is a bit more complicated as now the concentration of H+ ions is not equal to the concentration of acid
To find the concentration of H+ ions, the acid dissociation constant (Ka) should be used
acid and equilibrium position summary
Position of equilibrium
Strong acid; right
Weak acid; left
Dissociation
Strong acid; fully dissociated (→)
Weak acid; partially dissociated (⇌)
H+ concentration
Strong acid; high concentration
Weak acid; low concentration
pH
Strong acid; use [strong acid] for [H+]
Weak acid; use Ka to find [H+]
Examples
Strong acid; HCl, HNO3, H2SO4 (first ionisation)
Weak acid; Organic acids, e.g. ethanoic acid, HCN, H2S, H2CO3
strong base
a base that dissociates almost completely in aqueous solutions
E.g. Group 1 metal hydroxides such as NaOH (sodium hydroxide)
The position of the equilibrium is so far over to the right that you can represent the reaction as an irreversible reaction
Diagram showing the dissociation of a strong base in aqueous solution

In an aqueous solution, a strong base almost completely dissociates
The solution formed is highly basic due to the high concentration of the OH– ions
weak bases
a base that partially (or incompletely) dissociates in aqueous solutions
E.g. NH3 (ammonia), amines and some hydroxides of transition metals
The position of the equilibrium is more to the left and an equilibrium is established
Diagram showing the dissociation of a weak base in aqueous solution

In an aqueous solution, a weak base does not fully dissociate
The solution is less basic due to the lower concentration of OH- ions
base and equilibrium position summary
Position of equilibrium
Strong base; right
Weak base; left
Dissociation
Strong base; fully dissociated (→)
Weak base; partially dissociated (⇌)
OH- concentration
Strong base; high concentration
Weak base; low concentration
Examples
Strong base; Group 1 metal hydroxides
Weak base; NH3 amines, some transition metal hydroxides
examiner tips and tricks about hydrogen ions (how they can be written)
Hydrogen ions in aqueous solutions can be written as either as H3O+ or as H+ however, if H3O+ is used, H2O should be included in the chemical equation:
HCl (g) → H+ (aq) + Cl- (aq)
or
HCl (g) + H2O (l) → H3O+ (aq) + Cl- (aq)
examiner tips and tricks
Remember that some acids are both strong and weak acids – for example, H2SO4(sulfuric acid) has two hydrogen ions that can ionise.
H2SO4 acts as a strong acid: H2SO4 → H+ + HSO4-
HSO4- acts as a weak acid: HSO4- ⇌ H+ + SO42-
Also, don't forget that the terms strong and weak acids and bases are related to the degree of dissociation and not the concentration.
The appropriate terms to use when describing concentration are dilute and concentrated.
pH scale
The pH scale is a numerical scale that shows how acidic or alkaline a solution is
The values on the pH scale go from 1-14 (extremely acidic substances have values of below 1)
All acids have pH values below 7
All alkalis have pH values above 7
The lower the pH, the more acidic the solution is
The higher the pH, the more alkaline the solution is
The pH scale

pH of water
An equilibrium exists in water where few water molecules dissociate into proton and hydroxide ions:
H2O (l) ⇌ H+ (aq) + OH– (aq)
The equilibrium constant expression for this reaction is:
Kc = [H+] [OH-] / [H2O]
The equilibrium constant expression can be rearranged to:
Kc x [H2O] = [H+] [OH–]
Since the concentration of the H+ and OH- ions is very small, the concentration of water is considered to be a constant (cuz it pretty much stays the same)
So, the expression can be rewritten as:
Kw = [H+] [OH–]
Where Kw (ionic product of water (equilibrium constant for autoionization of water) = Kc x [H2O] = 10-14 mol2 dm-3 at 298K
Water at 298K has equal amounts of OH- and H+ ions with concentrations of 10-7mol dm-3
To calculate the pH of water, the following formula should be used:
pH = –log [H+ (aq)]
Where [H+ (aq)] is the concentration of H+ / H3O+ ions
So, the calculation is:
pH = -log (10-7) = 7
Thus, water has a pH of 7
pH of acids
Acidic solutions (strong or weak) always have more H+ than OH- ions
Since the concentration of H+ is always greater than the concentration of OH-ions, [H+] is always greater than 10-7 mol dm-3
Using the pH formula, this means that the pH of acidic solutions is always below 7
The higher the [H+] of the acid, the lower the pH
pH of bases
Basic solutions (strong or weak) always have more OH- than H+ ions
Since the concentration of OH- is always greater than the concentration of H+ions, [H+] is always smaller than 10-7 mol dm-3
Using the pH formula, this means that the pH of basic solutions is always above 7
The higher the [OH-] of the base, the higher the pH
Strong and weak acids can be distinguished from each other by their:
pH value (using a pH meter or universal indicator)
Electrical conductivity
Reactivity
distinguishing strong and weak acids using pH
An acid dissociates into H+ in solution according to:
HA → H+ + A-
The stronger the acid, the greater the concentration of H+ and therefore the lower the pH
pH values of a strong & weak acids
pH of 0.1 mol dm-3 solution:
HCl (strong); pH 1
CH3COOH (weak); pH 2.0
The most accurate way to determine the pH is by reading it off a pH meter
The pH meter is connected to the pH electrode which shows the pH value of the solution
Using a digital pH meter

The diagram shows a digital pH meter measures the pH of a solution using a pH electrode
A less accurate method is to measure the pH using universal indicator paper
The universal indicator paper is dipped into a solution of acid, upon which the paper changes colour
The colour is then compared to those on a chart which shows the colours corresponding to different pH values
How to use universal indicator paper

The diagram shows the change in colour of the universal indicator paper when dipped in a strong and weak acid. The colour chart is used to read off the corresponding pH values which are between 1-2 for a strong acid and 3-4 for a weak acid
distinguishing strong and weak acids using electrical conductivity
Since a stronger acid has a higher concentration of H+ it conducts electricity better
Stronger acids therefore have a greater electrical conductivity
The electrical conductivity can be determined by using a conductivity meter
Like the pH meter, the conductivity meter is connected to an electrode
The conductivity of the solution can be read off the meter
Using a digital conductivity meter

The diagram shows a digital conductivity meter that measures the electrical conductivity of a solution using an electrode
distinguishing strong and weak acids using reactivity
Strong and weak acids of the same concentrations react differently with reactive metals
This is because the concentration of H+ is greater in strong acids compared to weak acids
The greater H+ concentration means that more H2 gas is produced
The reaction of 0.1 mol dm-3of a strong acid, HCl, with Mg

The reaction produces a lot of bubbles and hydrogen gas due to the high concentration of H+ present in the solutionThe reaction of 0.1 mol dm-3of a weak acid, CH3COOH, with Mg

The reaction produces fewer bubbles and hydrogen gas due to the lower concentration of H+ present in the solution
examiner tips and tricks
The above-mentioned properties of strong and weak acids depend on their ability to dissociate and form H+ ions.
Stronger acids dissociate more, producing a greater concentration of H+ ions and therefore showing lower pH values, greater electrical conductivity and more vigorous reactions with reactive metals.
neutralisation reactions
A neutralisation reaction is one in which an acid (pH <7) and a base/alkali (pH >7) react together to form water (pH = 7) and a salt:
acid + base (alkali) → salt + water
The proton of the acid reacts with the hydroxide of the base to form water:
H+ (aq) + OH– (aq) → H2O (l)
The spectator ions which are not involved in the formation of water are Na+ (aq) + Cl– (aq)
These react to form the salt:
Na+ (aq) + Cl– (aq) → NaCl (aq)
The name of the salt produced can be predicted from the acid that has reacted
Salts produced from certain acids
Hydrochloric acid forms chloride salts
Sulfuric acid forms sulfate salts
Nitric acid forms nitrate salts
Ethanoic acid ethanoate salts
examiner tips and tricks
Note that the reaction of an acid and metal carbonate also forms carbon dioxide:
acid + metal carbonate → salt + water + carbon dioxide
pH titration curves
Titration is a technique used in neutralisation reactions between acids and alkalis to determine the concentration of the unknown solution
It involves adding a titrant of known concentration from a burette into a conical flask containing the analyte of unknown concentration
An indicator is added which will change colour at the endpoint of the titration
The endpoint is the point at which an equal number of moles of titrant and analyte react with each other
The equivalence point is halfway along the vertical region of the curve
Equivalence point → moles of alkali = moles of acid
This is also known as the equivalence point and this is the point at which neutralisation takes place
Example pH titration curve

The equivalence point is the point at which an equal number of moles of titrant and analyte have reacted
drawing a pH titration curve
Sketching a pH titration curve
Draw axes with volume added (cm3) on the x-axis and pH on the y-axis

Draw a horizontal line running parallel to the x-axis at pH 7
Everything below this line will be in the acidic region and everything above it in the alkaline region

Determine which substance is in the conical flask
If it is a strong acid the initial pH is about 1 or 2
If it is a weak acid the initial pH is about 2-3
If it is a strong alkali the initial pH is about 13-14
If it is a weak alkali the initial pH is about 11

Determine what type of acid and alkali are used:
Strong acid + strong alkali
Strong acid + weak alkali
Weak acid + strong alkali
Weak acid + weak alkali

Draw the pH titration curve

strong acid + strong alkali pH titration curve
Initially, there are only H+ ions present in the solution from the dissociation of the strong acid (HCl) (initial pH about 1-2)
As the volume of strong alkali (NaOH) added increases, the pH of the HCl solution slightly increases too as more and more H+ ions react with the OH- from the NaOH to form water
The change in pH is not that much until the volume added gets close to the equivalence point
The pH surges upwards very steeply
The equivalence point is the point at which all H+ ions have been neutralised
Therefore, the pH is 7 at the equivalence point
Adding more NaOH will increase the pH as now there is an excess in OH- ions (final pH about 13-14)
pH titration curve for a strong acid + strong alkali

The diagram shows a pH titration curve of hydrochloric acid with sodium hydroxide
The pH titration curve for HCl added to a NaOH has the same shape
The initial pH and final pH are the other way around
The equivalence point is still 7
pH titration curve for a strong alkali + strong acid

The diagram shows a pH titration curve of sodium hydroxide with hydrochloric acid
Strong acid + weak alkali pH titration curve
Initially, there are only H+ ions present in the solution from the dissociation of the strong acid (HCl) (initial pH about 1-2)
As the volume of weak alkali (NH3) added increases, the pH of the analyte solution slightly increases too as more and more H+ ions react with the NH3
The change in pH is not that much until the volume added gets close to the equivalence point
The equivalence point is the point at which all H+ ions have been neutralised by the NH3 however the equivalence point is not neutral, but the solution is still acidic (pH about 5.5)
This is because all H+ have reacted with NH3 to form NH4+ which is a relatively strong acid, causing the solution to be acidic
As more of the NH3 is added, the pH increases to above 7 but below that of a strong alkali as NH3 is a weak alkali
pH titration curve for a strong acid + weak alkali

The diagram shows a pH titration curve of hydrochloric acid with ammonia
The pH titration curve for strong acid added to a weak alkali has the same shape
The initial and final pH are the other way around
The equivalence point is still about 5.5
Weak acid + strong alkali pH titration curve
Initially, there are only H+ ions present in the solution from the dissociation of the weak acid (CH3COOH, ethanoic acid) (initial pH about 2-3)
As the volume of strong alkali (NaOH) added increases, the pH of the ethanoic acid solution slightly increases too as more and more H+ ions react with the OH-from the NaOH to form water
The change in pH is not that much until the volume added gets close to the equivalence point
The pH surges upwards very steeply
The equivalence point is the point at which all H+ ions have been neutralised by the OH- ions however the equivalence point is not neutral, but the solution is slightly basic (pH about 9)
This is because all H+ in CH3COOH have reacted with OH- however, CH3COO- is a relatively strong base, causing the solution to be basic
As more of the NaOH is added, the pH increases to about 13-14
pH titration curve for a weak acid + strong alkali

The diagram shows a pH titration curve of a weak acid with a strong base
The pH titration curve for weak acid added to a strong alkali has the same shape
The initial and final pH are the other way around
The equivalence point is still about 9
Weak acid + weak alkali pH titration curve
Initially, there are only H+ ions present in the solution from the dissociation of the weak acid (CH3COOH, ethanoic acid) (initial pH about 2-3)
In these pH titration curves, there is no vertical region
There is a ‘point of inflexion’ at the equivalence point
The curve does not provide much other information
pH titration curve for a weak acid + weak alkali

The diagram shows a pH titration curve of weak acid with weak alkali
examiner tips and tricks
You should be able to read and sketch pH titration curves of titrations where the titrant is an acid or an alkali.
indicators
substances that change colour when they are added to acidic or alkaline solutions
When choosing the appropriate indicator, the pH of the equivalence point is very important
The two most common indicators that are used in titrations are methyl orange and phenolphthalein
Indicator & pH range examples
Both indicators change colour over a specific pH range
Methyl orange 3.1 - 4.4
Phenolphthalein 8.3 - 10.0
Diagram showing the colour changes for methyl orange and phenolphthalein

Methyl orange changes from red to yellow over a pH range of 3.1 - 4.4, while phenolphthalein changes from colourless to pink over a pH range of 8.3 - 10.0
choosing indicators for titrations
Strong acid and strong alkali
The colour change for both indicators takes place at a pH range that falls within the vertical region of the curve
Therefore, either indicator can be used
Methyl orange and phenolphthalein in a strong acid + strong alkali titration

Both indicators can be used to determine the endpoint of the titration of a strong acid and strong alkali
Strong acid and weak alkali
Only methyl orange will change colour at a pH close to the equivalence point and within the vertical region of the curve
Methyl orange and phenolphthalein in a strong acid + weak alkali titration

Only methyl orange can be used to determine the endpoint of the titration of a strong acid and weak alkali
Weak acid and strong alkali
Now, only phenolphthalein will change colour at a pH close to the equivalence point and within the vertical region of the curve
The pH range at which methyl orange changes colour falls below the curve
Methyl orange and phenolphthalein in a weak acid + strong alkali titration

Only phenolphthalein can be used to determine the endpoint of the titration of a weak acid and strong alkali
Weak acid and weak alkali
Neither indicator is useful, and a different method should be considered
Methyl orange and phenolphthalein in a weak acid + weak alkali titration

Neither indicator can be used to determine the endpoint of the titration of a weak acid and weak alkali