zArchive ISS W1 Types of data
1/20
There's no tags or description
Looks like no tags are added yet.
Name | Mastery | Learn | Test | Matching | Spaced | Call with Kai |
|---|
No analytics yet
Send a link to your students to track their progress
21 Terms
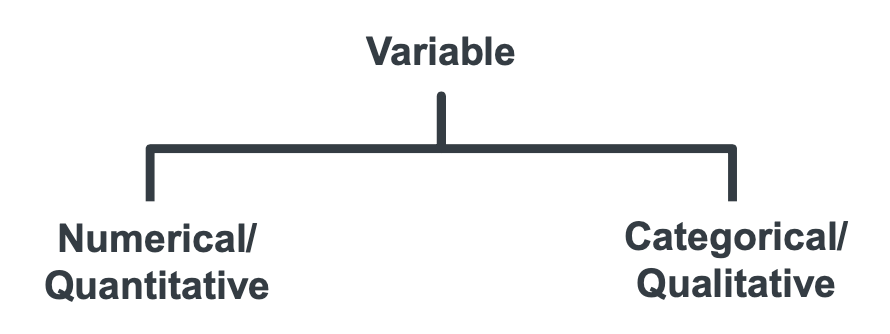
What are the two main types of data?
Quantitative (numerical)
Qualitative (categorical)
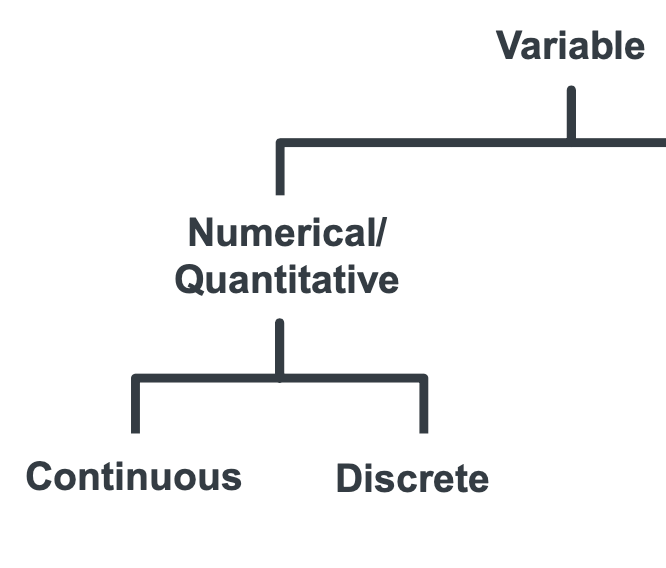
What are the two types of quantitative/numerical data?
Continuous
Discrete
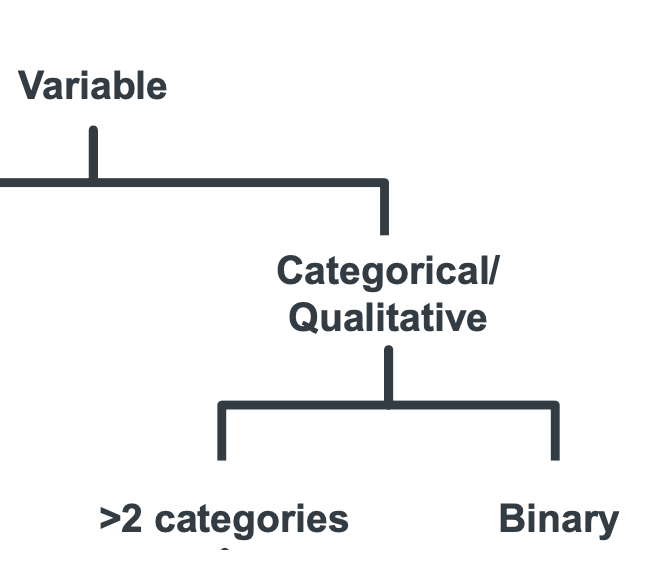
What are the two types of qualitative/categorical data?
Multiple categories
Binary
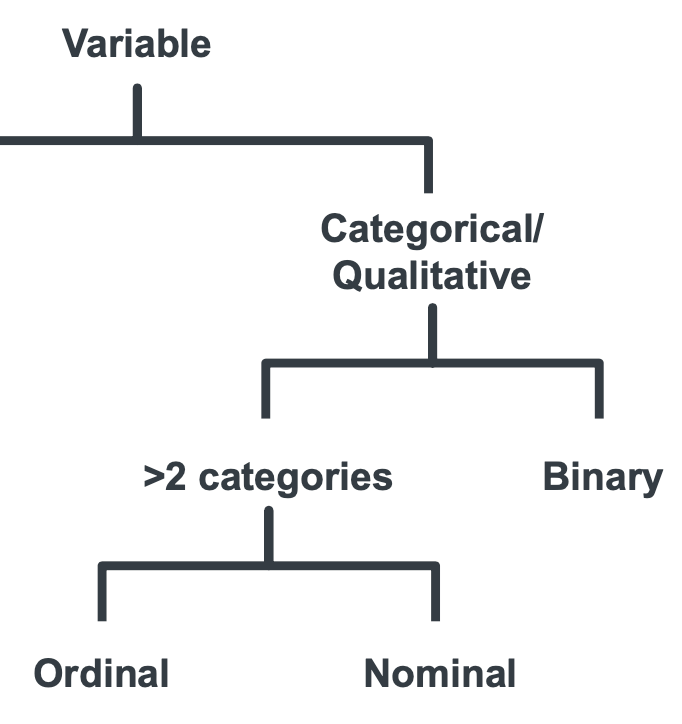
What are the two types of ‘multiple categorical’ qualitative/categorical data?
Ordinal
Nominal
List two characteristics of quantitative/numerical variables.
Takes numerical values only
The values reflect the actual measurement (with units) of the subjects or objects we are measuring
Describe two characteristics of qualitative/categorical variables.
Contains only categories which can usually be labelled by words/phrases
Each category represents a particular characteristic of interest within a group of subjects or objects which often used as labels.
When are numeric values used for qualitative/categorical variables?
When coding in statistical packages at data entry stage.
What type of variable is this example: “number of apples eaten last week ( 0 / 1 / 2 / 3 or more )
Categorical
>2 categories
Ordinal
What must you report with continuous variables?
The unit of measurement
When would a discrete variable become a qualitative/categorical (ordinal) variable? Give an example.
If multiple discrete categories were collapsed into a single category.
When options for 3 / 4 / 5 get lumped into a >=3 category.
What is a difference between ordinal and nominal variables?
Ordinal can be ranked i.e. they have a meaningful order.
Nominal categories have no order.
What is a common feature of ordinal, nominal and binary variables?
They all contain categories that are mutually exclusive.
Can you take an average of nominal variable categories?
No - it’s meaningless and/or not possible.
How are you transforming this data: a continuous scale is dissected into a smaller range of scale, i.e. age group: 0-10, 11-20, 21-30, ...etc
Continuous to ordinal transformation.
How are you transforming this data: you cut a range of values into 2 parts, i.e. disease status from a bio marker: <7 = disease, ≥7 = non-disease
Continuous or discrete to binary transformation.
How are you transforming this data: Log transform a continuous skewed variable, i.e. ln(age)
Continuous to a different form of continuous transformation.
Give 2 examples of continuous variables.
Height (cm)
Weight (g/kg)
Circumference (mm)
Give 2 examples of discrete variables.
No. of children in a family
No. of apples consumed in one week
Give 2 examples of ordinal variables.
Disease stage (Mild / Moderate / Severe)
Likert scale (Strongly agree / Agree / Neutral / Disagree / Strongly disagree)
Give 2 examples of nominal variables.
Ethnicity (White / Black / Asian / Chinese / Other)
Blood group (A / B / AB / O)
Give 2 examples of binary variables.
Sex (male / female)
Status (Dead / Alive)
BMI (<30kg/m2 / ≥30kg/m2)
Obese (Yes / No)