Population Growth
1/26
Earn XP
Description and Tags
Chapter 4-7
Name | Mastery | Learn | Test | Matching | Spaced | Call with Kai |
|---|
No analytics yet
Send a link to your students to track their progress
27 Terms
Life Table
Summary of survival and reproduction across lifetime
“Snapshot” of life history of a population
Life Table Y-Axis
Log Scale
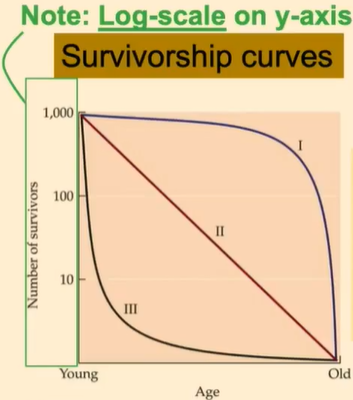
Type I Survivorship Curve
Lots of offspring live to old age
Little predation
Most mortality due to old age
Type II Survivorship Curve
Constant death rate across age
Type III Survivorship Curve
Lots of offspring die young
Lots of predation
Population Size of Next Year
[# of Survivors] + [# of Births]
Stable Age Distribution
If survival and fecundity stay the same —> then population will reach a predictable age distribution (constant growth rate)
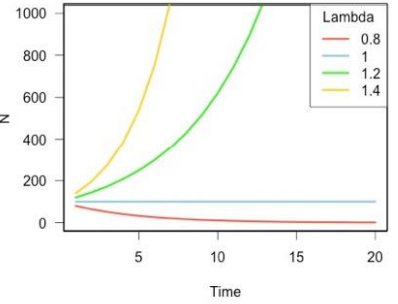
Exponential Population Growth
Same as geometric growth but for case where reproduction occurs continuously
The defining feature of geometric/exponential population growth is…
Population growth rate (λ or r) is constant across time, it does not change
If population size increases:
dN/dt = increases
r = no change
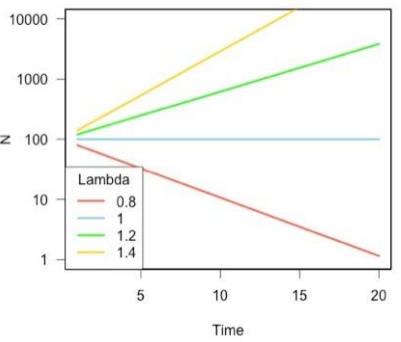
λ > 1 or r > 0
Population growth rate is positive
Population increases in size
λ < 1 or r < 0
Population growth rate is negative
Population decreases in size
λ = 1 or r = 0
Population growth rate is 0
Population size stays the same
Normal Scale
Log Scale
Density-Independent Factors
Effect on birth and death rates are independent of the number of individuals in the population
Drought
Extreme weather
Flood
Pollution
Density-Dependent Factors
Birth, death, and dispersal rates change as the density of the population changes
Most often, there is negative density dependence (deaths increase when population is crowded)
What happens when you increase density, specifically the # of breeding females?
Reduces birth rate because of per capita resource abundance
Can reverse by adding more resources
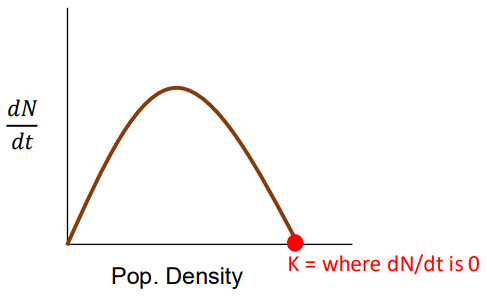
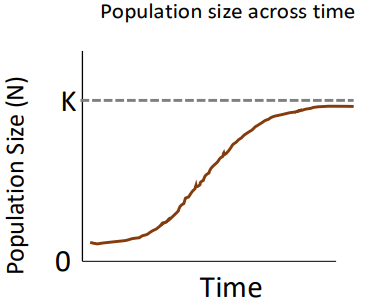
Logistic Growth
Population increases rapidly, then stabilizes at the carrying capacity (K)
K
Maximum population size that can be supported indefinitely by the environment
Carrying Capacity
Determined by the amount of resources
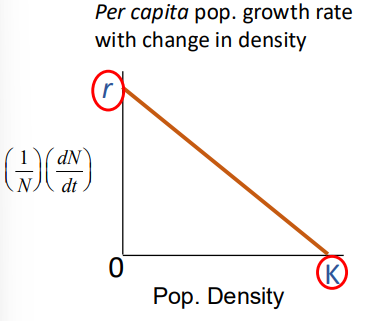
Birth rate = Death rate
Per-Capita growth rate = 0
When N is small relative to K (N < K)
Population growth almost like exponential growth
When N is close to K (N = K)
Population stops growing
What is the slope of the tangent line?
dN/dt or overall population growth rate
Logistic Growth: Population size across time
Logistic Growth: Per capita pop. growth rate with change in density
Logistic Growth: Population growth rate with change in density