Own Fieldwork
1/94
Earn XP
Description and Tags
Name | Mastery | Learn | Test | Matching | Spaced | Call with Kai | Chat |
|---|
No analytics yet
Send a link to your students to track their progress
95 Terms
List the 3 sampling stratergies.
Systematic, stratified and random.
What is sampling?
Dividing the study area or population into different groups and taking samples from each group.
Compare random, systematic and stratified sampling.
Random - Choosing locations or people by chance.
Systematic - Collecting data at regular intervals.
Stratified - Divide areas into separate groups and proportional samples are selected within them.
What are the pros and cons of systematic sampling?
Pros: Simple, quick and easy to follow. Ensures data is spread across the whole study area.
Cons: Can give inaccessible or unsafe locations like farmland. Important changes or patterns between intervals may be missed.
What are the pros and cons of random sampling?
Pros: Each area/point/person has an equal chance of selection. Reduces bias to make results more reliable.
Cons: Clustering of results so may end up with unrepresentative data e.g. all upper course data. Can give inaccessible and unsafe fieldwork locations. Important locations may be missed by chance.
What are the pros and cons of stratified sampling?
Pros: Data from safe, accessible locations. Can be combined with random and systematic sampling. Very representative because all groups are included.
Cons: Bias when defining areas and locations. Time consuming to set up. Requires prior knowledge of an area or population.
For your human fieldwork geography enquiry, suggest the advantages of one sampling strategy you used for collecting primary data.
Used stratified sampling. This included dividing areas equally and selecting proportionate data for each one.
This was useful as it meant that we visited a mixed use, tourist and a residential site, allowing our data to be less bias and representative of all areas which improved the accuracy of our enquiry.
Used random sampling. This was used during our questionnaire to random select people by chance.
This reduces bias as we didn’t only survey certain types of people, making our questionnaire more reliable and therefore our conclusion also more reliable.
What is the difference between accuracy and reliability?
Reliability - A measure of how repeatable your investigation is. If your investigation was repeated again, would you get the same or similar results?
Accuracy - A measure of how close the data is to the true value - affected by human error.
Outline how using secondary data can be useful in a fieldwork enquiry.
Provides extra data that has been collected at different times or dates which helps improve the reliability of conclusions.
Provides extra data that has been collected by other people so reduces bias and balances the data that is used to draw a conclusion.
What is our physical fieldwork enquiry question?
How does the river discharge of the River Tillingbourne change as you move downstream?
Where is the River Tillingbourne located?
In Surrey (South East England) between Dorking and Guildford.
What is my hypothesis for our physical fieldwork enquiry question?
The discharge will increase downstream the River Tillingbourne.
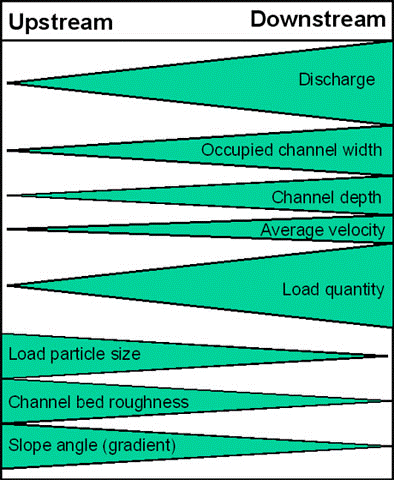
What is this model called?
Bradshaw Model.
What is the geographical theory supporting your physical fieldwork enquiry?
Bradshaw model states that discharge increases downstream.
Tributaries join.
Lateral erosion increases which increases river width, depth and carrying capacity.
Erosion also reduces load particle size so there’s more space to hold water.
Why is the chosen location suitable for your physical geography enquiry?
Safe as it is shallow, has level ground and is a tributary so a smaller river.
Small drainage basin so easy for us to get in safely and therefore efficiently collect our data.
Short at only 19km long so we can see the change in the river over a short distance and collect all data in one day.
Accessible as it’s not private land and is close to a main road (M25, A3, A25) so we can easily drive between sites and collect all data in one day.
How may our location for our physical fieldwork enquiry be unsuitable?
The river may have uneven ground or slippery rocks.
Lots of traffic on the A25/M25 to make collecting data time consuming.
Near the road which could lead to injuries if not using the road safely.
How do you calculate discharge?
Discharge = cross sectional area x velocity.
How do you calculate cross sectional area?
Width x Mean depth.
How do you calculate velocity?
Distance / Time.
Which 4 types of primary data did we use during our physical fieldwork enquiry?
River width.
River mean depth.
River velocity.
Annotated field sketch.
How did we measure the width of the river?
Using a tape measure across the width of the channel from bank to bank.
Justify why you had to measure the river width using a tape measure for your physical geography enquiry.
So that we can use the width to calculate cross sectional area (width x mean depth), which will then allow us to calculate discharge (cross sectional area x velocity).
How did we measure the mean depth of the river?
Using a metre ruler to measure depth from river bed at 5 points across the channel (Bank, 1/4, 1/2, 3/4, Bank).
Justify why you had to measure the river depth using a metre stick for your physical geography enquiry.
So that we can use the depth to calculate cross sectional area (width x mean depth), which will then allow us to calculate discharge (cross sectional area x velocity).
How did we measure the velocity of the river?
Using a cork and stop watch to time how long it takes the cork to travel 1 metre and repeat for mean velocity.
Justify why you had to measure the velocity for your physical geography enquiry.
So that we can use the velocity to calculate discharge by multiplying it by the cross sectional area to then determine discharge.
How did we draw the annotated field sketch of the river?
Using a pencil and paper to sketch the area with key features labelled such as trees, tarmac etc.
Justify why you had to draw an annotated field sketch for your physical geography enquiry.
To draw particular features such as vegetation and trees, which suggests a lower discharge due to more interception, and where impermeable surfaces like tarmac pavements are, suggesting higher discharge.
Which types of secondary data did we use during our river fieldwork?
Land use data and Geology data , provided by FSC.
In our physical fieldwork enquiry, why did we look at the geology of the area?
Geology affects the discharge of the river with permeable rock allowing lots of percolation and impermeable rock leading to higher surface run off.
Explain how we used the secondary data of geology in our river fieldwork.
The land has mainly high permeability, suggesting that there is increased infiltration, reduced surface run off longer lag time and lower discharge.
In our physical fieldwork enquiry, why did we look at the land use of the area?
If there is a higher amount of woodland and trees, this allows more interception whilst a higher amount of urban areas, increases surface run off due to more pavements/roads.
Explain how we used the secondary data of land use data in our river fieldwork.
Majority of land (almost 50%) is used for woodland, suggesting more trees and therefore more interception and longer lag time.
Some land used for grassland, suggesting more infiltration, more vegetation, longer lag time and lower discharge.
Little land used for urban use (almost 10%), suggesting little impermeable surfaces so surface run off is reduce.
In our physical fieldwork enquiry, which quantitative data collection methods did we use?
River depth.
River width.
River velocity.
Geology data.
Land use data.
In our physical fieldwork enquiry, which qualitative data collection methods did we use?
Annotated field sketch.
Name some potential hazards associated with our river fieldwork.
Slippery rocks and uneven ground.
Livestock.
Weil’s disease.
What is the risk and management of slippery rocks and uneven ground?
Risk - Risk of slipping on rocks causing slips, trips or falls and then injury.
Management - Wear sturdy, appropriate footwear and be careful.
What is the risk and management of Weil’s disease?
Risk - Can be contracted through contaminated freshwater and lead to flu like symptoms.
Management - Cover cuts or open wounds + wash and sanitise hands after contact with the water.
What is the risk and management of livestock?
Risk - Being attacked by aggressive animals.
Management - Do not approach animals and avoid fields of livestock.
Which 2 types of data presentation methods did we use during our physical fieldwork enquiry?
Scattergraph.
Located cross profile.
How did we present our discharge data in our physical fieldwork enquiry?
Scattergraph.
How did we present our width, depth and carrying capacity data in our physical fieldwork enquiry?
Located cross profile.
In our physical fieldwork enquiry, we used a scattergraph to represent our data. State the advantages of this.
Shows positive correlation between discharge and distance downstream to answer the enquiry question.
Line of best fit to highlight how strong the correlation was.
In our physical fieldwork enquiry, we used a scattergraph to represent our data. State the disadvantage of this.
Only plotted 3 sites and one was secondary data.
In our physical fieldwork enquiry, we used a located cross profile to represent our data. State the advantages of this.
Shows distance between sites and flow of water direction.
Visually shows how river depth, width and carrying capacity change to compare cross section width and depth across 3 sites.
In our physical fieldwork enquiry, we used a located cross profile to represent our data. State the disadvantage of this.
The distance between sites is inaccurate and unclear due to no scale.
In terms of accuracy, what were the strengths of our physical fieldwork enquiry?
No specialist equipment used so it was easy to use and read a stop watch and tape measurer.
Same methods used at each site so we got used to reading accurately.
In terms of accuracy, what were the weaknesses of our physical fieldwork enquiry?
Person stopping stopwatch did not always start or stop it at the correct time due to slow reaction times.
Didn’t always hold tape taught.
The vegetation at the banks of the river.
Person or ruler may prevent river flow.
Not dropping cork at the same height.
In terms of reliability, what were the strengths of our physical fieldwork enquiry?
Middle and lower course data collected.
Stratified sampling used.
In terms of reliability, what were the weaknesses of our physical fieldwork enquiry?
We only visited on one day in September when is was very rainy which could influence the discharge.
Didn’t visit the upper course.
Used secondary data for third site.
How could the accuracy of our physical fieldwork enquiry be improved?
Should have taken multiple width measurements and calculated an average.
Specify a height to drop the cork from each time.
Countdown for the cork drop.
How could the reliability of our physical fieldwork enquiry be improved?
Visit the upper course.
Visits on multiple days in different seasons.
What is our human fieldwork enquiry question?
Has the Olympic Park regeneration scheme in Stratford left a positive legacy?
What is regeneration?
The attempt to reverse the decline of an urban area by improving its physical structure and local economy.
What is my hypothesis for our human fieldwork enquiry question?
The Olympic park regeneration scheme in Stratford has left a positive legacy.
What is the geographical theory supporting your human fieldwork enquiry?
Urban regeneration is the attempt to reverse the decline of an urban area by improving its physical structure and local economy.
This is most likely to occur in places suffering from social deprivation or with many brown field sites (derelict, abandoned).
Regeneration is good because it tackles social deprivation by creating more services like healthcare and education or creating affordable homes, improving quality of life. However, it can lead to gentrification.
Explain why your human fieldwork enquiry topic was suitable.
Urban regeneration is the attempt to reverse the decline of an urban area by improving its physical structure and local economy.
This occurred in Olympic park for the 2012 olympics to tackle social deprivation by creating more services like healthcare and education or creating affordable homes, improving quality of life.
Why is the chosen location suitable for your human geography enquiry?
It is an area that has suffered from social deprivation and has undergone regeneration in the 2012 Olympic Games.
Easily accessible due to good transport links and small park (560 acres) so all data can be collected in one day.
Shopping centre = CCTV/security so it is a safe urban area.
Mix of residential and leisure areas to gain a wide variety of public opinions from residents and tourists.
Why may the chosen location be unsuitable for your human geography enquiry?
Near busy roads so dangerous.
Residential areas were quiet which made the questionnaire difficult to carry out.
Which 4 types of primary data did we use during our human fieldwork enquiry?
Annotated field sketch.
Questionnnare.
Environmental quality survey.
Pedestrian count.
Justify why you conducted questionnaires and used TripAdvisor reviews for your human geography enquiry.
Shows us the opinions of the members of the public to show if people view the park positively, suggesting a positive legacy.
Justify why you used annotated field sketches and an environmental quality survey for your human geography enquiry.
Allows us to capture the positive and negative features of each site such as if the buildings are in use and if the environment/buildings are well maintained after the Olympic Games to suggest a positive or negative legacy.
Justify why you carried out a pedestrian count for your human geography enquiry.
Allows us to see if the Olympic park is still being used.
Which 3 types of secondary data did we use during our human fieldwork enquiry?
BBC news report on London Legacy Development Corporation (LLDC)’s failures to meet affordable housing targets.
Geographic Information System (GIS) - google maps.
Online reviews of the Olympic Park on TripAdvisor.
What were our key findings about affordable housing from the BBC news report?
Negative legacy.
Originally 9000 homes were planned to be affordable but fewer than 200 homes are offered at the cheapest level of rent.
Only 37% of the housing is affordable whilst the target was 50%.
Residents argue that the wealth generated by LLDC is not used to help the community, leading to gentrification.
What did we find on the GIS map of Stratford, Olympic park to suggest a positive legacy?
Services offered suggest a positive legacy.
Victory Park outdooor gym + Gym group Stratford - exercise.
Green spaces - leisure, exercise.
Transport.
East Village Dental - healthcare.
Westfield + Vue Cinema - entertainment, socialising, jobs.
Independent businesses like cafe/bars for socialising and jobs.
What did we find on the online reviews of the Olympic Park to suggest a positive legacy?
High rating suggests a positive legacy.
Average rating of 4.0 out of 5.0 with mainly good reviews from a wide range of the public.
Friendly staff.
Lots to see and do - Olympic stadium and venue, Westfield centre.
Very spacious.
Good transport links.
Well maintained.
Stated that it left a fabulous 2012 legacy.
What did we find on the online reviews of the Olympic Park to suggest a negative legacy?
Only 1 map so confusing.
Bad service/staff.
Very expensive - 2 ice creams cost £11.
Lots of concrete and scaffolding.
In our human fieldwork enquiry, which qualitative data collection methods did we use?
Annotated field sketch.
Questionnaire.
BBC news report.
Online reviews on TripAdvisor.
GIS online maps.
In our human fieldwork enquiry, which quantitive data collection methods did we use?
Questionnare.
Environmental quality survey.
Pedestrian count.
BBC news report.
Name some potential hazards associated with our human fieldwork.
Crowded urban area.
Speaking to strangers.
Busy road.
What is the risk and management of crowded urban area?
Risk - Getting lost or separated from the group in crowded areas.
Management - Wear high vis/school uniform, mobile phone to call for help, meeting point if lost.
What is the risk and management of speaking to strangers?
Risk - Speaking to strangers: verbal abuse, conflict, violence.
Management - Stay in groups, mobile phone to call for help, be wary about who we approach.
What is the risk and management of busy roads?
Risk - Getting run over.
Management - Cross at crossings, look both ways, stay away from the road.
Which 4 types of data presentation methods did we use during our human fieldwork enquiry?
Located bar graph.
Radar chart.
Word cloud.
Bar graph.
Which data presentation method did we use to present our pedestrian count?
Located bar graph.
Explain if the results from the pedestrian count suggest a positive or negative legacy.
Across all 3 sites the Olympic Park was quite busy with around 10 people per minute, suggesting a positive legacy.
We used a located bar graph to plot our pedestrian count. State the advantages of this.
Allows us to visualise the location.
Easily compare sites.
We used a located bar graph to plot our pedestrian count. State the disadvantages of this.
No scales to see distance between sites.
No scale on bars.
Bars can cover key landmarks or multiple sites.
Difficult to see accurate locations.
Which data presentation method did we use to present our environmental quality survey?
Radar chart.
Explain if the results from the environmental quality survey suggest a positive or negative legacy.
Suggests a positive legacy because it is well looked after with little graffiti and litter but lots of green spaces.
We used a radar chart to represent our environmental quality survey. State the advantages of this.
Clearly shows positive or negative legacy based on size of radar.
Easy to compare sites.
We used a radar chart to represent our environmental quality survey. State the disadvantage of this.
Layers overlapping can make it difficult to read information.
Which data presentation method did we use to present our open questionnnare?
Word cloud.
In our human fieldwork enquiry, which words appeared the most and were the biggest/boldest?
Clean, quiet, green spaces.
Explain if the results from the questionnaire suggest a positive or negative legacy.
Suggests a positive legacy as most people used words like clean, quiet and green space to describe the Olympic park. It was also rated very accessible, the environment is clean and it’s safe for people to live in, showing that it is well cared for.
We used a word cloud to represent our questionnaire. State the advantages of this.
Clearly compare words due to size.
Less important words easily excluded.
More frequently said words appear bigger and bolder.
We used a word cloud to represent our questionnaire. State the disadvantages of this.
Phrases have more than one word so are separated.
Some words require context as they may have been said in a positive or negative way.
Different words with the same or similar meaning come up twice such as beautiful and pretty.
We used a bar graph to represent our questionnaire. State the advantages of this.
Clear scale.
Different categories are plotted.
Colour coded.
We used a bar graph to represent our questionnaire. State the disadvantage of this.
Too many bars can lead to it being difficult to read.
In terms of accuracy, what were the strengths of our human fieldwork enquiry?
All methods easy to carry out with pens/pencils/paper/stopwatches so no specialist equipment is needed.
Questionnaire designed to be easy to respond to and understand - no specialist equipment.
In terms of accuracy, what were the weakenesses of our human fieldwork enquiry?
Miscounting in the pedestrian count.
In terms of reliability, what were the strengths of our human fieldwork enquiry?
Repeated measurements for pedestrian counts to find a class average and eliminate anomalies.
Multiple questionnaires.
3 different sites - residential, tourist, mixed use.
In terms of reliability, what were the weaknesses of our human fieldwork enquiry?
Time of day - Monday afternoon where most people were at work.
EQS and field sketch only captured one angle.
How could our results that the regeneration scheme did leave a positive legacy be explained?
The London legacy Development Corporation (LLDC) was set up after the 2012 Olympics to ensure a positive legacy was left behind.