Stats 5 - Sampling, Central Limit Theorem, and NHST
1/23
There's no tags or description
Looks like no tags are added yet.
Name | Mastery | Learn | Test | Matching | Spaced | Call with Kai |
|---|
No study sessions yet.
24 Terms
Sampling error
An inevitable difference between the characteristics of the entire population and the characteristics of any sample used to estimate the population
Sampling bias
When a sampling process does not produce a representative sample of the population
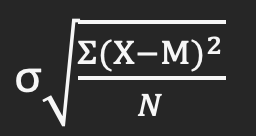
Distribution of sample means
The distribution of all the possible means of all possible samples of a given sample size; allows you to compare how well the mean of any random sample (μ) of a specific size resembles the population mean (μ)
What is the symbol σ used for?
Represents the population standard deviation
What is the symbol μ used for?
Represents the population mean
Standard error
The standard deviation of the distribution of sample means; offers a more precise way to describe the variability of the distribution of sample means
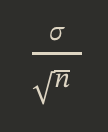
Why do we divide the population standard deviation by a square root of the sample size to get SE? Why not just use σ for the distribution of sample means’ spread?
We divide the population standard deviation by a square root of the sample size because we want to measure the spread of the sampling distribution means, not just the spread of a single sample
Central Limit Theorem (CLT)
Indicates that the distribution of sample means is roughly normally distributed as long as the sample sizes are sufficiently large and the data don’t have dramatic skew or outliers
What is the smallest possible sample size that the CLT math “works”?
n=30
Why is the CLT important for conducting inferential statistics?
Because is allows us to apply the rules of the normal curve to the distribution of sample means, it will allow us to use NHST
What is Null Hypothesis Significance Testing?
It is a technique used to determine if your data support your research hypothesis
What is statistical significance?
The probability of obtaining test results as extreme as the results actually observed, under the assumption that the null hypothesis is true
How do p values relate to statistical significance?
The p-value helped us determine the exact probability of obtaining test results as extreme as the results actually observed. The p value on a normal curve helps us to determine the cutoff for statistical significance. Usually, we want p≤0.05.
What is the appropriate wording for drawing a conclusion based on NHST?
We reject the null hypothesis/we fail to reject the null hypothesis
What is a null hypothesis?
Claim that the effect being studied does not exist; there is not a relationship between IV and DV
What is an alternative hypothesis?
Statement that there is a statistically significant effect/difference/relationship between variables in a population
What is the difference between a directional vs. nondirectional alternative hypothesis? Which is more common?
A directional hypothesis states that the experimental group will be higher or lower in the DV at the end of the experiment
A nondirectional hypothesis is more common and simply states that the two groups will simply be different
How do we define the threshold for significance in NHST?
Defined by a predetermined alpha level, which is the probability of Type I error (falsely rejecting the null hypothesis)
If p < 0.05 is selected, how does this relate to relative frequency in the upper and lower tails of our distribution?
A p < 0.05 means that the outermost 5% of our tails is the rejection region for our null hypothesis
Which tailed tests do we use for which hypotheses?
One-tailed for directional
Right for when we expect our experimental group to be higher than our control group
Left for when we expect our experimental group to be lower than our control group
Two-tailed for nondirectional
What is a rejection region? How does it relate to the tails of a distribution?
Where values are considered statistically significant and unlikely to occur by chance if the null hypothesis were true.
Conceptually, how do we define the test statistic?
Number that is derived via formula for different statistical tests and used to derive a p value; measures how much the sample results deviate from what is expected if the null hypothesis were true
Test statistic/z test formula

Distribution of sample means formula