BIOL2300 ch. 1-5
1/60
There's no tags or description
Looks like no tags are added yet.
Name | Mastery | Learn | Test | Matching | Spaced | Call with Kai |
|---|
No analytics yet
Send a link to your students to track their progress
61 Terms
statistics
the study of methods for measuring aspects of populations from samples and for quantifying the uncertainity of the measurements
population
all the individual units of interest
sample
subset of units taken from the population
parameter
true value that describes an entire population; absolute “truth”
estimate
an approximation of the parameter
always subject to error because it doesn’t include every individual in the population
random sample
each member of a population has an equal and independent chance of being selected
minimizes bias; makes it possible to calculate amount of sampling error
sample of convenience
a collection of individuals that are easily available to the researcher
sampling error
the natural, unavoidable difference (due to chance) between an estimate and the population parameter being estimated
reducing sample size decreases precision
bias
a systematic discrepancy between the estimates
list 4 types of bias
volunteer bias
survivorship bias
recall bias
observer bias
accuracy
how close an estimate is to the true value (parameter)
precision
how consistent/reproducible measurements are from one sample/measurement to another
sampling variability affects precision
categorical data
qualitative characteristics of individuals (non-numerical)
what are the 2 types of categorical data?
nominal
ordinal
nominal
no inherent order (categorical)
ordinal
inherent order (categorical)
numerical data
quantitative measurements (numerical values)
what are the 2 types of numerical data?
discrete
continuous
discrete, provide examples
indivisible units (numerical)
i.e. # of teeth; # of siblings; # of vehicles
continuous, provide examples
any real number within a range (numerical)
i.e. height, weight, temperature
absolute frequency distribution (n)
the count of observations in each category/interval
example of absolute frequency distribution
Ex. absolute frequency of age surveyed across students in a class;
Age 19: 37 students
Age 22: 5 students
relative frequency distribution (f) or (p)
the proportion/percentage of observations in each category/interval
example of relative frequency distribution
Ex. relative frequency of age surveyed across students in a class
Age 19: 40.7% of students
Age 22: 5.5% of students
experimental study
researcher assigns treatments randomly
observational study
assignments not made by researcher
confounding variable
masks/distorts the causal relationship between measured variables in a study
example of confounding variable
E.x. Coffee consumption and the incidence of lung cancer (does not actually cause lung cancer, smoking does)
how should categorical data be displayed?
frequency table
bar graph
how should numerical data be displayed?
frequency table
box plot
histogram
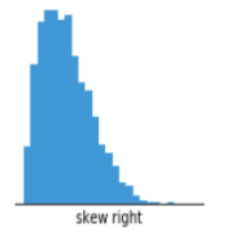
positive skew (right-skewed)
mean > median
long tail on right side
negative skew (left-skewed)
mean < median
long tail on left side
how should relative frequency be displayed?
bar graph
pie chart
what should be used to visualize the association between categorical variables and compare their frequencies?
contingency table
how should the association between categorical variables be displayed?
grouped bar
mosaic plot
how should the association between numerical variables be displayed? label the axes
scatter plot
x-axis: explanatory variable
y-axis: response variable
how should the association between categorical and numerical variables be displayed?
strip chart
violin plot
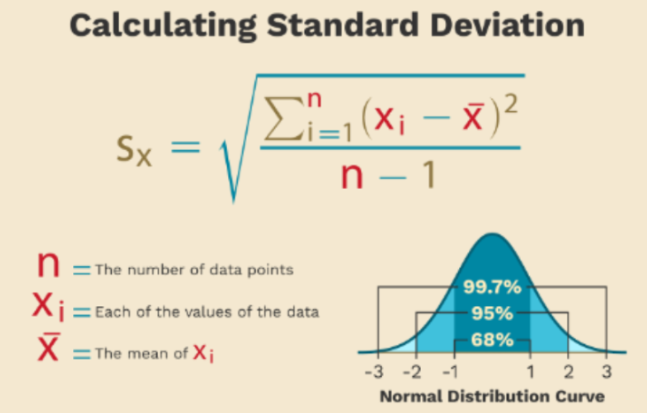
normal distribution (histogram)
symmetric bell-shaped distribution
mean/median/mode are very similar
does not show percentiles
mean
the average value; typical value
median
middle value when data is ordered least to greatest
standard deviation (SD)
how spread out the data is around the mean; spread of individual observations
Never negative
The sum is zero
SD = Square root of variance
mode
value that appears most frequently in a data set
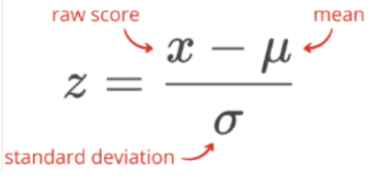
z-score
indicates how many standard deviation a value is above or below the mean
paired/dependent observations
data collected multiple times from the same individuals
positive association
two variables move in the same direction (both increase or both decrease)
negative association
two variables move in opposite directions
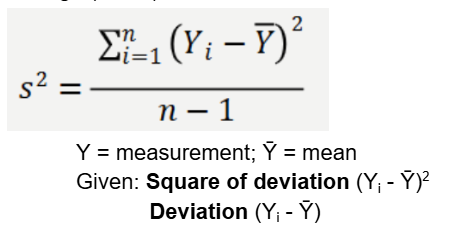
variance
a numerical measure of how spread out a set of data points is around their average (mean)
coefficient of variation (CV)
the standard deviation (SD) expressed as a percentage (%) of the mean
SD/mean * 100
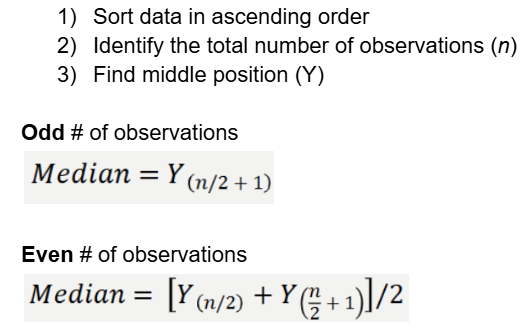
how to find median in a data set
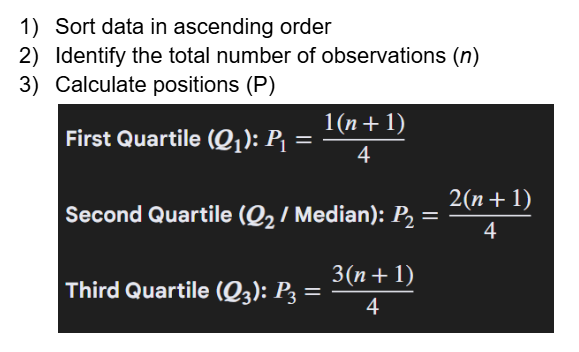
quartiles
values that partition the data into quarters
interquartile range (IQR)
difference between the 3rd (Q3) and 1st (Q1) quartile of the data
spans 50% of the data
how to find IQR in a data set
features of box and whiskers plot
shows max/min, median, skewness, spread of data, quartiles, and interquartile range
cumulative relative frequency (%) or (N)
how many observations are less than or equal to a given value
how to calculate cumulative relative frequency for a data set
Order data from smallest to largest
Start with first frequency; add frequencies and sum
how to calculate the proportion of observations in a given category for a data set?
the most important descriptive statistic for a categorical variable
# of observations in category/total # of observations
sampling distribution
describes how an estimate varies across repeated samples from the same population
as # of observations increases, the spread (and uncertainty) decreases
is less variable than the distribution of individual observations
standard error (SE)
measures the uncertainty of an estimate
reflects precision of estimate
as sample size increases, the standard error of mean decreases
confidence interval
a range of values surrounding the sample estimate that is likely to contain the population parameter
captures the true mean in 95% of repeated samples
2SE rule
a rough approximation of the 95% confidence interval for a mean can be calculated as the sample mean +/- 2 standard errors (SE)
error bars
lines on a graph extending outward from the sample estimate to show uncertainty about the value of the parameter being estimated
displays uncertainty, not spread of data