3.5 Profitability and Liquidity Ratio Analysis
1/12
There's no tags or description
Looks like no tags are added yet.
Name | Mastery | Learn | Test | Matching | Spaced |
|---|
No study sessions yet.
13 Terms
The need for ratios
•To examine the profitability of the firm.
•To find out the ability of the firm to meet its debts (liquidity).
•To see how efficiently the managers of the firm uses its resources.
•So that investors in the firm can see the returns on their investment.
types of financial ratios
profitability ratios
efficiency ratios
liquidity ratios
profitability ratios
profit in relation to other figures like ratio of profit to sales revenue
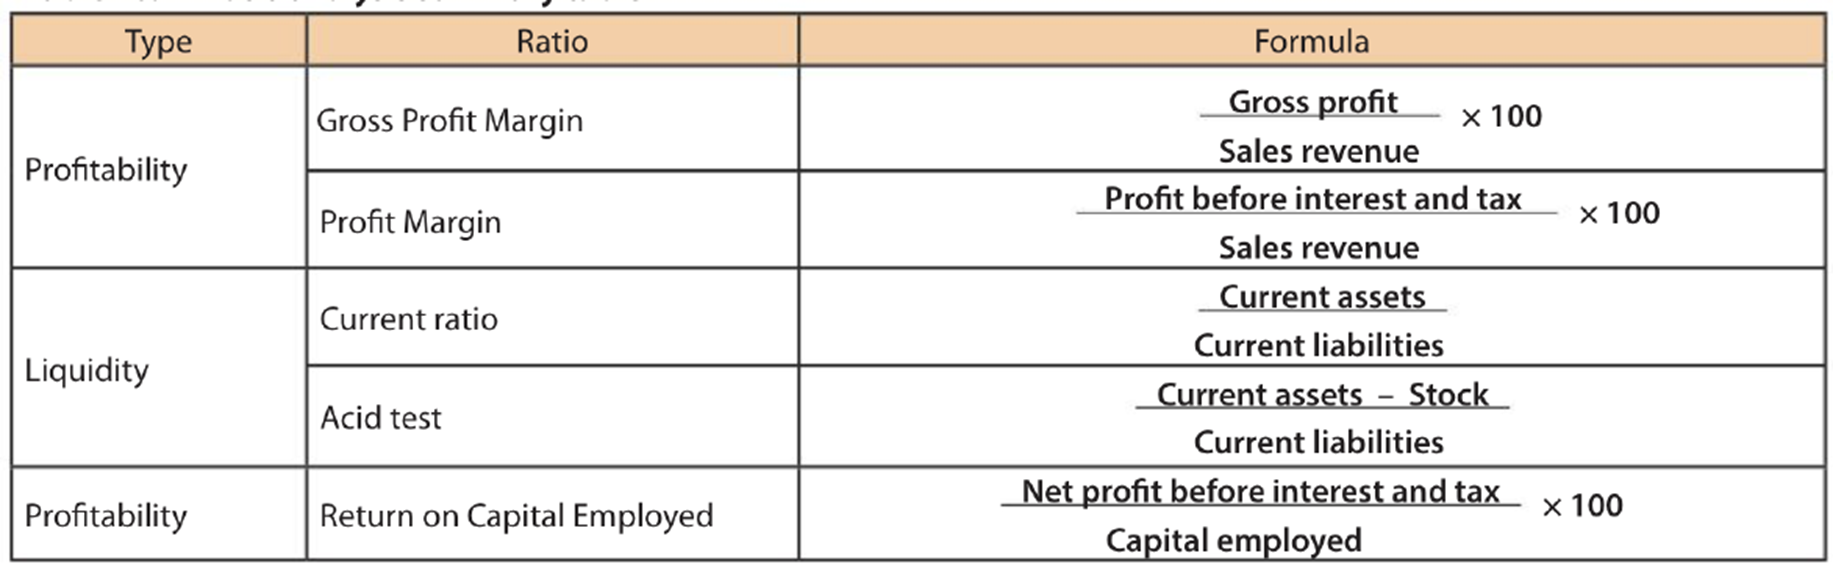
Profitability Ratios: Gross Profit Margin
•Shows gross profit as a percentage of sales
GPM = Gross Profit X 100
Total sales revenue
•Does not show the impact of overheads on profits.
•Shows how well a firm has performed in financial terms.
Profitability Ratios: Net Profit Margin
•Shows net profit as a percentage of sales.
NPM = Net profit before int. and tax x 100
Total sales revenue
•Should be compared with previous period or with similar business
Efficiency Ratios
•Shows how well a firm’s resources have been used, such as the amount of profit generated from the available capital used by the business.
•Ex. Firm A and B generate the same profit but Firm A used less capital than Firm B. Firm A has a greater return than Firm B.
•See table 3.5 a (page 273)
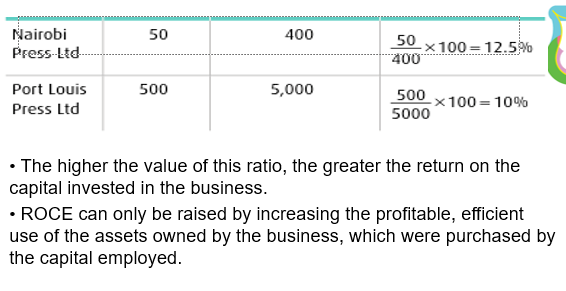
return on capital employed ROCE
net profit before tax & interest / total capital employed x 100
roce chart
•Larger figures indicate higher profitability
•Must be compared with previous year or similar firm to be meaningful.
Liquidity Ratios
•Measure the indebtedness of the firm.
•Assess the ability of the firm to pay its short-term debts.
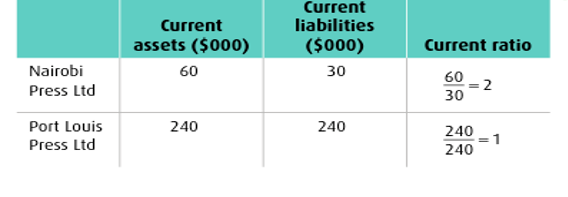
•Current Ratio = Current Assets
Current Liabilities
•Expressed as a ratio (ex. 3:1)
•Not expressed as a percentage!
•Ideal value = 1.5:1 or 2:1
current ratio
•Nairobi is in a more liquid position than Port Louis
•Nairobi = for every $1 of ST debt it has $2 of current assets to pay for them (relatively safe position)
•Port Louis only has $1 of current assets to pay for each $1 of ST debt
•Could be in trouble if ST creditors demanded repayment at the same time
•Current ratio results over 2 might suggest that too many funds are tied up in unprofitable inventories, debtors and cash and would be better placed in more profitable assets, such as equipment to increase efficiency.
•Suggests the firm is not making full use of its current assets (eg. cash idle in a bank a/c)
•Debtors credit policy is too loose
•Too much stock being held
Acid Test Ratio (or quick ratio)
•Does not treat stocks as liquid assets
•
Acid Test Ratio = Current Assets – stocks / Current Liabilities
•A value of 1:1 is considered acceptable
•Profitability Ratios:
•Gross Profit Margin (GPM)
•Net Profit Margin (NPM)
•Liquidity Ratios:
•Current Ratio
•Acid Test (Quick Ratio)
•Efficiency Ratio:
•ROCE (Return on Capital Employed)
Ratio analysis 3 formulas