150A Midterm studyguide
1/141
There's no tags or description
Looks like no tags are added yet.
Name | Mastery | Learn | Test | Matching | Spaced | Call with Kai |
|---|
No analytics yet
Send a link to your students to track their progress
142 Terms
Is a Disease Associated with an Exposure?
Must determine whether there is a greater risk of the disease in persons who have been exposed to certain agent than persons not exposed
Data from case-control and cohort study designs most frequently used
Both case-control and cohort studies are designed to determine whether there is an association between exposure and disease by making comparisons; and assessing the magnitude of the association
Estimating Risk
Defined as the probability of an event occurring (such as development of disease or death over a specified observation window)
Objective of most study designs in epidemiology is to determine whether there is an increased risk (e.g., incidence) or decreased risk of a certain disease in association with a certain exposure or other characteristic
I am going to focus on incidence for the examples here— prevalence is thorny. Researchers are usually interested in things that cause onset or acquisition of disease. Prevalence is affected by this, but can also be affected by disease duration.
Absolute Risk
Incidence of disease (mortality)in a population
Can indicate magnitude of risk in a group of people with a certain exposure BUT does not take into account the risk of disease in non‐exposed individuals
Does not stipulate any explicit comparison
Comparison is fundamental to epidemiology
Measures of Association
Calculated in two ways
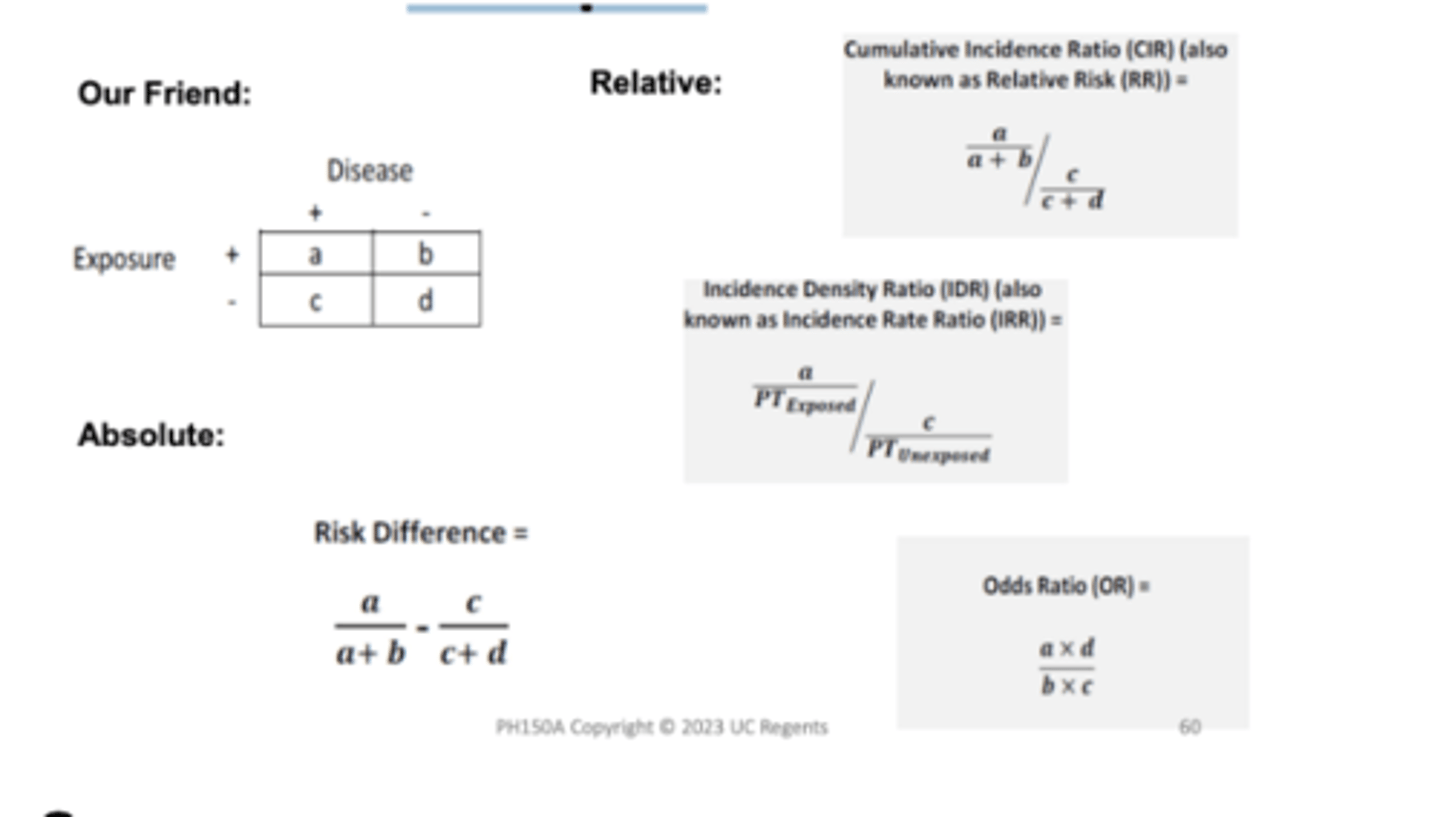
Difference in absolute risks (incidence or death) = absolute measure
Subtraction
Ratio of absolute risks (incidence or death) = relative measure
Division
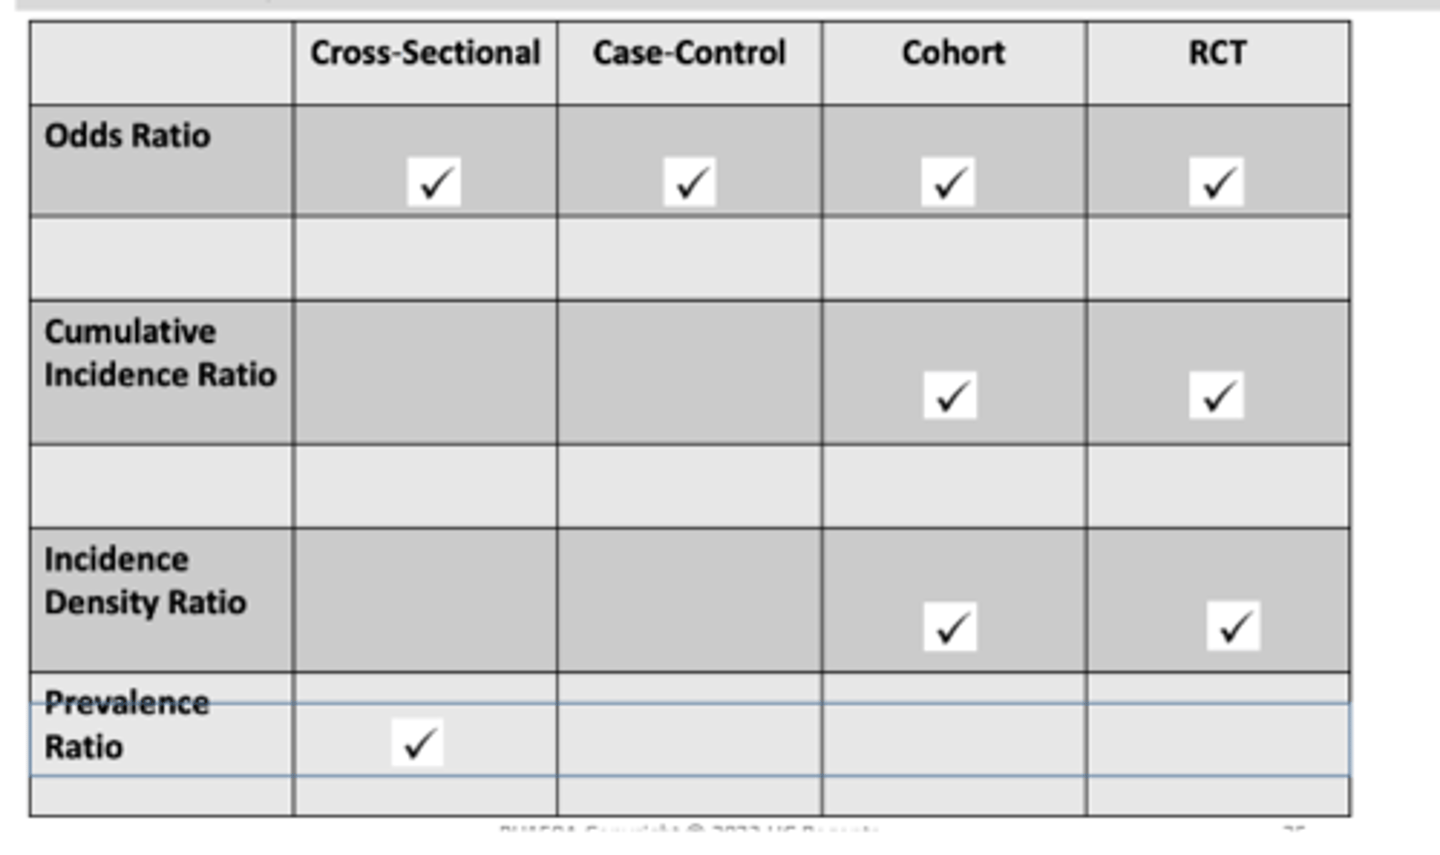
Summary of Measures of Association: Relative Risk
Incidence density ratio
cumulative incidence ratio
odds ratio
Incidence density ratio (IDR)
Relative rate; Rate ratio = ID exposed/ID nonexposed
Interpretation: The rate of {outcome} in the {exposed} is {#} times the rate in the {unexposed}.
Cumulative incidence ratio (CIR)
Relative Risk; Risk ratio = CI exposed/CI nonexposed
Interpretation: The risk of {outcome} in the {exposed} is the {#} times the risk in the {unexposed}.
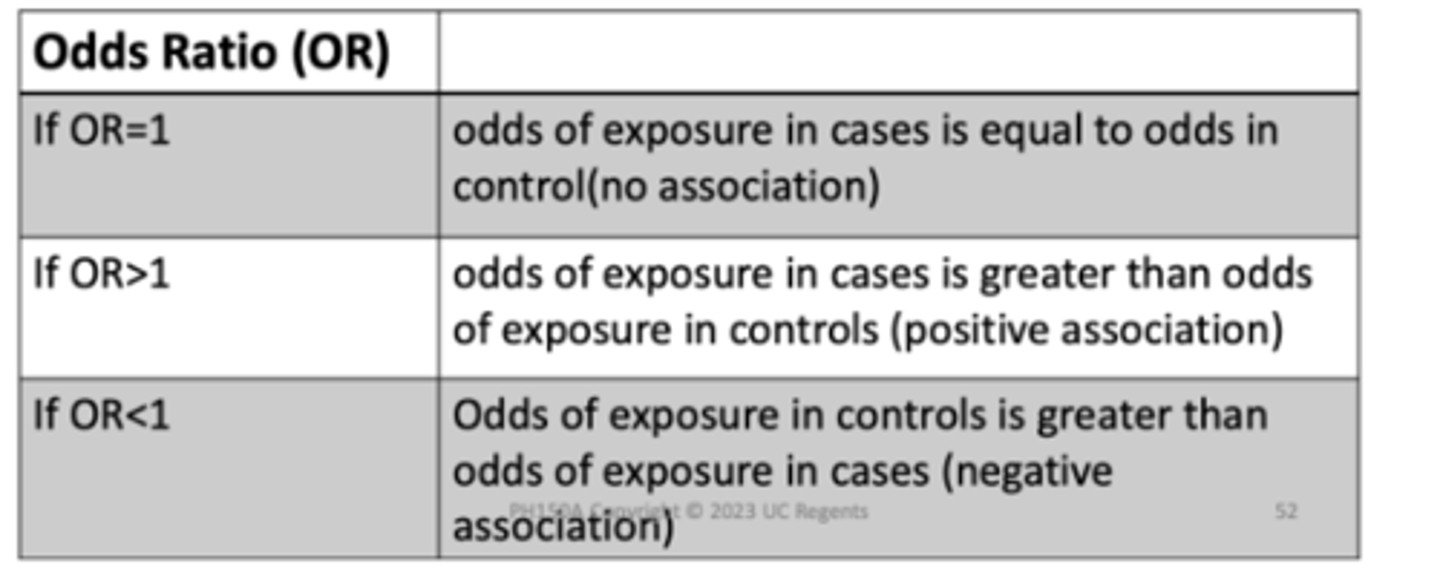
odds ratio (OR)
Odds exposure diseased/ Odds exposure not diseased
AD/BC
If OR = 1
Odds of exposure in cases = odds in control (no association)
If OR > 1
Odds of exposure in cases > odds of exposure in controls (positive association)
If OR < 1
Odds of exposure in controls > odds of exposure in cases (negative association)
types of relative risks
Cumulative Incidence Ratio (CIR or Risk Ratio)
Incidence Density Rate Ratio (IDR or Rate Ratio
Cohort study
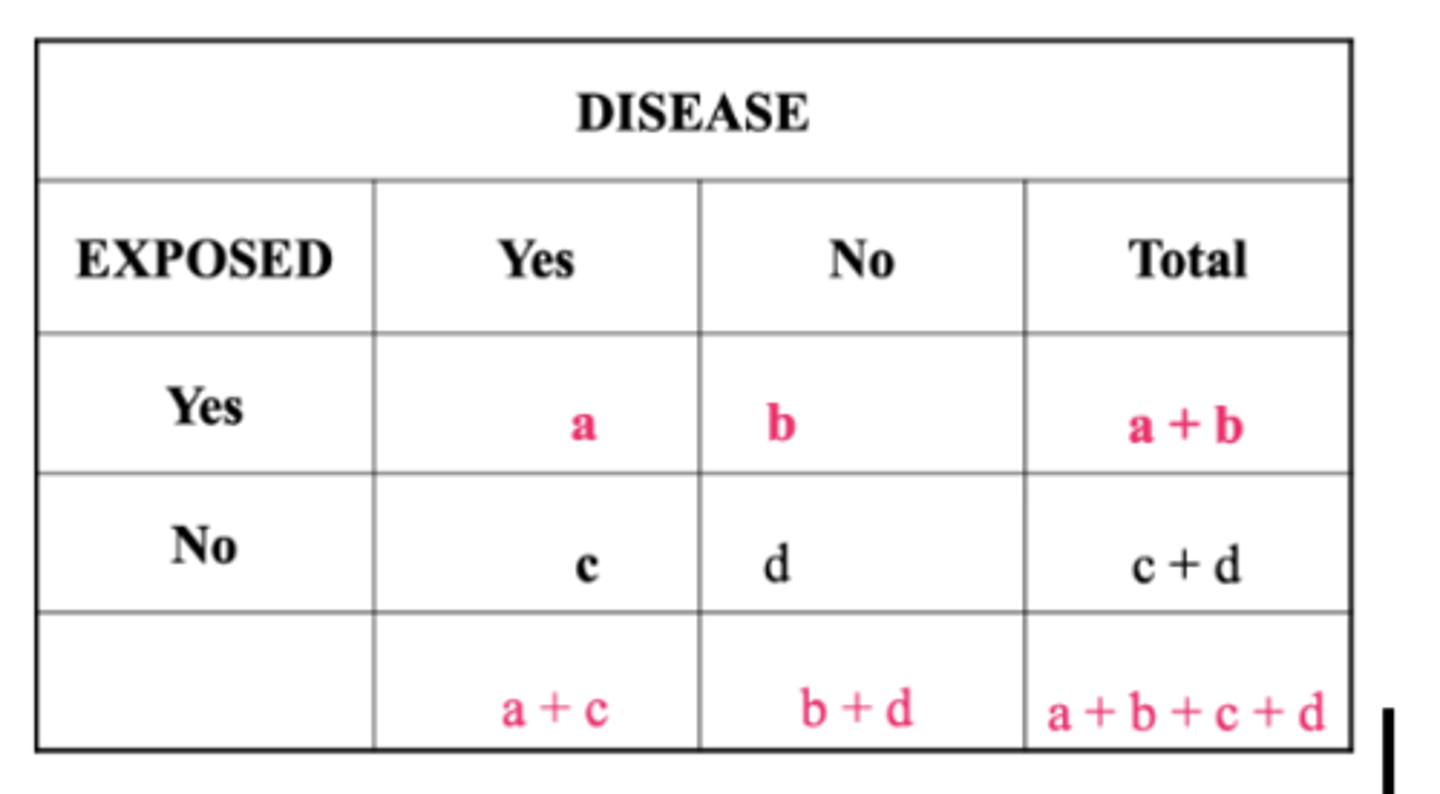
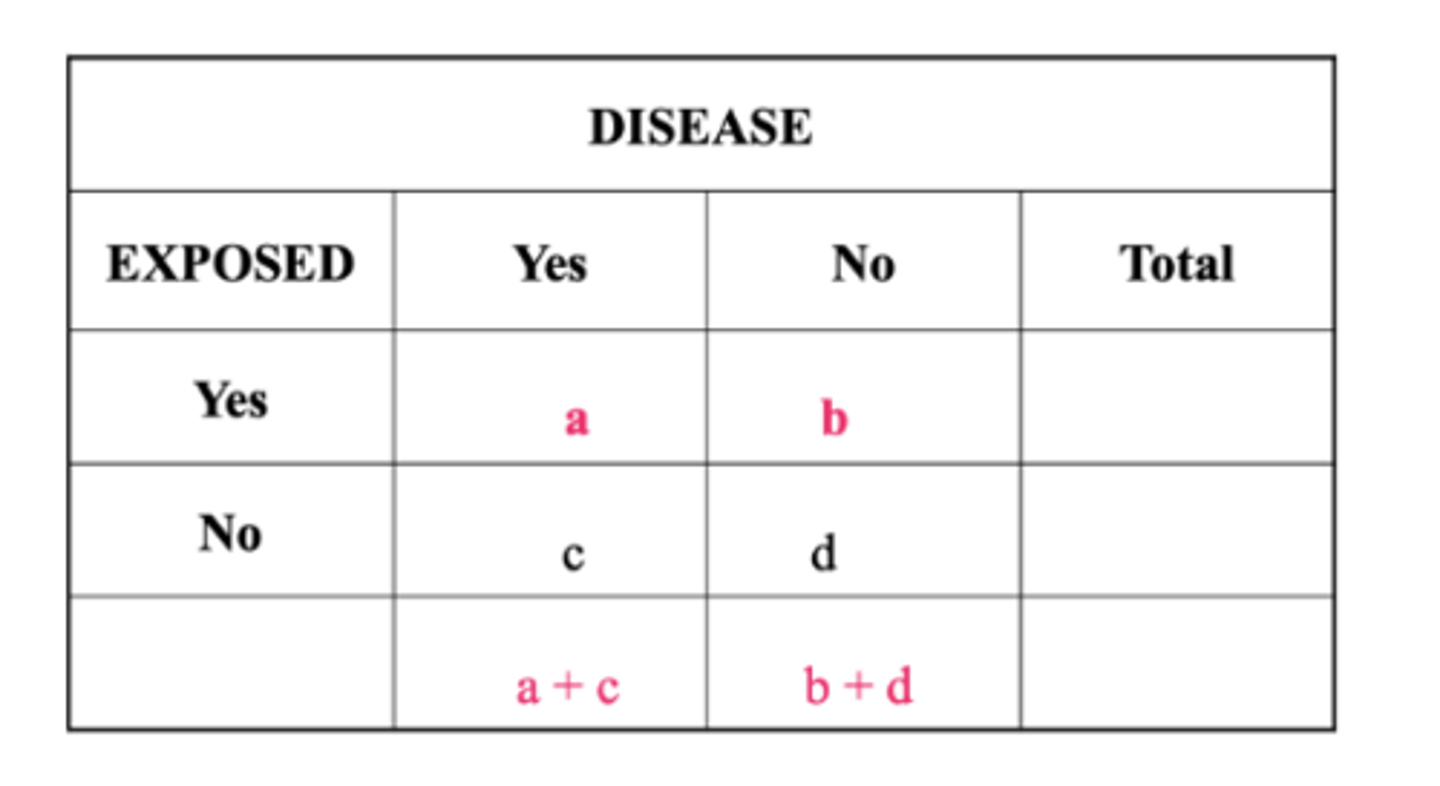
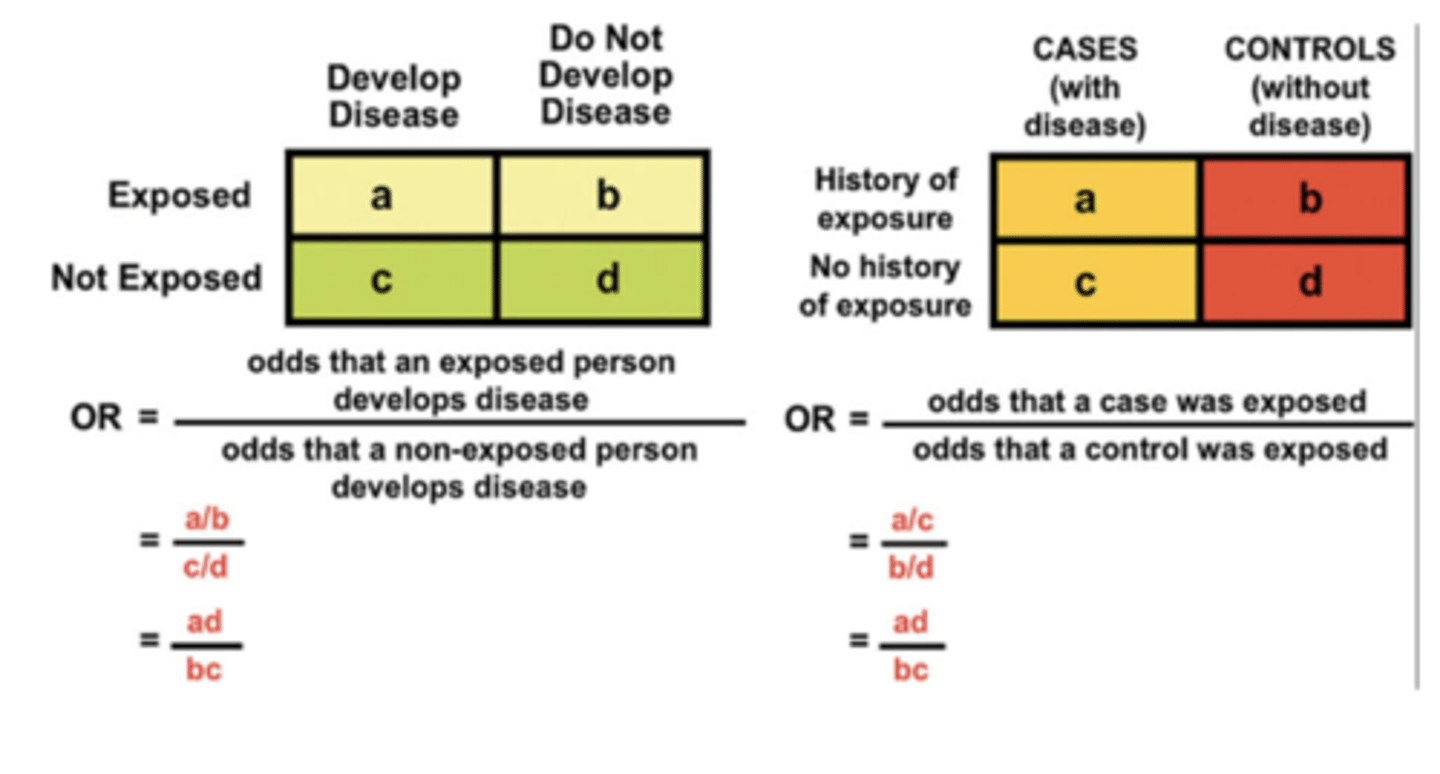
Our Friend the 2x2 Table
Important Measures for Evaluating Disease Impact
Absolute risk
Absolute risk (probability of disease or death in total population, or Cumulative Incidence in total population)
incidence of disease in the total population
A + C / (TOTAL)
does not indicate if exposure is associated with risk of disease (or death)
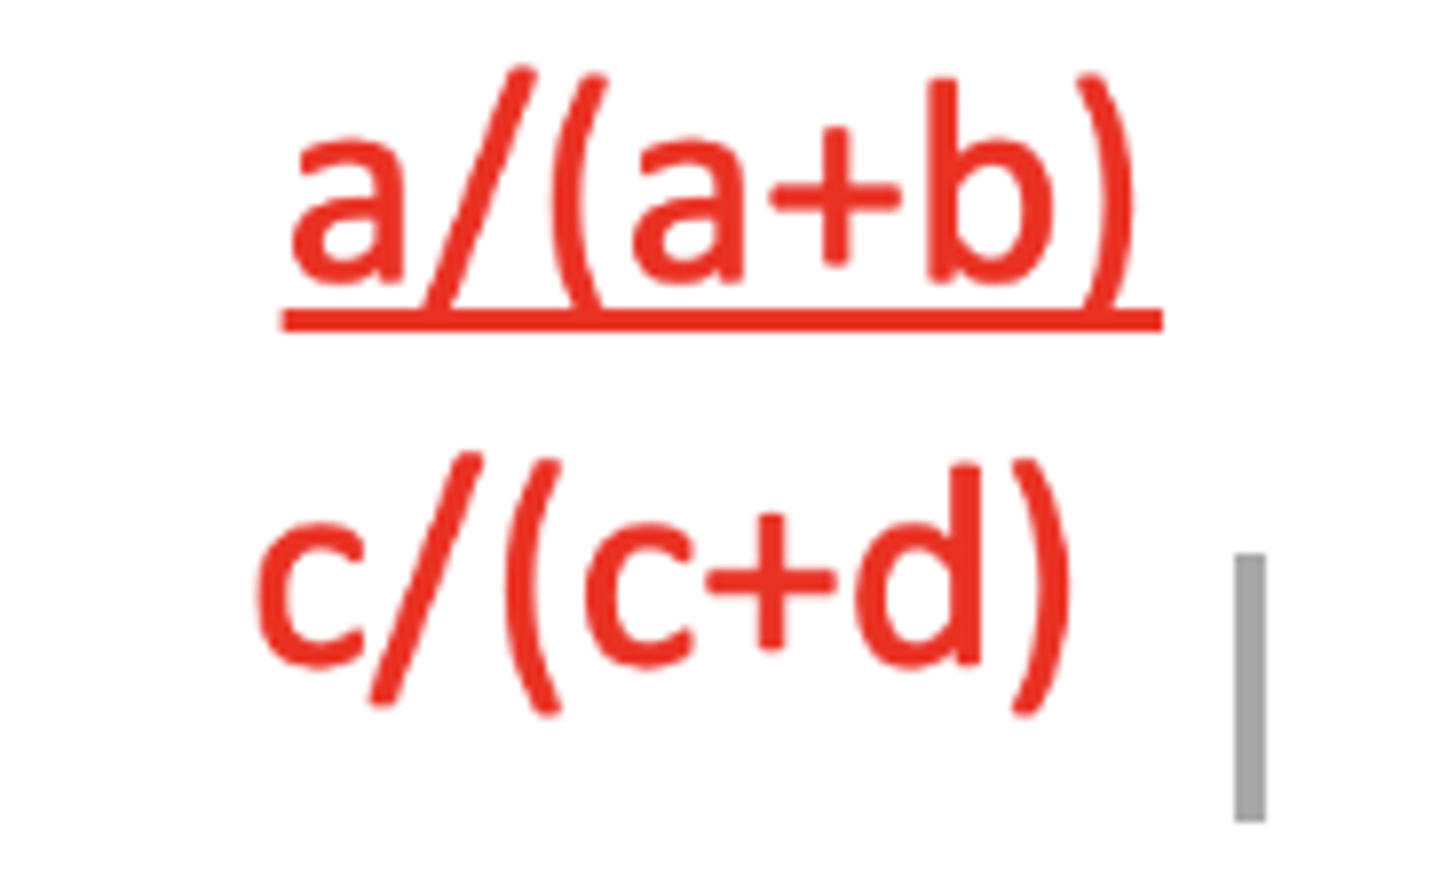
Estimating Relative Risk - Ratio of Risks
Incidence of disease among exposed persons
a /(a + b) where "a" represents cases of disease in exposed persons, a + b
Estimating Relative Risk - Ratio of Risks
Incidence of disease among unexposed persons
c /(c + d) where "c" represents cases of disease in unexposed persons, c + d
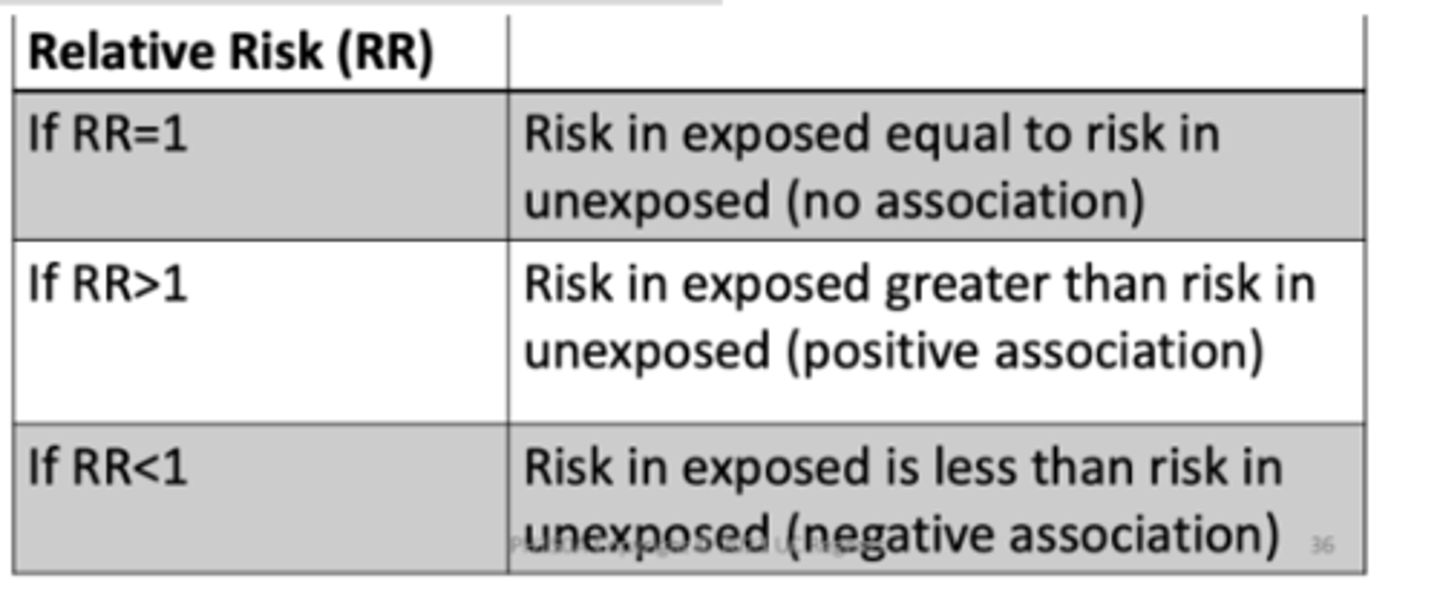
Relative risk ratio
incidence in exposed /incidence in unexposed
Is There an Association? RR
In the hypothetical example, RR=1.61, thus the risk of cancer among cellphone users is 1.61 times the risk of cancer among non‐cellphone users. Another interpretation is that the risk of cancer among cellphone users is 61% higher the risk of cancer among non‐cellphone users
Estimating Relative Risk: Case‐Control Study
Cannot estimate risk of disease directly from case‐control study
To directly estimate disease risks must have values for incidence of disease in exposed and incidence in the non‐exposed
In a case‐control study, we start with disease (cases) and non‐diseased (controls) individuals
Question asked in Case‐control Study: "What are the odds that a case was exposed?"
Understanding Odds
Odds = number of times event occurred /number of times event did not occur
probability of event occurring (p) /probability of event not occurring (1-p)
Odds vary from 0 [nobody has the event—zero in the numerator] ...
...to infinity [everyone has the event—zero in the denominator]
Estimating Risk from a Case‐control Study
Can calculate an exposure odds ratio
odds of exposure in diseased individuals/ odds of exposure in control individuals
= (a/c) / (b/d) = (ad) / (bc)
Odds (disease|exposure) (exposure|disease)
a/b and c/d
a/c and b/d
OR Interpretation
In the hypothetical example, OR=1.62, thus the odds of cellphone use among those with cancer are 1.62 times the odds of cellphone use among those without cancer. Another interpretation is that the odds of cellphone use among those with cancer are 62% higher than the odds of cellphone use among those without cancer.
If OR = 1
There are the same number of cases that are exposed as controls that are exposed.
If OR>1
There are more pairs in which the case were exposed, and the controls were not relative to pairs in which the control was exposed, but the controls was not (cases had exposure more often)
If OR<1
There are more pairs in which the controls was exposed and the case was not relative to pairs in which the case was exposed by the control was not (control exposed more often)
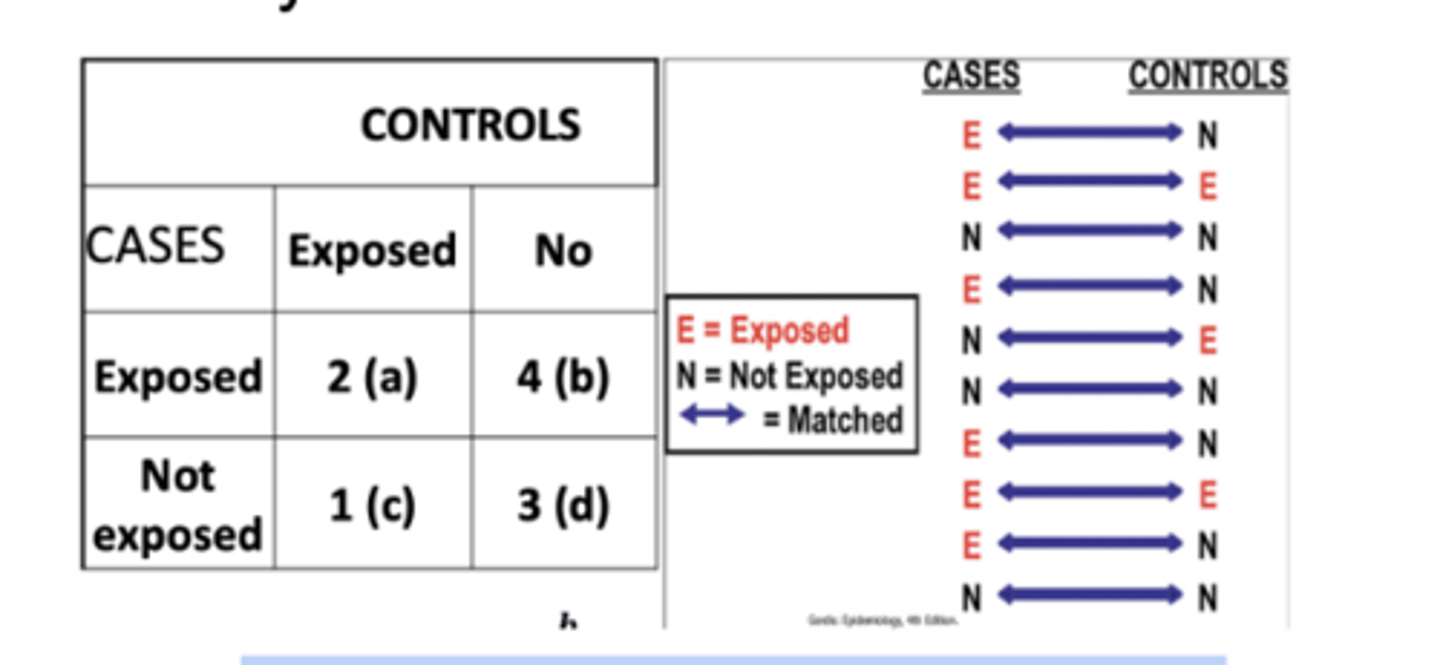
Calculating Odds Ratios in Matched-Pairs Case-Control Studies
Controls are selected by matching each one to a case according to variables that are known to by related to disease risk, i.e. age, sex, race/ethnicity
Results are then analyzed in terms of case‐control pairs rather than for individual subjects
With exposures classified as dichotomous (exposed versus non‐exposed), four types of case ‐control pairs are observed
Pairs may be concordant or discordant with regard to exposure
Types of Pairs in Matched Case‐ control Study
Concordant Pairs
1. Pairs in both the cases and the controls were exposed
2. Paris in which neither the case nor the control was exposed
Types of Pairs in Matched Case‐ control Study
Discordant Pairs
1. Pairs in which the case was exposed but the control was not
2. Pairs in which the control was exposed and the case was not
Summary 2x2 Table: Matched Case‐ control study
Matched pairs odds ratio = b/c
Depression
1 in 6 adults will have depression at some time in their life
Each year ~16 million American adults experiencing depression
More on Symptoms
Persistent sad, anxious, or "empty" mood
Feeling irritable, easily frustrated, or restless
Feelings of guilt, worthlessness, or helplessness
Not wanting to do activities that used to be fun
Decreased energy or fatigue
Moving or talking more slowly
Difficulty concentrating, remembering details, or making decisions
Difficulty sleeping, early‐morning awakening, or oversleeping
Appetite and/or weight changes
Thinking about suicide or hurting yourself
Aches or pains, headaches, cramps, or digestive problems without a clear physical cause and/or that do not ease even with treatment
Diagnosis & Treatment of Depression
In the US, mental disorders are commonly diagnosed using the Diagnostic and Statistical Manual of Mental Disorders (DSM-5), which is published by the American Psychiatric Association.
There are many effective treatments for depression based on the severity. They include:
Psychosocial therapy such as cognitive‐behavioral, interpersonal or problem‐solving
Psychosocial support
Anti‐depressant medication
Depression= major depressive disorder=clinical depression
Common and serious mood disorder
Characterized by experiencing persistent feelings of sadness and hopelessness and losing interest in activities one once enjoyed.
The DSM‐5 outlines the following criterion to make a diagnosis of depression. The individual must be experiencing five or more symptoms during the same 2‐week period.
Depressed mood most of the day, nearly every day.
Markedly diminished interest or pleasure in all, or almost all, activities most of the day, nearly every day.
Significant weight loss when not dieting or weight gain, or decrease or increase in appetite nearly every day.
A slowing down of thought and a reduction of physical movement (observable by others, not merely subjective feelings of restlessness or being slowed down).
Fatigue or loss of energy nearly every day.
Feelings of worthlessness or excessive or inappropriate guilt nearly every day.
Diminished ability to think or concentrate, or indecisiveness, nearly every day.
Recurrent thoughts of death, recurrent suicidal ideation without a specific plan, or a suicide attempt or a specific plan for committing suicide.
at least one of the symptoms should be either (1) depressed mood or (2) loss of
How Do We Get Data on Mental Health?
The Substance Abuse and Mental Health Services Administration (SAMHSA) is the agency within the U.S. Department of Health and Human Services that leads public health efforts to advance the behavioral health of the nation. SAMHSA's mission is to reduce the impact of substance abuse and mental illness on America's communities.
National and state‐level data
Tobacco, alcohol, illicit drugs
NSDUH began in 1971, annual
50 states and the District of Columbia
Ages 12 and older
WHO Mental Health Action Plan 2013-2030 (4 objectives)
Strengthen effective leadership for mental health
Comprehensive, integrated mental health care
Implement strategies for promotion and prevention
Strengthen information systems, evidence, and research
Leaders Care to Prevent Risks
Recurrent depressive disorder
People with depressive episodes experience sadness, reduced energy, feelings of guilt or low self‐ worth for at least 2 weeks
Episodes can be categorized as mild, moderate or severe
Persistent depressive disorder
Depression lasting for at least 2 years (may have periods of less severe symptoms)
Bipolar affective disorder
Consists of both manic and depressive states separated by periods of normal mood
Manic episodes involve elevated mood and over‐activity
Depressive episodes are similar to the unipolar depression
Postpartum depression
Full‐blown major depression during pregnancy or after delivery
Seasonal affective disorder
Onset of depression during the winter months when there is less natural light
Risk Factors for Depression
Major risk factors include: • family history • major life events, trauma or stress • Certain physical illnesses and medications
Measuring Depression
Patient Health Questionnaire is used to monitor the severity of depression (9 Qs)
Center for Epidemiologic Studies Depression Scale (CES‐D) is a screening test used to measure the depressiveness (20 Qs)
Global Trends of Depression
More than 332 million people live with depression around the world (5.7% of adults)
Depression is the leading cause of disability worldwide
It often starts at a young age and affects women more commonly than men
Significant barriers to treatment 1/3 ppl receive mental support
76‐85% of people in low/middle income countries receive no treatment for their disorders
Beyond Treatment: Daily Steps to Manage Feeling Blue Here are other tips that may help you or a loved one during treatment for depression:
Try to be active and exercise • Set realistic goals for yourself • Try to spend time with other people and confide in a trusted friend or relative • Try not to isolate yourself, and let others help you • Expect your mood to improve gradually, not immediately • Postpone important decisions, such as getting married or divorced, or changing jobs until you feel better Discuss decisions with others who know you well and have a more objective view of your situation • Continue to educate yourself about depression
Odds Ratio in Cohort Studies
Concept of odds can be applied to both cohort and case‐control studies
Event happening / Event not happening
In addition to addressing question of "what is the probability (p) that the disease will develop in an exposed person?", i.e., a/a+b, can also ask, "what are the odds that the disease will develop in an exposed person?", i.e,. a:b or a/b, and "..the odds that the disease will develop on an unexposed person", i.e., c:d?
Rare Disease Assumption
If incidence for the disease is low, then:
a+b ~ b
c+d ~ d
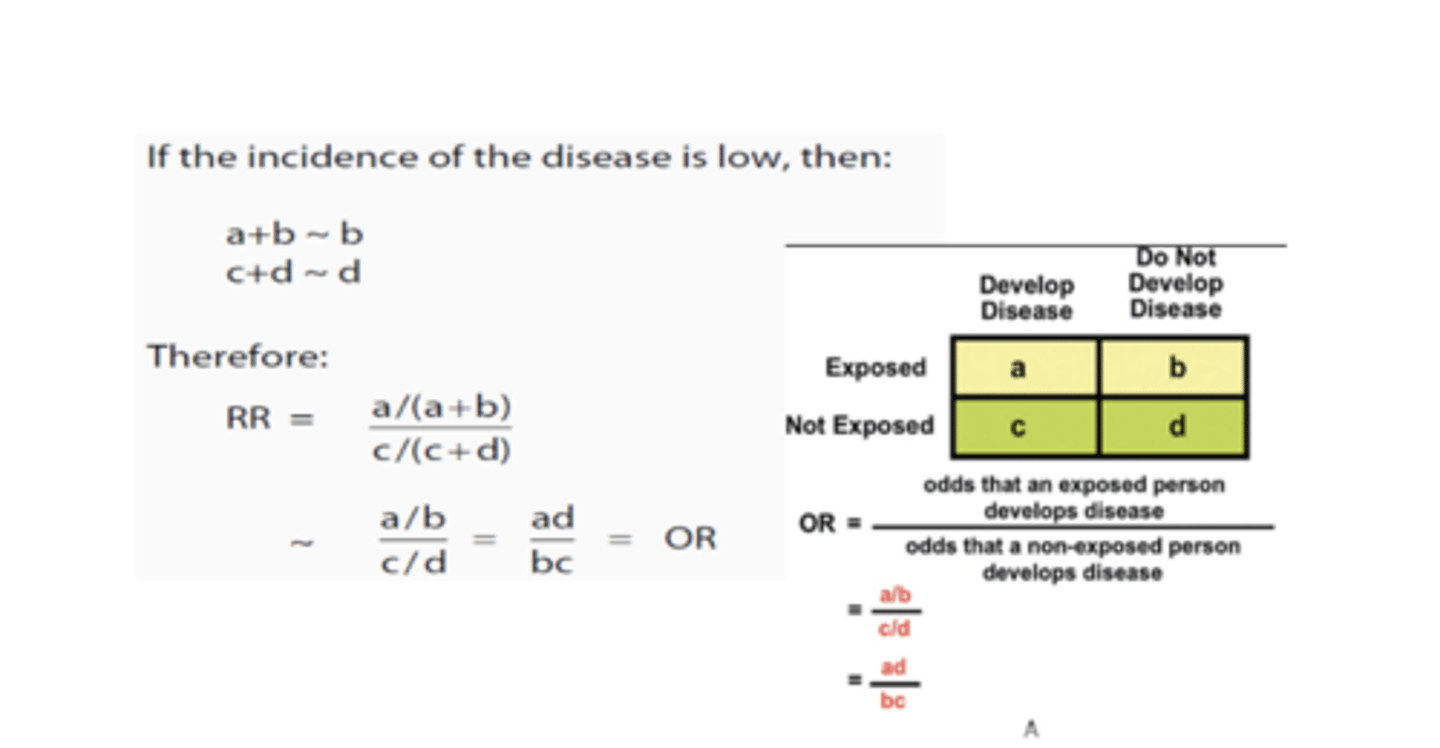
Odds Ratio=Relative Risk in Cohort Study: Rare Disease Assumption
A. Calculation of OR in a cohort study B. Calculation of OR in a case‐control study
When is the Odds Ratio a Good Estimate of the Relative Risk for a Case‐control Study?
When three conditions are met:
When cases are representative - with regard to exposure - of all people with the disease in the population from which the cases were drawn.
When controls are representative‐ with regard to exposure‐ of all people w/o the disease in the population from which the cases were drawn.
When the disease is rare (or does not occur frequently)
Summary Of Relative Measures of Association and Study Design
Statistical Significance
For relative measures of association, statistical significance is achieved if:
p‐value <0.05
Confidence interval does not include 1 (for a ratio)
Confidence interval does not include 0 (for difference)
"Statistical significance" signifies that the results would be unlikely (low probability—low p‐value) to have arisen due to chance
Example: Is a Disease Associated with an Exposure?
Association is present when the exposure occurs together with the outcome more often than chance
Association ≠ Causation (may be causal)
Statistical analysis is used to help interpret study results
Measures of Association
Relative risk measures
Strength of association
Disease etiology
Absolute measures of association
Potential impact of eliminating an exposure
Another Measure of Risk: Attributable Risk
Addresses the question, "How much of the disease that occurs can be attributed to a certain exposure?"
Defined: "Amount or proportion of disease incidence (or disease risk) that can be attributed to a specific exposure"
Measure of "impact"
AR implies not all of the disease incidence is due to a single specific exposure, as disease develops in some non‐exposed individuals
Attributable Risk and Public Health Impact
Attributable risk is important in public health and the allocation of resources for improving population health
Fundamental Question: "How much of the risk (incidence) of disease can we hope to prevent if we are able to eliminate the exposure?"
The leading causes of death are a result of a myriad of risk factors. Which factors should we focus on?
Which factors may contribute to the biggest public health impact?
Estimating Potential for Prevention: Examples of AR
1. Can be calculated for exposed persons, e.g., the attributable risk of lung cancer in smokers (attributable risk for exposed persons)
2. Can also be calculated for the total population. e.g., the attributable risk of lung cancer in the total population which includes smokers and non‐smokers (attributable risk for population)
AR We Want to Know:
How much of total risk of disease is actually due to exposure?
Non‐exposed persons also have some risk of disease
Total risk of disease in exposed individuals is the sum of the background risk that any person has and the additional risk due to exposure of interest
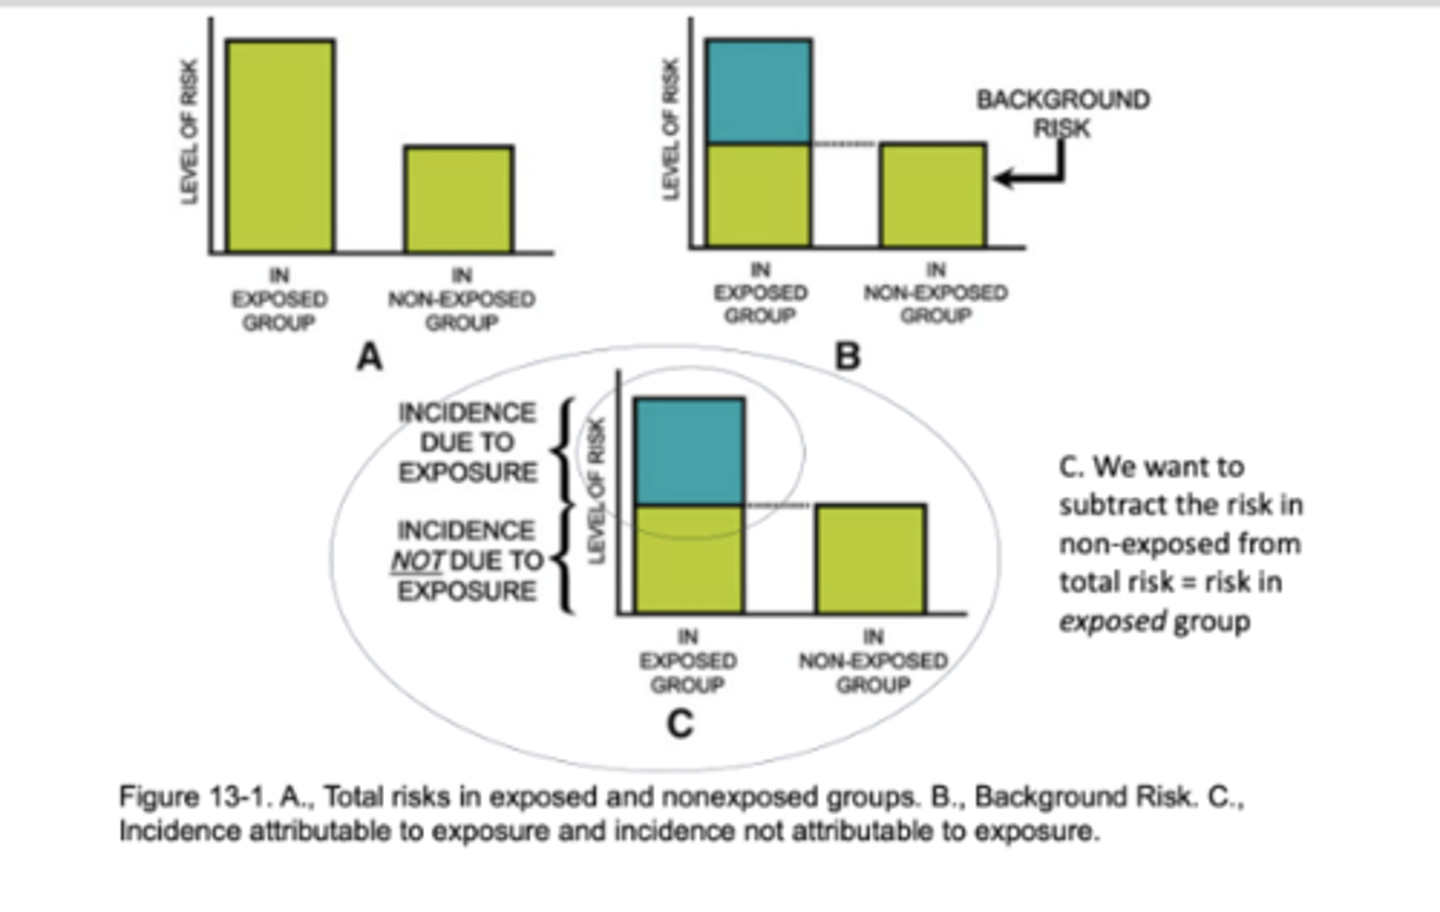
Attributable Risk Measures: general formula
Incidence attributable to exposure
Interpretation: Assuming causality, [X] cases of [outcome] among [exposed] is attributable to [exposure].
![<p>Incidence attributable to exposure</p><p>Interpretation: <strong>Assuming causality</strong>, [X] cases of [outcome] among [exposed] is attributable to [exposure].</p>](https://knowt-user-attachments.s3.amazonaws.com/b777ab2c-885f-4f18-88f3-d51e0fa27773.png)
What proportion of the risk in exposed persons is due to exposure? PAR
((Incidence in exposed group) - (Incidence in non-exposed group)) / Incidence in exposed group
Proportion of incidence attributable to exposure Attributable Risk (Rate) Proportion AR proportion can also be expressed as
What does it mean?:
10.6 of the 28/1,000 incident cases in those who smoke are attributable to the fact that they smoke
Can also be expressed as a proportion or %:
37.9% of the morbidity from CHD among those who smoke may be attributable to smoking and could presumably be prevented by eliminating smoking
We must know incidence of the (CHD) disease in the total population OR:
1. The incidence among those who smoke
2. The incidence among non‐smokers
3. The proportion of the total population that smokes
PAR Interpretation
What does this tell us? 21.3% of the incidence of CHD in the total population can be attributed to smoking. An effective program (at best) could achieve reduction of 21.3% in the incidence of CHD in TOTAL population
Interpretation: Assuming causality, [x] cases of [outcome] among the total population is attributable to [exposure].
![<p>What does this tell us? 21.3% of the incidence of CHD in the total population can be attributed to smoking. An effective program (at best) could achieve reduction of 21.3% in the incidence of CHD in <strong>TOTAL population</strong></p><p>Interpretation: <strong>Assuming causality</strong>, [x] cases of [outcome] among the total population is attributable to [exposure].</p>](https://knowt-user-attachments.s3.amazonaws.com/976867b8-77bb-4e97-baec-47095b74aad2.png)
Measures of Association: Recap of Some Examples
Validity of Study Designs: A Review
Validity of a study: "the degree to which the inference drawn from a study is warranted, when account is taken of the:
study methods - the representativeness of the study samples - and the nature of the population from which it is drawn
Two components: internal and external validity
Internal validity refers to the design, methods, analysis and results of an individual study
Proper selection of study groups and a lack of error in measurement
Study done properly and therefore findings are valid in the study population
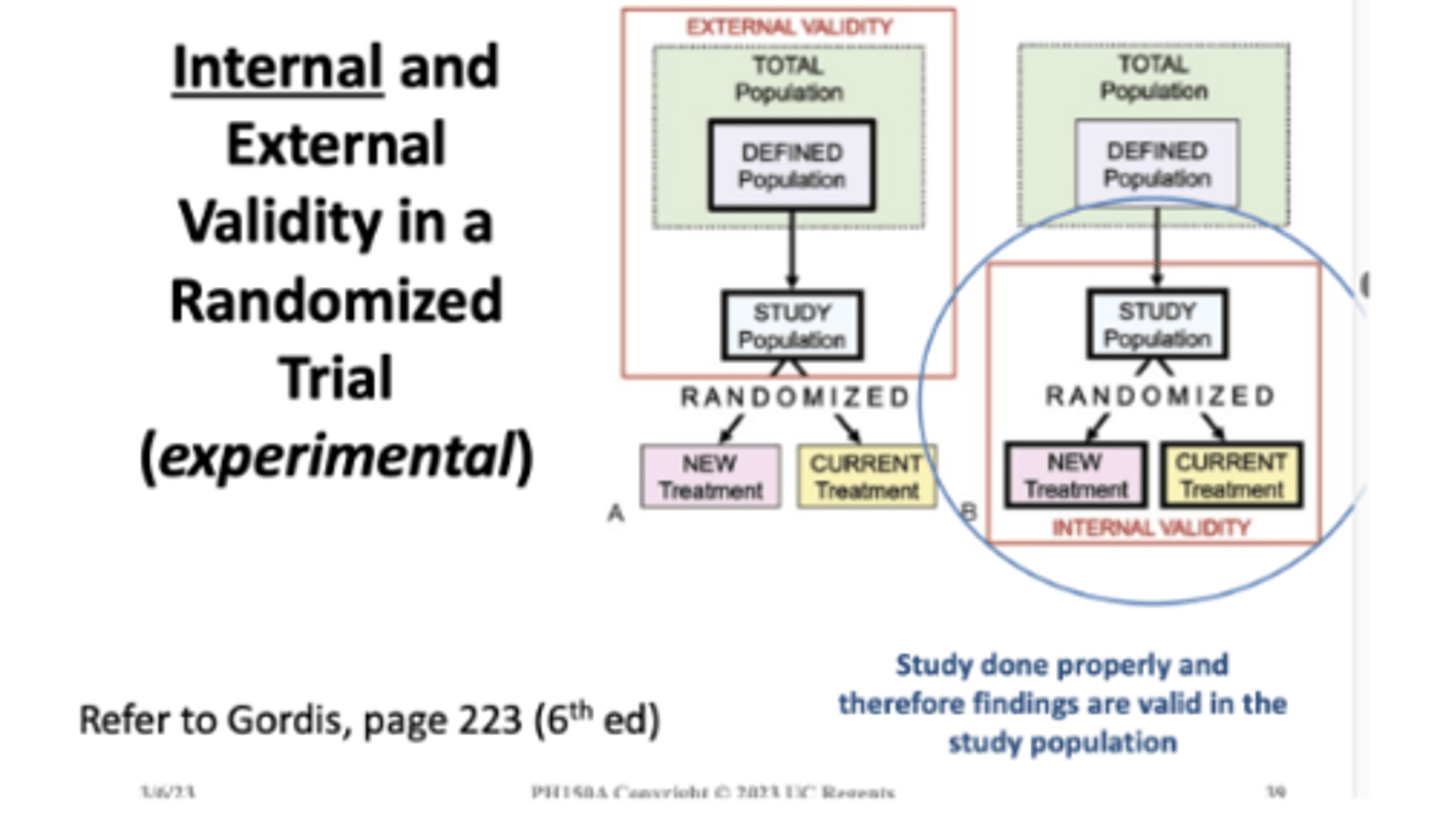
Internal validity is a requirement for external validity
External validity refers to the ability to generalize beyond a set of observations to some universal statement
"A study is externally valid or generalizable if it allows unbiased inferences regarding some other target population beyond the subjects in the study"
Internal and External Validity....
Are both basic concerns in the conduct of any experimental trial AND:
Other types of study designs! Like observational studies
Internal Validity: Issues to Consider
Selection of cases or controls or exposed and non-exposed groups
Exposure:
Outcome: disease, behavior, intermediate marker
Association between exposure and disease:
After a MOA is calculated...and an association is observed
The first question to ask is: Is it real?
in order to say anything about: causal inference or external validity ......our study must be internally valid!
We need to rule out:
Bias
Random Error
Confounding
What is Bias?
Systematic error in the design, conduct or analysis of a study that results in an incorrect or invalid estimate of an exposure's effect on the risk of disease....measure of association
Can be introduced at any stage of a study
Can occur in all types of epidemiologic studies
Retrospective studies more susceptible
Two main types: selection bias and information bias
Bias study map
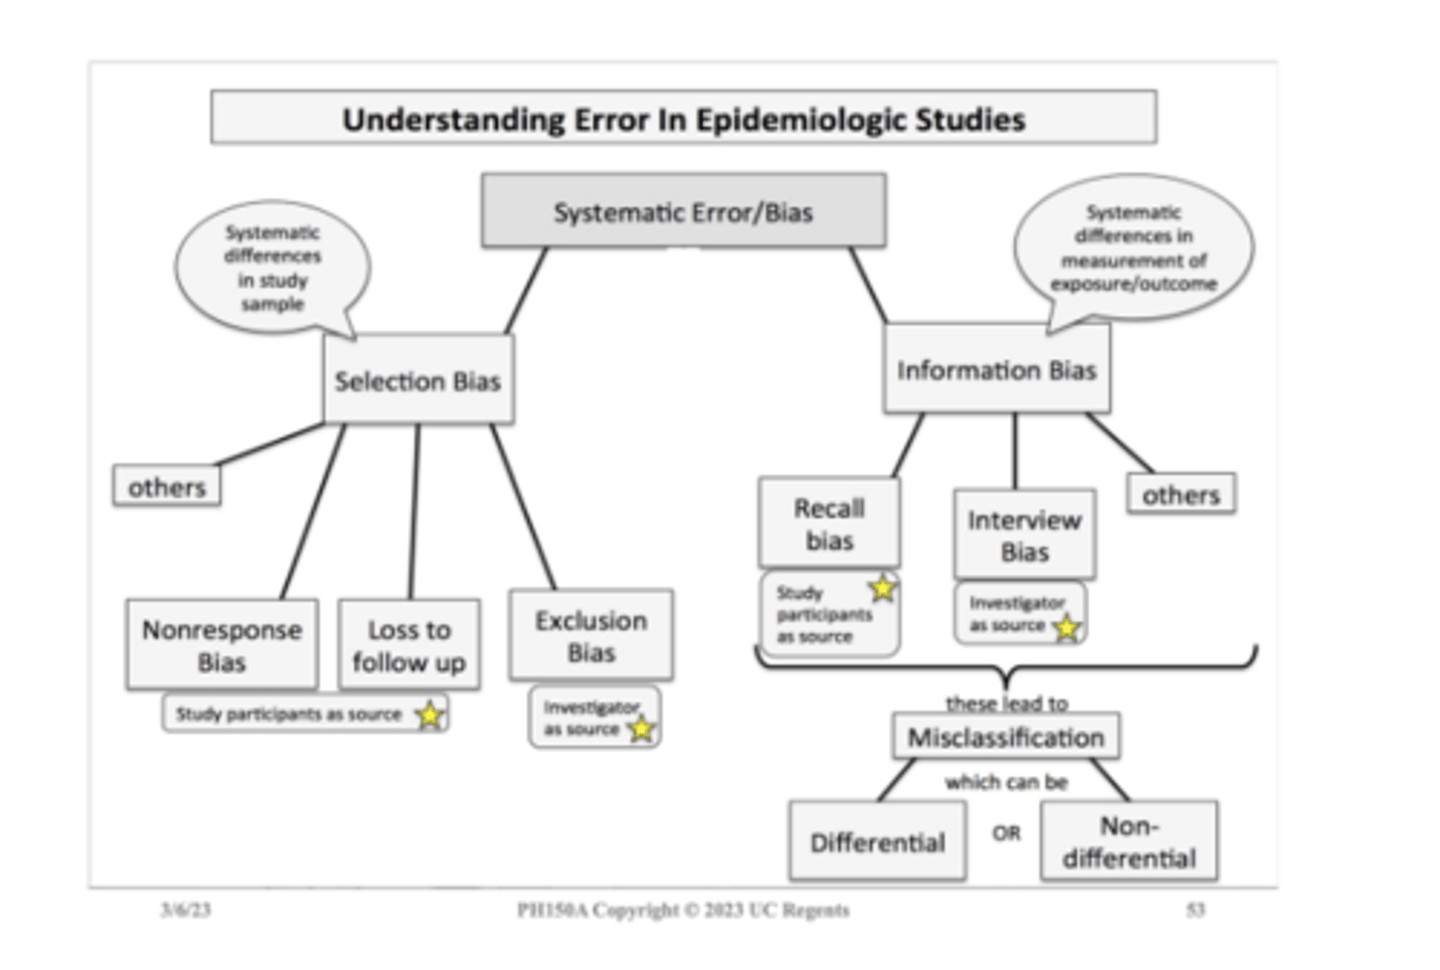
Types of bias
Selection bias: occurs during the selection and follow-up of study participants
Information bias: occurs during data collection
Investigators must:
Identify source of bias - Estimate its magnitude or strength - Assess direction
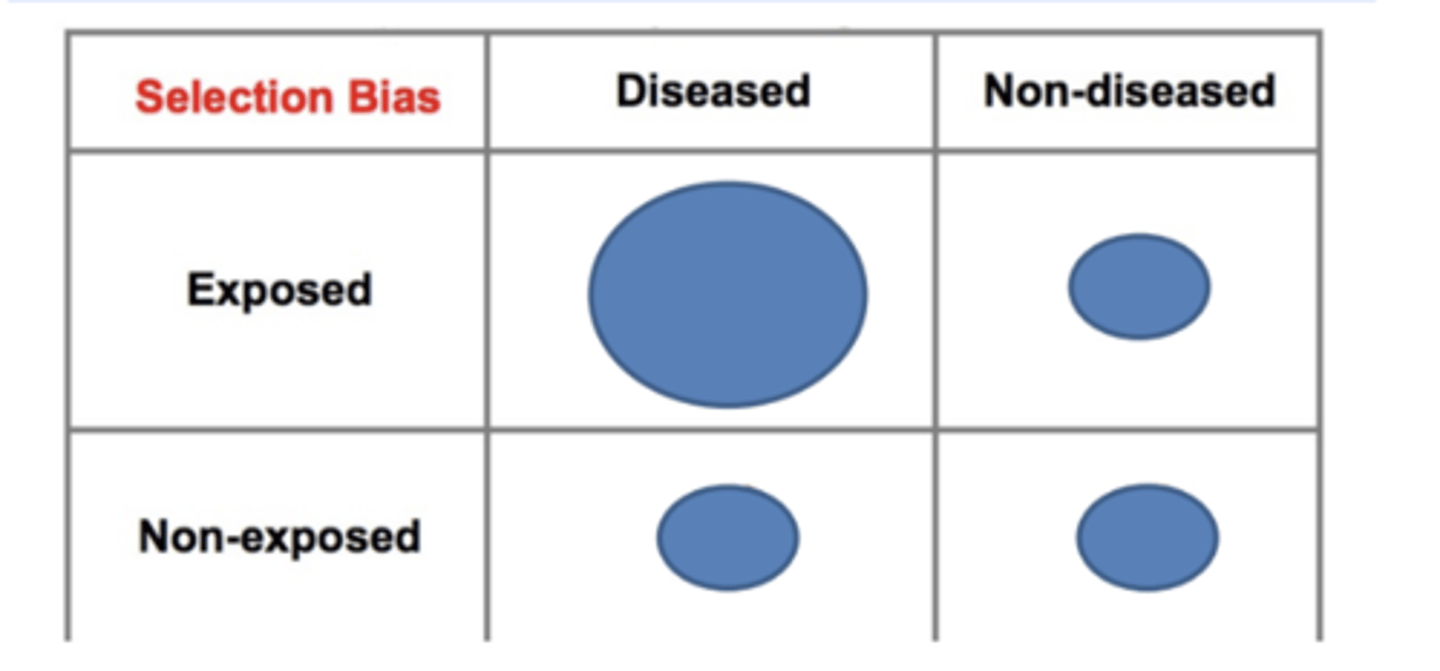
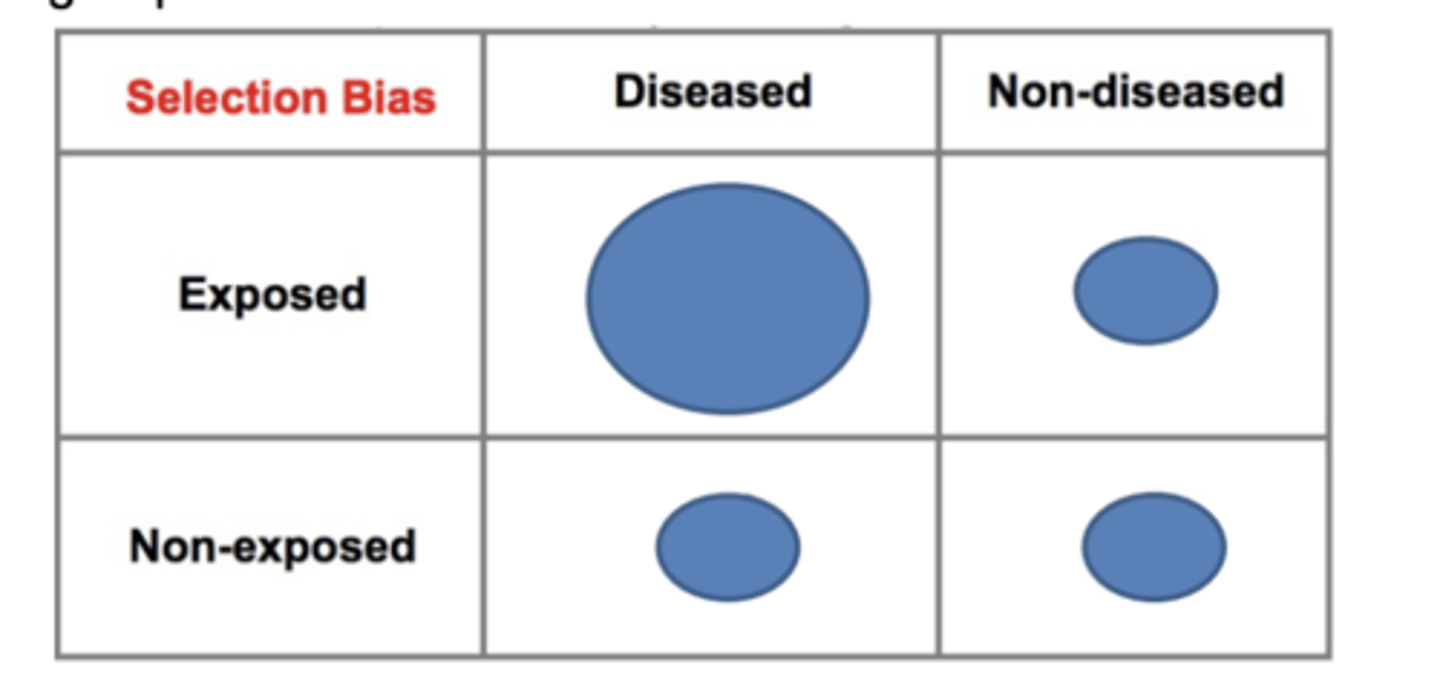
Selection Bias (systematic error)
Study population does not represent the target population
Results from procedures used to select subjects and from factors that influence participation in the study
Systematic differences in sample
between cases and controls in a case-control study
between exposed and non-exposed in a cohort study
between treatment arms in RCT
Non-compliance example
Selection Bias in Experimental Trial
People who do not comply or do not participate in studies differ from those who do comply and participate
Review example in Table 10.7 and Table 10.8: Coronary Drug Project
Demographic, socioeconomic, cultural, lifestyle medical characteristics
How does Selection Bias Occur?
Control selection bias
inappropriate control group
Non-response or refusal bias
agreement to participate is related to exposure and disease/outcome status (self-selection bias)
Differential surveillance, diagnosis or referral of study subjects
according to exposure and disease status
Healthy Worker Effect
Loss to follow-up
Control selection: COVID-19 example
Restricting to individuals who went out and sought a clinical test may reduce selection bias, but...
People who seek testing when they are asymptomatic could differ from those who sought testing because they were symptomatic
These differences could be associated with other risk-related behaviors (masking, vaccination, etc...)
Selection Bias in Study of Pap Smear and Cervical Cancer (control selection)
Example:
Investigators are evaluating role of pap smears in the prevention of cervical cancer
Investigators identify 250 newly diagnosed cases of cervical cancer by reviewing medical records where cancer patients are treated
Select population controls among women who live in the same neighborhood as cases
Travel through neighborhoods on foot during weekday working hours to enroll 250 controls
Findings
No association between pap smears and cervical cancer OR = 1 •
HOWEVER..................
Women at home during day less likely to be employed
Less likely to have regular medical check-ups • Source population different from the cases
If controls were more appropriately matched True OR=0.44
Pap Smear and Cancer Interpretation
There is 56% reduced odds of having a pap smear among women with cervical cancer compared to controls (OR=0.44). Pap smear is protective for cervical cancer
Results with control selection bias were biased towards the null
Selection bias occurred because "being home during the day" was required for controls but not for cases
These criteria were related to exposure status (pap smear)
The control group did not accurately represent the exposure distribution in the source population that produced the cases
This is avoidable in the study design phase!
Non-response or refusal bias (agreement to participate is related to exposure and disease/outcome status (self-selection bias)
Example: Self-Selection Bias
Selection bias can be introduced into case-control studies with low response or participation rates if the likelihood of responding or participating is related to both the exposure and the outcome.
Ex: Diseased subjects who had the exposure had a participation rate of 80%, and the other three categories had participation rates of 60%.
Differential Surveillance, Referral or Diagnosis of Subjects
Example: Investigators conducted a case-control study to determine whether use of oral contraceptives increased the risk of venous thromboembolism (blood clot).
Case group consisted of women who had been admitted to the hospital for venous thromboembolism.
Controls were women of similar age who had been hospitalized for unrelated problems at the same hospitals.
The interviews indicated that 70% of the cases used oral contraceptives, but only 20% of the controls used them.
The odds ratio was 10.2
However...there had been earlier reports suggesting this association.
As a result, health care providers were vigilant re: their patients on oral contraceptives and were more likely to admit them to the hospital if they developed venous thrombosis or any signs or symptoms suspicious of thromboembolism.
The study had a tendency to over sample women who had both the exposure and the 3/6/23 outcome of interest
Selection bias due to over-sampling of women with the exposure and the outcome
Selection bias could have been minimized by more restrictive case selection criteria, such that only women who clearly required hospitalization would be enrolled in the case group
Self-Selection Bias in a Prospective Cohort Study
At time of enrollment nobody knows who will develop the outcome
All participants are part of the same cohort with common eligibility criteria
The entire cohort may be healthier than the general population. However, the comparison group is an internal one. It comes from the same healthy cohort
If healthy people are more likely to volunteer for a cohort study, one might question whether the results are applicable to the broad population
For the study population, the measure of association will not be biased (internal validity is ok)
External validity or generalizability is the bigger issue.
Self-Selection Bias in a Retrospective Cohort Study
Could occur in a retrospective cohort study, especially if individuals have to provide informed consent for participation
Since a retrospective cohort study starts after all cases of disease have occurred, subjects generally would know both their exposure and outcome status
Those with the most interest in participation could both have been exposed and have the disease
Another less common mechanism of selection bias in a retrospective cohort study might occur if retention or loss of records of study subjects (e.g., employment, medical) were related to both exposure and outcome status
Selection bias can occur if selection or choice of the exposed or unexposed subjects in a retrospective cohort study is somehow related to the outcome of interest
Example: Self-Selection Bias in a Retrospective Cohort Study
An investigation of an occupational exposure (e.g., an organic solvent) that occurred 15-20 years ago in factory.
Over the years there were suspicions that working with the solvent led to adverse health events, but no definitive data existed.
A retrospective cohort study was conducted using the employee health records.
If all records had been retained, the results might look like those shown below
However, suppose that many of the old records had been lost or discarded, but, given the suspicions about the effects of the solvent, the records of employees who had worked with the solvents and subsequently had health problems were more likely to be retained.
Consequently, record retention was 99% among workers who were exposed and developed health problems, but record retention was only 80% for all other workers.
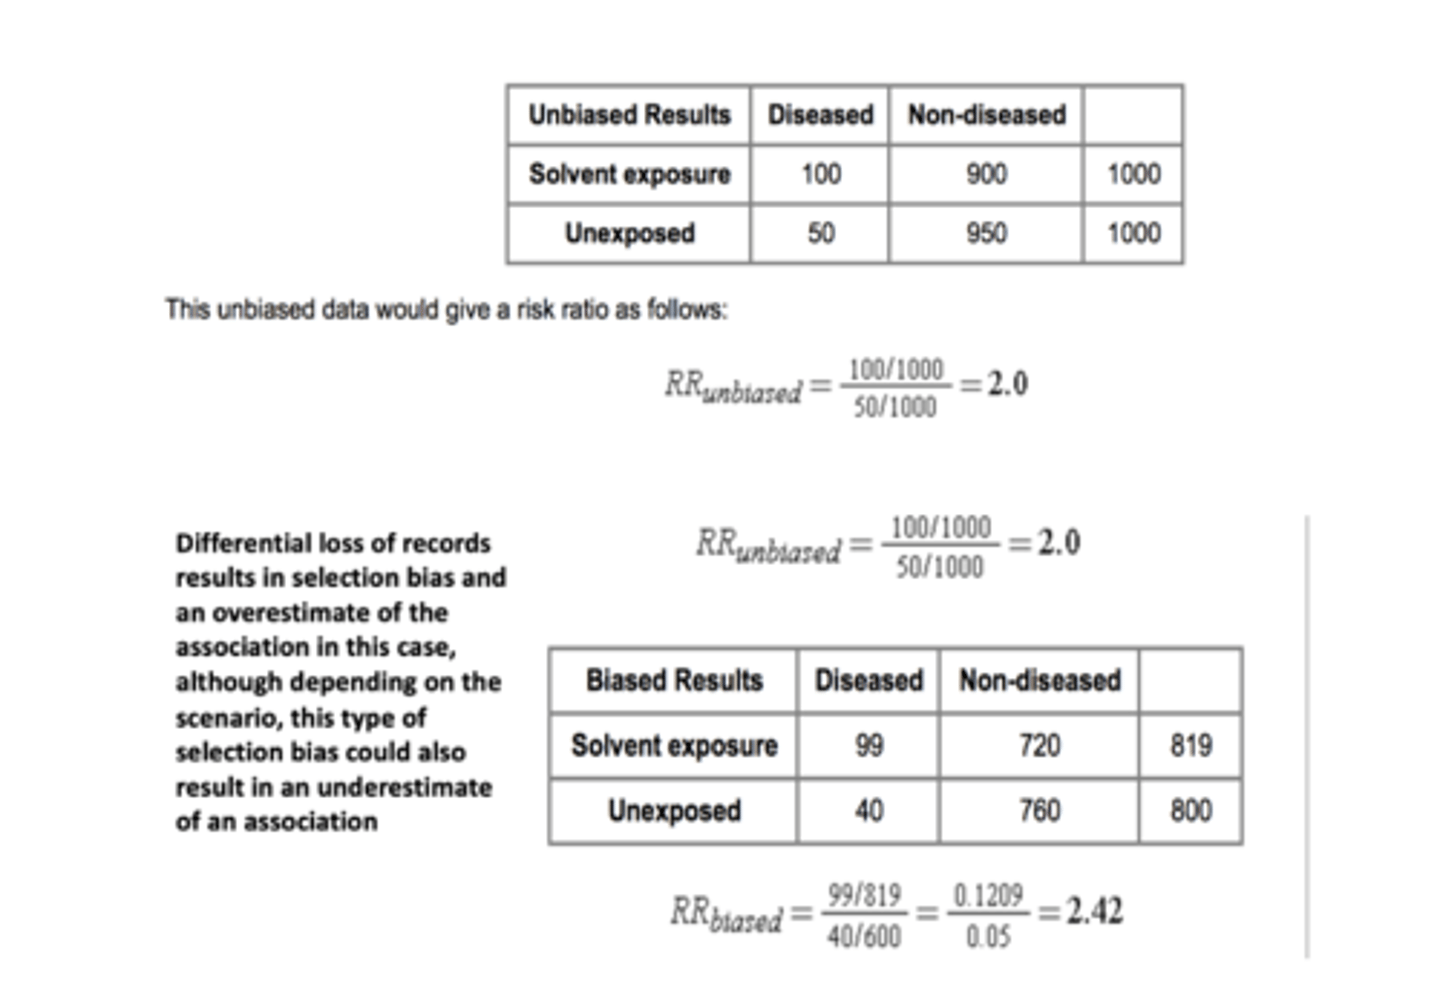
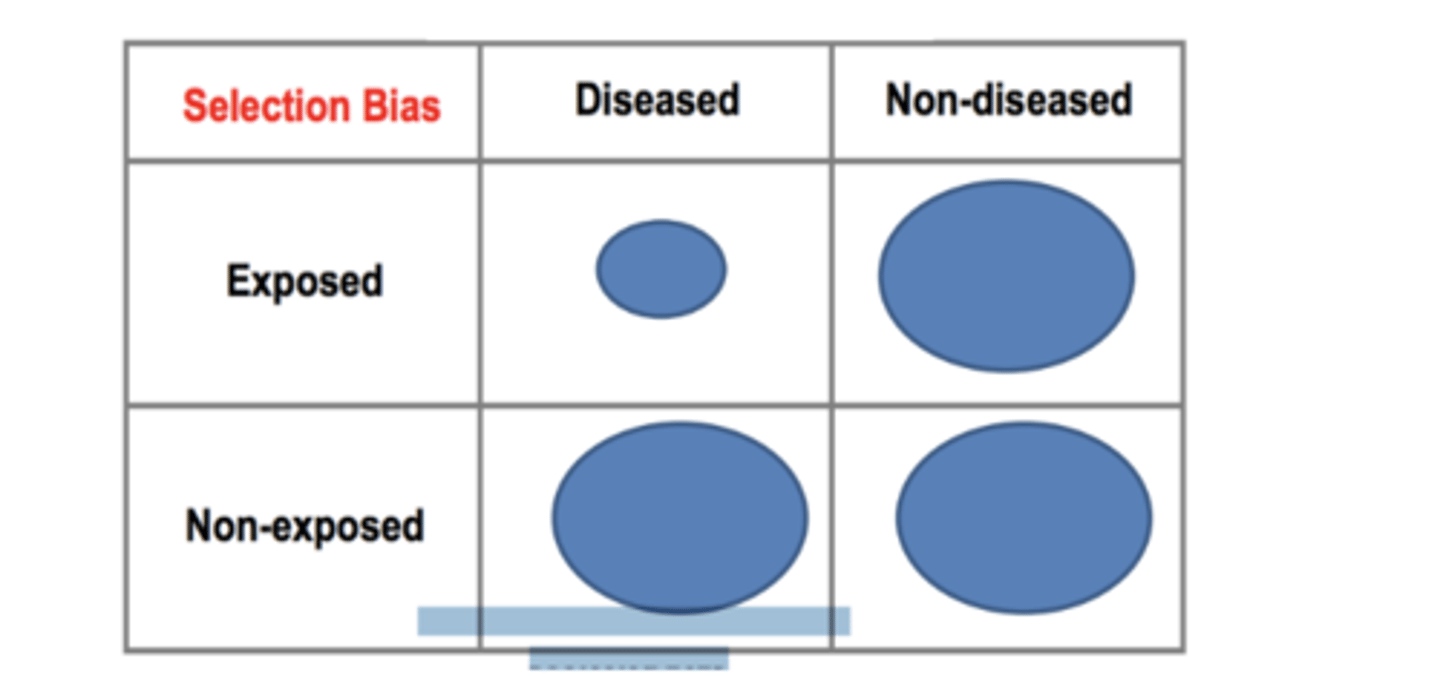
Loss to Follow-up: Selection Bias
The differential loss to follow up resulted in a relative under-sampling of exposed subjects who developed the outcome Depending on which category is underreported as a result of differential loss to follow-up, either an underestimate or overestimate of effect (association) can occur
Ways to Minimize Loss to Follow-up
Maintain high follow up rates (>80%)
Enrolling motivated subjects
Enrolling subjects who are easy to track
Making questionnaires as easy to complete as possible
Maintaining the interest of participants and making them feel that the study is important
Provide incentives
Healthy Worker Effect?
A special type of selection bias that occurs in cohort studies of occupational exposures when the general population is used as the comparison group.
The general population consists of both healthy people and unhealthy people. Those who are not healthy are less likely to be employed, while the employed work force tends to have fewer sick people.
People with severe illnesses would be most likely to be excluded from employment, but not from the general population
Comparisons of mortality rates between an employed group and the general population can be biased
Example: Selective survival can also affect a cohort study
Two study approaches for study of natural history of HIV infection-effect of recruitment
(1) Recruit participants at the time they become HIV infected
(2) Recruit participants by means of a serologic survey to detect prevalent infections
People who progress to AIDS and die relatively soon after infection will be underrepresented in study 2.
The second study will underrepresent people who have an especially rapid course to death, since they will be underrepresented among prevalent cases.
Even if the second study is able to control for time since infection, there is a possibility that it will overestimate time to death compared to study 1.
Information Bias
Systematic differences in the measurement of exposure, outcome or other variables
'Flaw' in measuring exposure, covariate or outcome variables that results in different quality (accuracy) of information between comparison groups
Participant or investigator as source
Occurs during data collection and may be of several types
Measurement error that distorts the true association between an exposure and disease
Types of Information Bias
Interviewer Bias - an interviewer's knowledge may influence the structure of questions and the manner of presentation, which may influence responses
Recall Bias - study participants with a particular outcome or exposure may remember events more clearly or amplify their recollections
Key Features of Information Bias
Occurs after the subjects have entered study
It pertains to HOW the data are collected
Often results in incorrect classification of participants as:
Exposed or unexposed • Diseased or not diseased
Can create a bias either toward or away from the null
Can be avoided by careful design and conduct 3/8/23of study
Recall Bias
Recall Bias: those with a particular outcome or exposure may remember events more clearly or amplify their recollections
There is a differential level of accuracy in the information provided by compared groups
Occurs in case-control study if cases are more or less likely than controls to recall and report prior exposures (most likely scenario)
Occurs in a cohort study if exposed subjects are more or less likely than unexposed subjects to recall and report subsequent diseases
Not the same as 'poor recall' or 'limitations in recall'
Ways to Minimize Recall Bias
Ways to minimize or avoid its occurrence
Select a diseased control group
Assumes exposure is unlikely to cause a general increase in the risk of multiple outcomes
Design a structured questionnaire for complete and accurate exposure ascertainment
Questionnaire design is important
Self-administered (useful for socially sensitive topics.....examples? Issues with this approach?)
Biological measurements or medical record data
Is Recall Bias Present?
Extent in studies may be largely unknown
Ask subjects about knowledge of study hypothesis at end of an interview
Ex. Folic acid use and risk of neural tube defects
Have you heard there are any vitamins minerals or anything else that may cause or reduce the risk of birth defects? If yes, which one?
Those with knowledge of hypothesis might be more prone to recall bias
Interviewer Bias
Interviewer Bias: an interviewer's knowledge may influence the structure of questions and the manner of presentation, which may influence responses
Systematic difference in soliciting, recording, or interpreting information that occurs in studies using in-person or telephone interviews
Can occur in all epidemiologic studies
Case-control study: Interviewers are aware of the disease status of a subject and question cases and controls differently about their exposures
Cohort or experimental study: Interviewers are aware of the exposure or treatment status of a subject and question exposed and unexposed subjects differently about their diseases or other outcome
Ways to Minimize Interviewer Bias
Ways to minimize or avoid its occurrence
Mask interviewers to the participant disease or exposure status
Design standardized questionnaires
Closed-ended, easy to understand questions
Translation for non-English speakers
Avoid medical terms or difficult chemical names
Computerized Assisted Telephone Interview
Train Interviewers -Standardized question -Non-directive probing
Makes for a long interview!
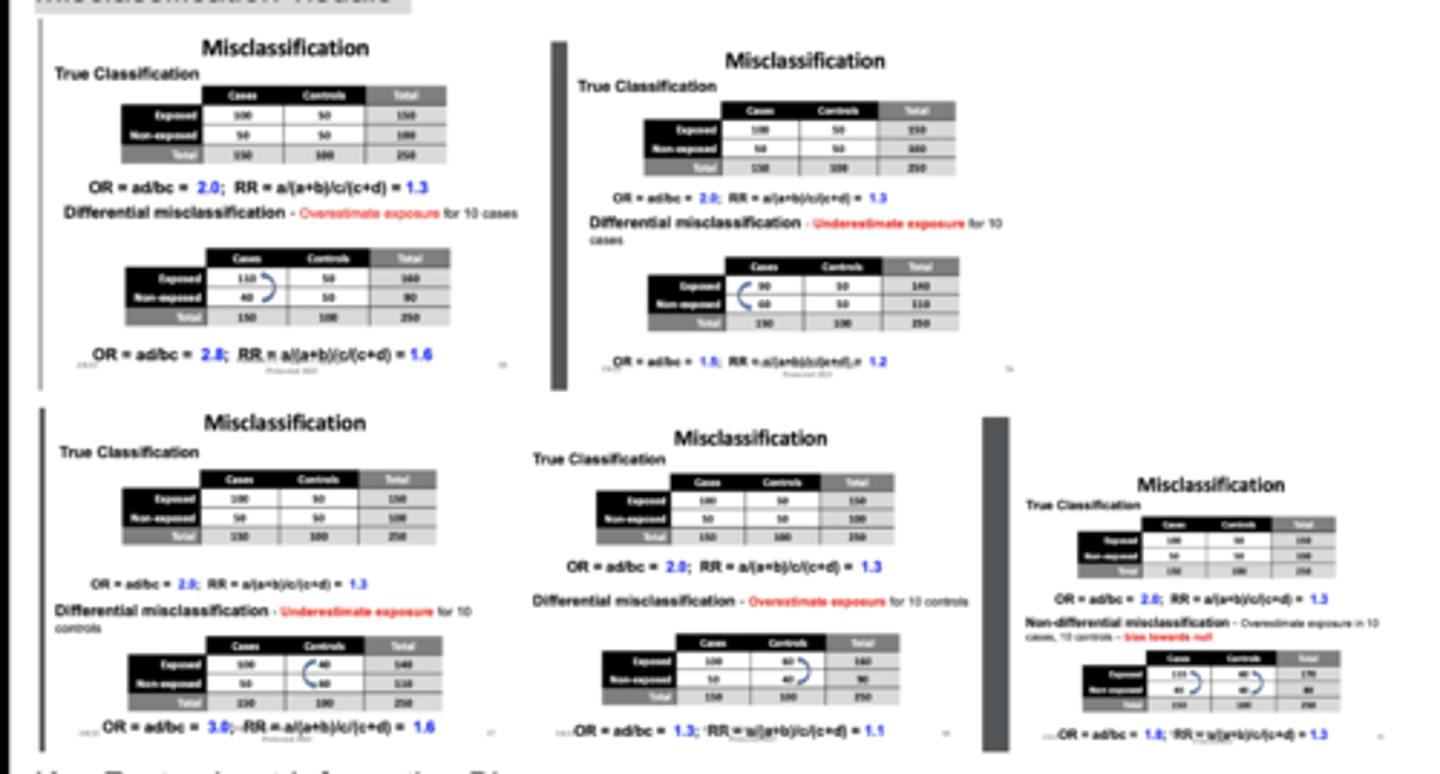
Types of Information Bias: Differential Misclassification
Differential - the rate of misclassification differs in different study groups
Example: misclassification of exposure may occur more often in cases than controls
Types of Information Bias: Non-Differential Misclassification
Non-Differential - results from the degree of inaccuracy that characterizes how information is obtained from any study group - not related to exposure status or case/control status.
Example: problem with data collection methods.
Misclassification visuals
Non-differential misclassification bias towards null
Non-differential misclassification blurs the distinction between groups.
So the observed association gets weaker.
Differential misclassification could go in either direction
Information Bias
Error arising from systematic differences in the way info on exposure and disease is obtained from study groups
Participants are incorrectly classified
Occurs after subjects have entered the study
Retro and prospective studies
Recall and interviewer bias à misclassification
Potential for Selection Bias in Evaluating Screening Programs
4 types :
1) Referral Bias (volunteer bias, self selection bias):
Who was screened vs. who was not
Volunteers may be healthier than the general population; more likely to comply with medical recommendations. Different SES.
or the opposite! We don't know
Potential for Selection Bias in Evaluating Screening Programs
4 types :
2) Length Bias (length-biased sampling, prognostic selection)
Occurs when screening tests disproportionately identify diseases with long preclinical detectable phases (the time disease is present but asymptomatic)
Aggressive, fast-growing diseases have short asymptomatic windows and are more likely to show symptoms faster. Slow-growing diseases remain in the “detectable” window longer, make them move likely to be found during screening.
Screened group appears to have better survival rates even if the screening itself has no actual medical benefit.
Ex. the selective identification of more slowly developing cancers (less aggressive disease)
Potential for Selection Bias in Evaluating Screening Programs
4 types :
Lead time bias
The perception that the screen-detected cases has a longer survival because disease was identified earlier
IF early detections is truly associated with improved survival, survival in the screened group should be greater than survival in the control groups plus the lead time.
Lead time bias occurs when early detection makes survival seem longer, even if death occurs at the same time. Length time bias happens when screening disproportionately detects slow-progressing, less fatal cases, overestimating overall survival rates
Potential for Selection Bias in Evaluating Screening Programs
4 types:
Overdiagnosis Bias
Type of misclassification bias
Inflate estimate of survival
Wrong conclusion about screening improving survival → screening can half false + → follow them → false inflated survival rate
Two categories of error: Random and Systematic
Random Error
Fluctuations around a true value of a parameter
Due to poor precision
Due to sampling error
Variability in measurement
Two categories of error: Random and Systematic
Systematic Error
Non-random
Measurement Biases