Statistics
1/17
Earn XP
Description and Tags
HALG2 Stats
Name | Mastery | Learn | Test | Matching | Spaced |
|---|
No study sessions yet.
18 Terms
Experiment vs observational study
Observational study:
watch while looking for patterns but not influencing the results.
aims to describe a group.
no control over it.
Experiment
INFLUENCING/ doing something to change responses. You have control
The one conducting it has control over it.
proving a cause leads to an effect
Sample survey vs. a census
Sample survey - a small group is sampled (SRS = simple random sample) to describe a population
Census - the WHOLE population provides data
Rate vs. count
We only do rates (fractions, proportions, or percents) of people
Sample pieces:
population, parameter, sample, statistic
parameter [p]
a percent to describe a poplation. It is usually unknown, so statistics measure this.
Statistic [p-hat]
number to describe a sample (proportion)
example: sample is 500 adults, statistic is 300/500, or 60%.
Mean & median
average (sum over number of pieces)
middle piece when put in order
5 number summary
Min: smallest piece of data
quartile 1: average of the pieces from the min to the one before the median
Median
quartile 1 average of the pieces from one after the median to the max
Max: largest piece of data
example data: 1, 3, 4, 5, 6, 7, 8
Min: 1 Max: 8 Median: 5
Q1: 8/3 Q3: 7, or 21/3
Inner quartile range
[Q1 - Median - Q3]
Box and Wisker plot
Set a nice scale
plot the pieces from the 5-number summary on a numberline
make a box around the IQR
Outliers
1.5(Q3-Q1) = #
then: Q1 - # & Q3 + #
Range: [Q1 - #, Q3 + #]. If outside this range, it is an outlier
deviation (s)
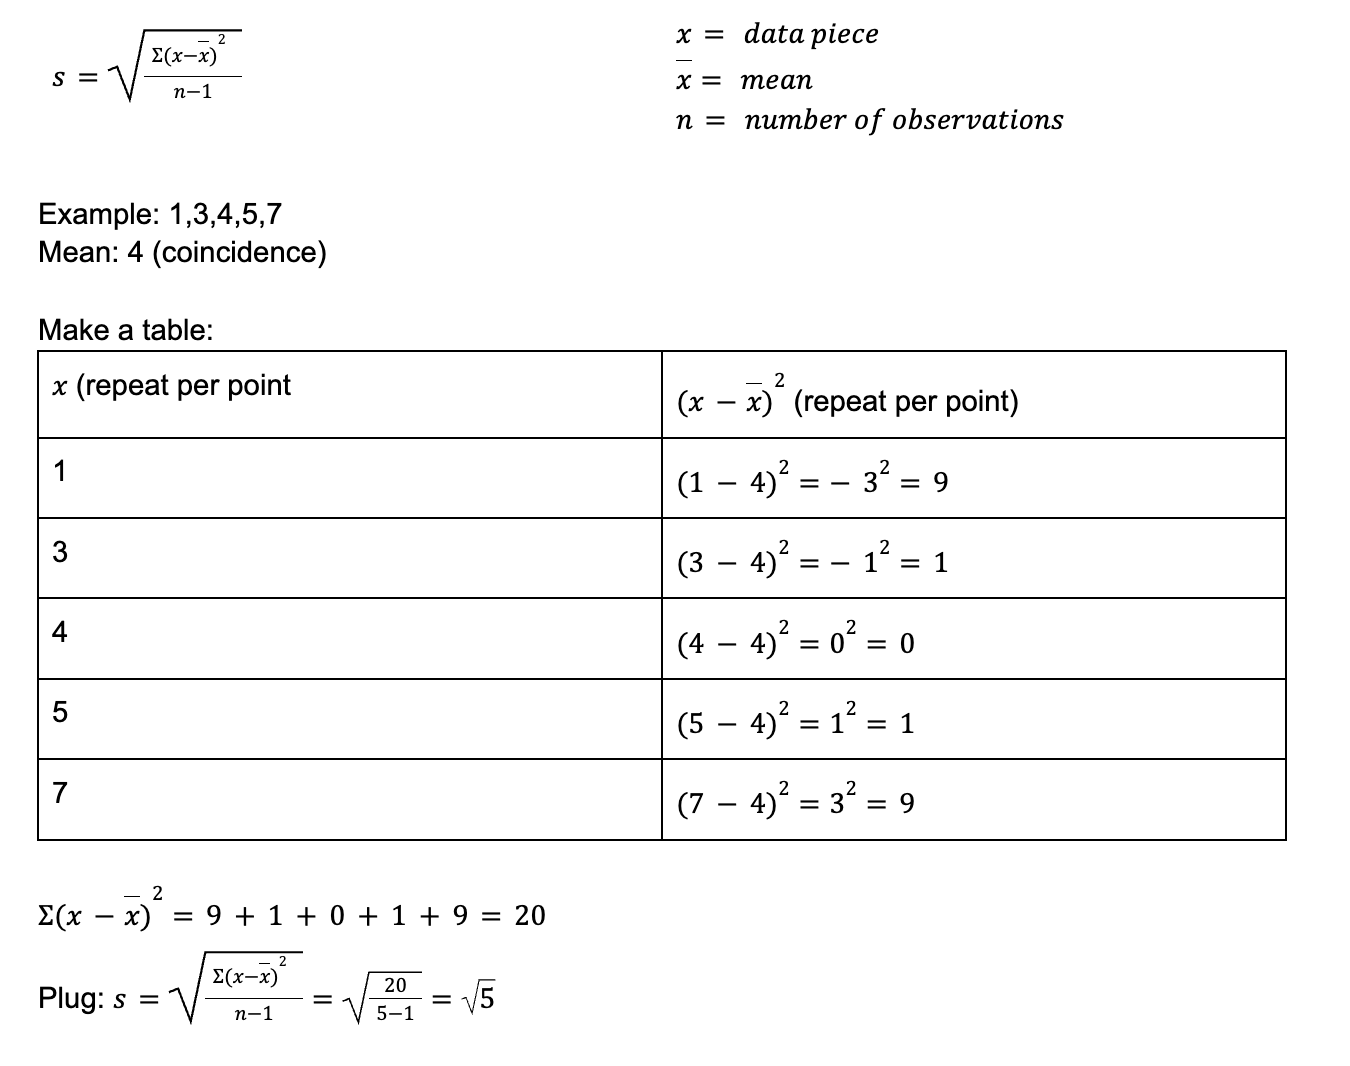
spread
measured by the standard deviation
use the mean x as the center
same unit as OG data (if measuring in meters, its in meters)
When to use standard deviation vs. 5 number summary
mean and Standard deviation when mean and median are close together (symmetric), as they get effected by outliers
5 number summary is best when there are are outliers
Properties of a normal distribution
The mean determines the center. Everything deviates from the mean.
all pieces of data are represented under the curve (100%)
Empirical Rule
34%, 13.5%, 2.35%, 0.15%.
Anything in the 2.35 and 0.15 is an outlier
a higher z score means higher probability (0-50%, 1-68%, 2-95%, 3-99.7%)
Normal CDF and inverse
Apps
Stat
Enter
F5
Pick one