Stats Exam 2 Terms
1/110
There's no tags or description
Looks like no tags are added yet.
Name | Mastery | Learn | Test | Matching | Spaced | Call with Kai |
|---|
No analytics yet
Send a link to your students to track their progress
111 Terms
Sample design
specific plan or protocol for how individuals will be selected or sampled from a population of interest. Must address the following two questions: 1. Does the order of selecting participants matter? 2. Do we replace each selection before the next draw?
What are the 2 strategies for sampling?
Theoretical sampling and
Experimental sampling
example of sampling without order
If order does not matter, you can sample participants in any order which means sample A, C, D is seen as equivalent/redundant to sample C, A, D
Sampling without replacement
-when sampling, each participant selected is not replaced before the next selection
◦ Most common method used in behavioral research
example of sampling without replacement
Sample without replacement: A, D, C (no repeats) ◦ The odds of selection increase each round of selection ◦ Odds of selecting A in round 1 is ¼ ◦ If not already selected, A has a 1/3 chance in round 2. ◦ If not selected already, A has a ½ chance of selection in round 3.
(Basically once a participant (letter) is selected, it wont be selected again and it heightens the chances of the other participants (letters) being chosen)
Theoretical sampling
-sampling strategy of used in development of statistical theory
-In theoretical sampling, the order of selecting individuals matters and each individual selected is replaced before sampling again To determine the number of samples of any size that can be selected from a population:
◦ Total number of samples possible = N^n
◦ Example--if we had samples of two participants (n = 2) from a population of 3 people (N = 3): 3^2 = 9 samples
Experimental sampling
-most commonly used in experimental research
In experimental sampling, the order of selecting individuals does not matter and each individual selected is not replaced before selecting again To determine the number of samples of any size that can be selected from a population:
◦ Total number of samples possible = N!/n! (N-n)!
Example--if we select as many samples of two participants as possible (n = 2) from a population of three people (N = 3): 3!/2!(3-2)!
What is a Factorial sign? (!)
We are going to take the product of a number by every number between that number and zero (not including 0) EX: 4! = 4 x 3 x 2 x 1 = 24
Sampling distributions
a distribution of all possible sample means or variances that could be obtained in samples of a given size from the same population
◦You can then compare the statistics obtained in the samples to the value of the mean and variance in the hypothetical population
unbiased estimator
The mean of its sampling distribution is equal to the true value of the parameter being estimated
Central Limit Theorem
the distribution of sample averages tends to be normal regardless of the shape of the process distribution
standard errors of the means
the standard deviation of the distribution of sample means It measures the average distance between a sample mean and the population mean Provides a measure of how accurately, on average, a sample mean represents its corresponding population mean.
sampling error
-the extent to which sample means selected from the same population differ from one another
what is a z transformation?
A sampling distribution can be converted to a standard normal distribution by applying the z transformation
-z transformation is used to determine the likelihood of measuring a particular sample mean from a population with a given mean and variance
What decreases standard error?
-As the population standard deviation decreases, standard error decreases
-As sample size increases, standard error decreases (Law of Large numbers)
What are the main characteristics of the sample mean?
1. The sample mean is an unbiased estimator.
2. The distribution of sample means follows the central limit theorem.
3. A distribution of sample means has minimum variance.
standard normal distribution
a normal distribution with a mean of zero and a standard deviation of one
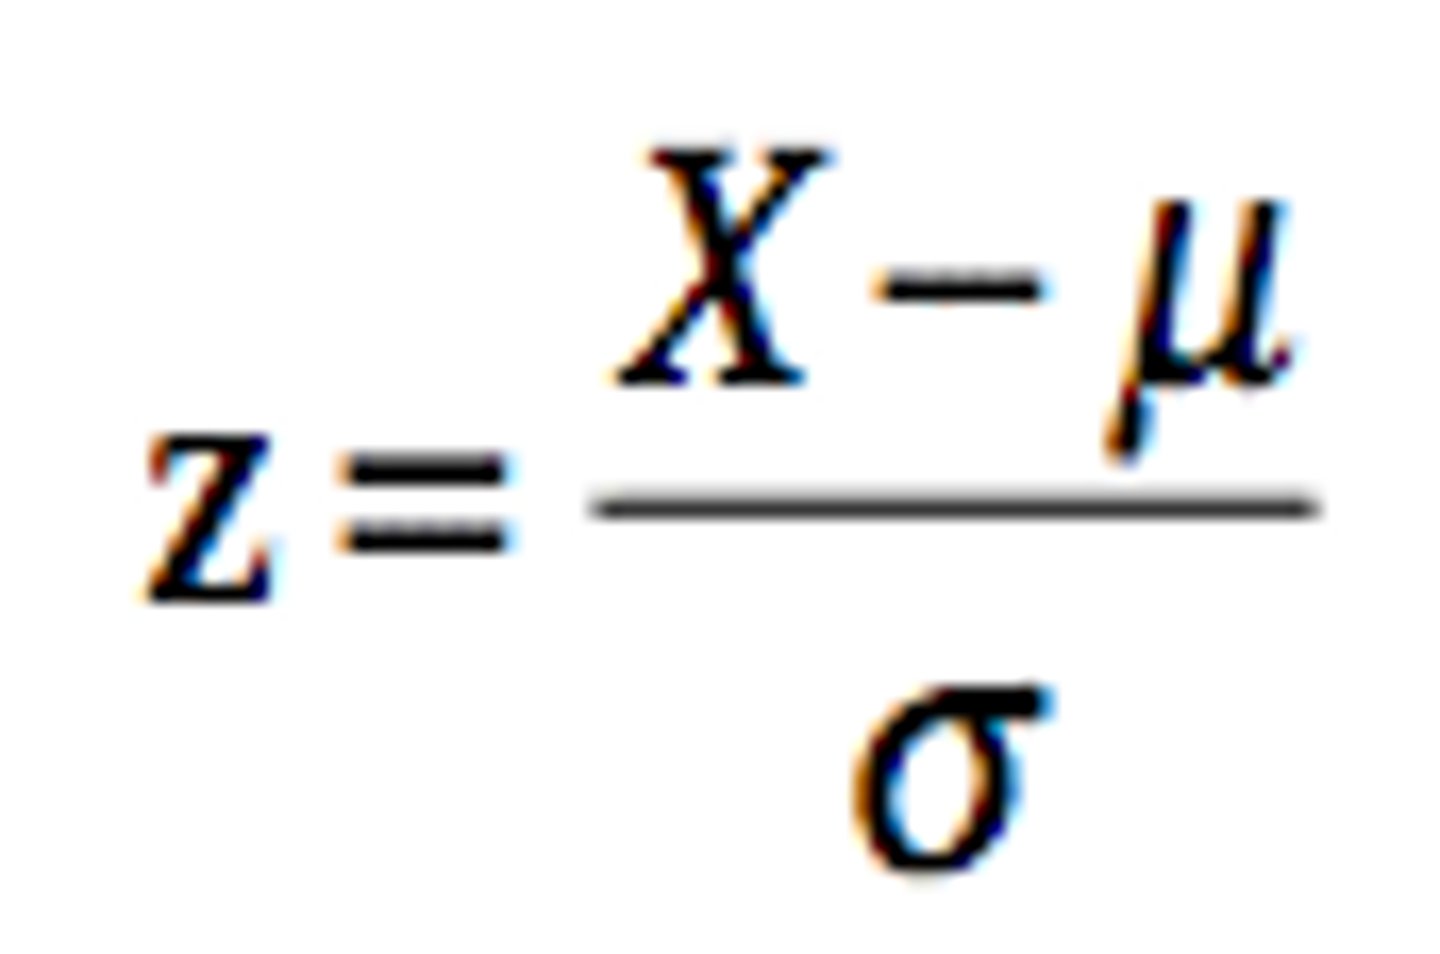
Z transformation formula (population scores)
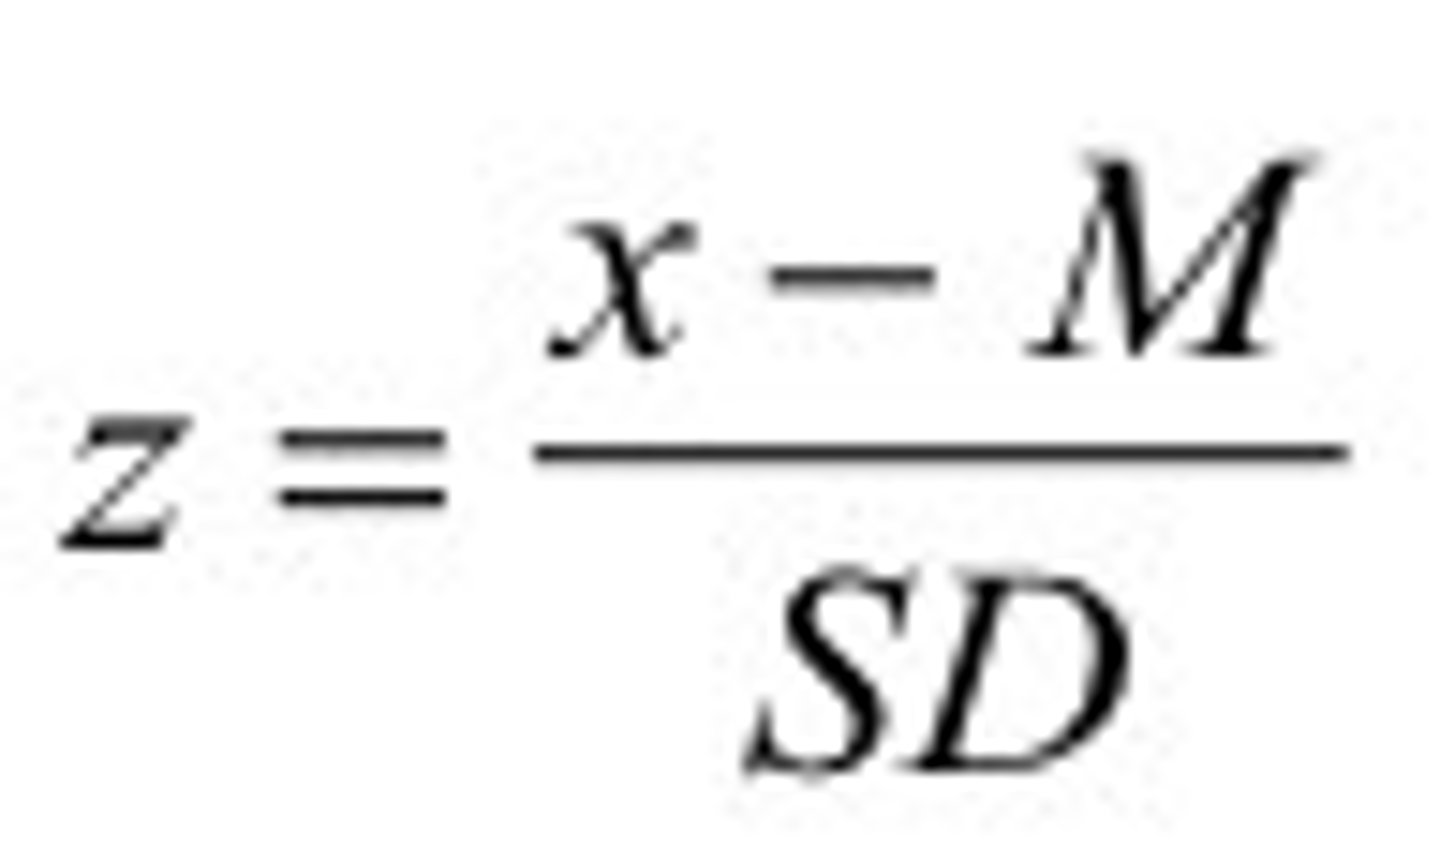
Z transformation formula (Sample scores)
What is hypothesis testing?
the method for testing a hypothesis about a population parameter, using sample statistics
• The goal is to test questions, claims and ideas about a population
• Specifically, we are predicting the probability (p) that a population parameter, such as the mean, is likely to be true
What is the goal of a hypothesis test?
Determine whether our observed difference - between our sample mean and what we expect from the population - is large enough that we can rule out random chance as the cause
What are the 4 steps of hypothesis testing?
1. State the null and alternative hypothesis
2. Set the criteria for a decision (find the critical test value)
3. Compute the test statistic
4. Make a decision to accept or reject the null hypothesis and interpret)
What is a Null hypothesis?
-H0 = "H naught"
-considered the "status quo"
-what the world already thinks is true
-statement about the population parameter (such as the mean) that is assumed to be true
What is an alternative hypothesis?
-H1
-a challenge to the status quo
-what may actually be true
-statement that contradicts the null hypothesis
Directionality
-indication the direction of the difference of the H1 from the H0
-The word "smaller" (or larger) indicates direction of the difference
Level of significance
Criterion of judgment upon which a decision is made regarding the value stated in a null hypothesis
-the threshold for accepting/rejecting the null hypothesis
-Based on the probability in behavioral research studies of obtaining a statistic measured in a sample if the value stated in the null hypothesis were true
What is the most common level of significance? (traditionally)
5% or .05
-When the probability of obtaining a sample mean is less than 5% if the null were true, we reject the null (p < .05)
What are p-values?
-probability of getting study estimate when there is really no association because of sampling error
-in more recent years there has been a push to lower this number to p < .01 (1%) or even p < .001 (.1%). In other words, we are less likely to mistakenly reject the null hypothesis if we set the level of significance lower.
What is the test statistic?
-A standardized value that is calculated from sample data during a hypothesis test.
◦ The value of the test statistic can be used to make a decision regarding null hypothesis
◦ Helps determine how likely the sample outcome is if the population mean stated in the null is true
◦ The larger the value of the test statistic, the further a sample mean deviates from the population mean stated in null hypothesis
How do you make a decision to reject the null hypothesis?
-the sample mean is associated with low probability of occurrence if the null is true ◦ p value <.05 (or the set level of significance); reached significance
How do you make a decision to retain the null hypothesis?
the sample mean is associated with high probability of occurrence when null is true ◦ p value >.05 (or the set level of significance); significance failed to reach
What are the 4 possible outcomes when conducting the 4th step of a hypothesis test?
1. Decision to retain the null is correct
2. Decision to retain the null is incorrect (Type II or β error)
3. Decision to reject the null is correct
4. Decision to reject the null is incorrect (Type I error)
Type 1 error
rejecting the null hypothesis when it is true (false positive)
-Alpha level (α)--level of significance or criterion of a hypothesis test ◦ Researchers control for Type I error by stating a level of significance (also called an alpha level) ◦ The significance level is the largest probability of committing Type I error that we will allow and still decide to reject the null hypothesis ◦ Criterion is usually set at .05 ◦ α level is compared to the p value in making a decision
Type 2 error (Beta Error)
-Accepting null hypothesis when you should have rejected it (Null IS false but you incorrectly retain the null)
-Power--the probability of rejecting a false null hypothesis
◦ It is the likelihood that we will detect an effect, assuming an effect exists
What is a one-sample z test?
Used to test hypotheses concerning the mean in a single population with known population variance . Can be directional or non-directional.
Non-directional z test
Two-Tailed Tests (H1: ≠): Alternative hypothesis is stated as not equal to (≠) the null
-divide significance level in half for two-tailed test before locating score
-Interested in any alternative from null hypothesis
Directional z test
One-Tailed Tests (H1: >) or (H1: <): Alternative hypothesis is stated as greater (>) or less than (<) null
◦ Upper tail critical test (H1 > H0)
◦ Lower tail critical test (H1 < H0)
How do you compute a z statistic?
Formula is the sample mean minus the population mean stated in the null hypothesis divided by the standard error of the mean
How do you find the standard error of the mean?
The population standard deviation(SD) divided by the square root of the sample size (n)
When is a Z test performed?
We can only do a z test if we know the population mean and error of the mean the standard (which requires the population standard deviation)
William Gossett
-Statistician known for developing the t test.
-We substitute the population variance with the sample variance in the formula for standard error This substitution, called the estimated standard error, is the denominator of the test statistic for a t test This is acceptable because sample variance is an unbiased estimator of the population variance
Estimated standard error
an estimate of the standard deviation of a sampling distribution of sample means selected from a population with an unknown variance.
◦ It is an estimate of the standard error or standard distance that sample means deviate from the value of the population mean stated in the null hypothesis
What is a t-statistic?
Used to determine the number of standard deviations in a t distribution that a sample deviates from the mean value or difference stated in the null
What is the t distribution?
-Using the estimated standard error in the denominator of the test statistic led to a new sampling distribution
-It is like a normal distribution, but with greater variability in the tails
What are degrees of freedom? (df)
the number of independent components in a control system and the number of ways each component can vary
-The df for a t distribution are equal to the df of the sample variance: n - 1. ◦ As the n increases, sample variance more closely resembles population variance ◦ As n increases, the probability of outcomes in the tails become less likely and the tails approach the x-axis faster
What are the steps of a t-test?
Step 1: State the hypotheses
Step 2: Set the criteria for making a decision
Step 3: Compute the test statistic
Step 4: Make a decision
(the same as a hypothesis test)
what is a t-test?
-A statistical procedure used to test hypotheses concerning a single group mean in a population with an unknown variance
-statistical measure, the difference between TWO mean scores
(TIP: "t" stands for two)
What are the 3 assumptions made when conducting a one sample t-test?
Normality, Random sampling, and independence
Normality
assume data in the population being sampled are normally distributed
Random sampling
assume that the data were obtained using a random sampling procedure
independence
assume that probabilities of each observation in a study are independent
what are effect sizes?
Effect sizes are a measure of how important the difference between group means is (or how meaningful a relationship between 2 variables is)
Cohen's D
Cohen's d is a measure of the number of standard deviations an effect shifted above or below the population mean stated in the null hypothesis. We only report Cohen's d when the null hypothesis is rejected .
Estimated Cohen's d
Estimated Cohen's d-measure of effect size in terms of the number of SDs that mean scores shift above or below the population mean stated by the null hypothesis ◦ The larger the value of d, the larger the effect
Cohen's D (z test)
d =sample mean minus population mean, divided by population standard deviation
Estimated Cohen's D (t-test)
d= sample mean minus population mean, divided by sample standard deviation
What are the 3 measures of effect size for T-tests?
-Estimated Cohen's d
◦ Eta-Squared (proportion of variance)
◦ Omega-Squared (proportion of variance)
Proportion of variance
measure of effect size in terms of the proportion or percent of variability in a dependent variable that can be explained or accounted for by a treatment
Treatment
any unique characteristic of a sample or any unique way that a researcher treats a sample
◦ Can change value of a dependent variable
◦ Associated with variability in a study
eta-squared
Eta-squared tends to overestimate proportion of variance explained by treatment
omega-squared
-Omega-squared gives a more conservative estimate
-w^2
What are confidence intervals?
The confidence interval (CI) is a range of values that's likely to include a population value with a certain degree of confidence. It is often expressed as a % whereby a population mean lies between an upper and lower interval.
-The confidence is in the method, not in a particular CI . If we repeated the sampling method many times, approximately 95% of the intervals constructed would capture the true population mean. Therefore, as the sample size increases, the range of interval values will narrow, meaning that you know that mean with much more accuracy compared with a smaller sample.
What are the 3 steps to estimate the value of a population mean using a point estimate and interval estimate?
Step 1: Compute the sample mean and standard error ◦ Step 2: Choose the level of confidence and find the critical values at that level of confidence
Step 3: Compute the estimation formula to find the confidence limits
Variance of population data
variance of sample data
standard deviation (population)
standard deviation (sample)
s^2
summation

mean symbol for sample data
or "M"
population mean
sample size
n
Population size
N
probability
p
z statistic
z
t statistic
t
Cohen's d (effect size)
d
eta squared (effect size)

omega squared (effect size)
w^2
alpha level (level of significance)
α
Beta (power) (type 2 error)
B
Sum of squares (squared distance between observation and mean)
SS
correlation
statistical procedure used to describe the strength and direction of the linear relationship between two factors. ◦ In a correlation, we treat each factor like a dependent variable and measure the relationship between the pair.
How is correlation used?
◦ (1) describe the pattern of data points for the values of two factors
◦ (2) determine whether the pattern observed in a sample is also present in the population from which the sample was selected
How is correlation illustrated?
Typically illustrated through a scatter plot
◦ illustrate the relationship between two variables (x,y) plotted on the x and y axes of the graph, Pairs of values for x and y are called data points.
◦ Data points plotted to see if a pattern emerges.
Linearity
In behavioral research, we mostly describe the linear (or straight line) relationship between two factors.
Correlation coefficient (r)
-used to measure the strength and direction of the linear relationship, or correlation, between two factors ◦ The value of r ranges from −1.0 to +1.0 • Values closer to ±1.0 indicate stronger correlations • A value of 0 indicates no relationship o The sign of the correlation coefficient (− or +) indicates only the direction or slope of the correlation
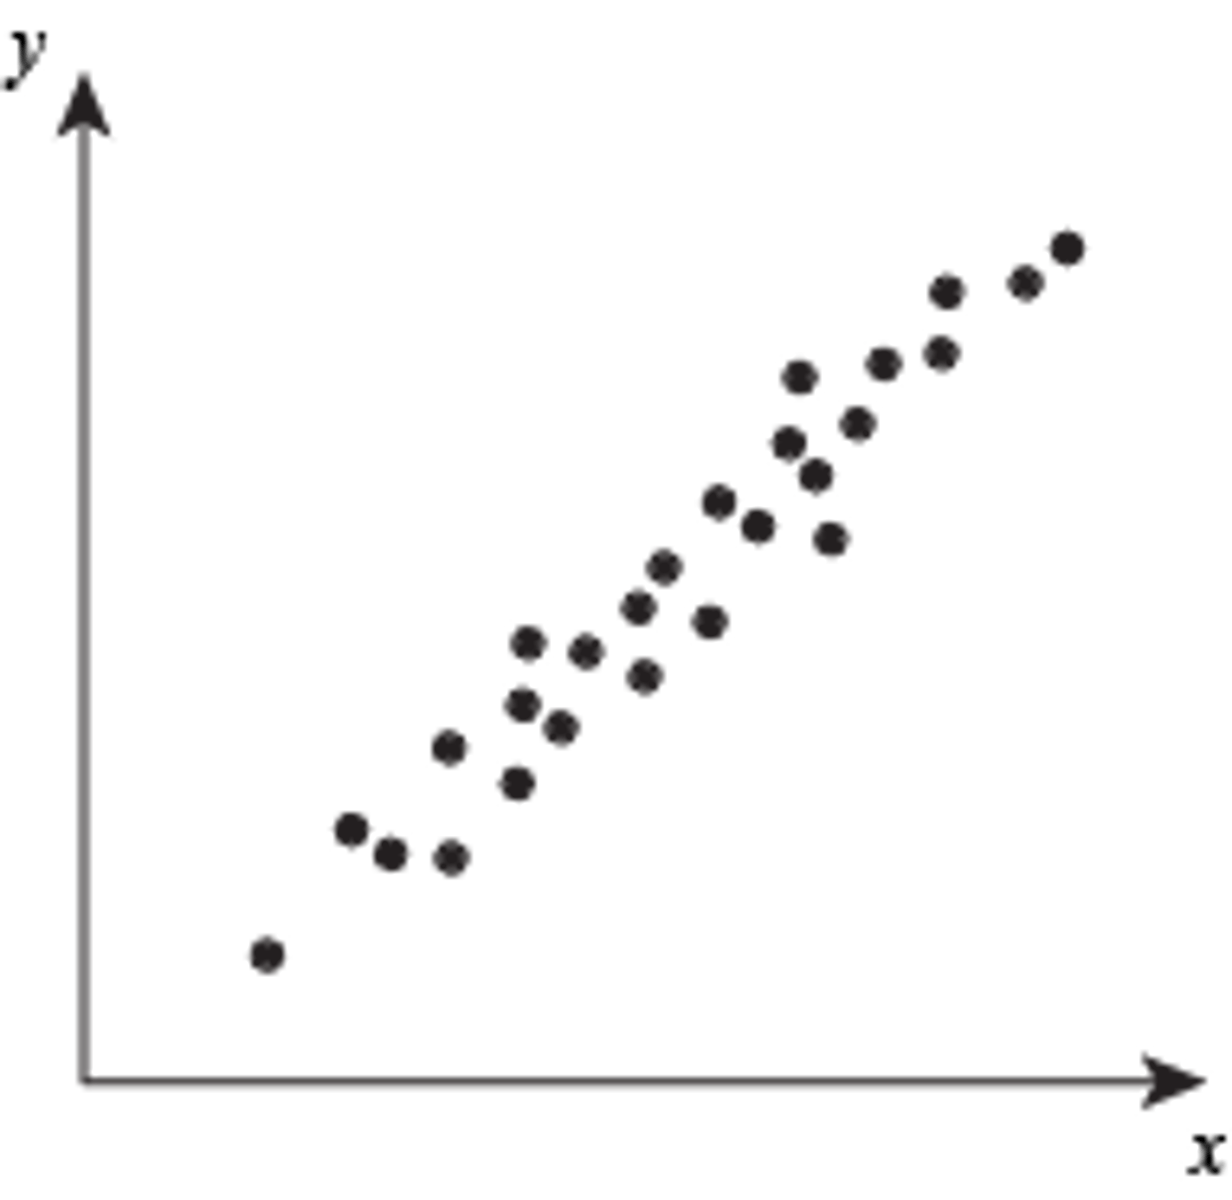
positive correlation
A correlation where as one variable increases, the other also increases, or as one decreases so does the other. Both variables move in the same direction.
EX: As you drink more coffee, the number of hours you stay awake increases
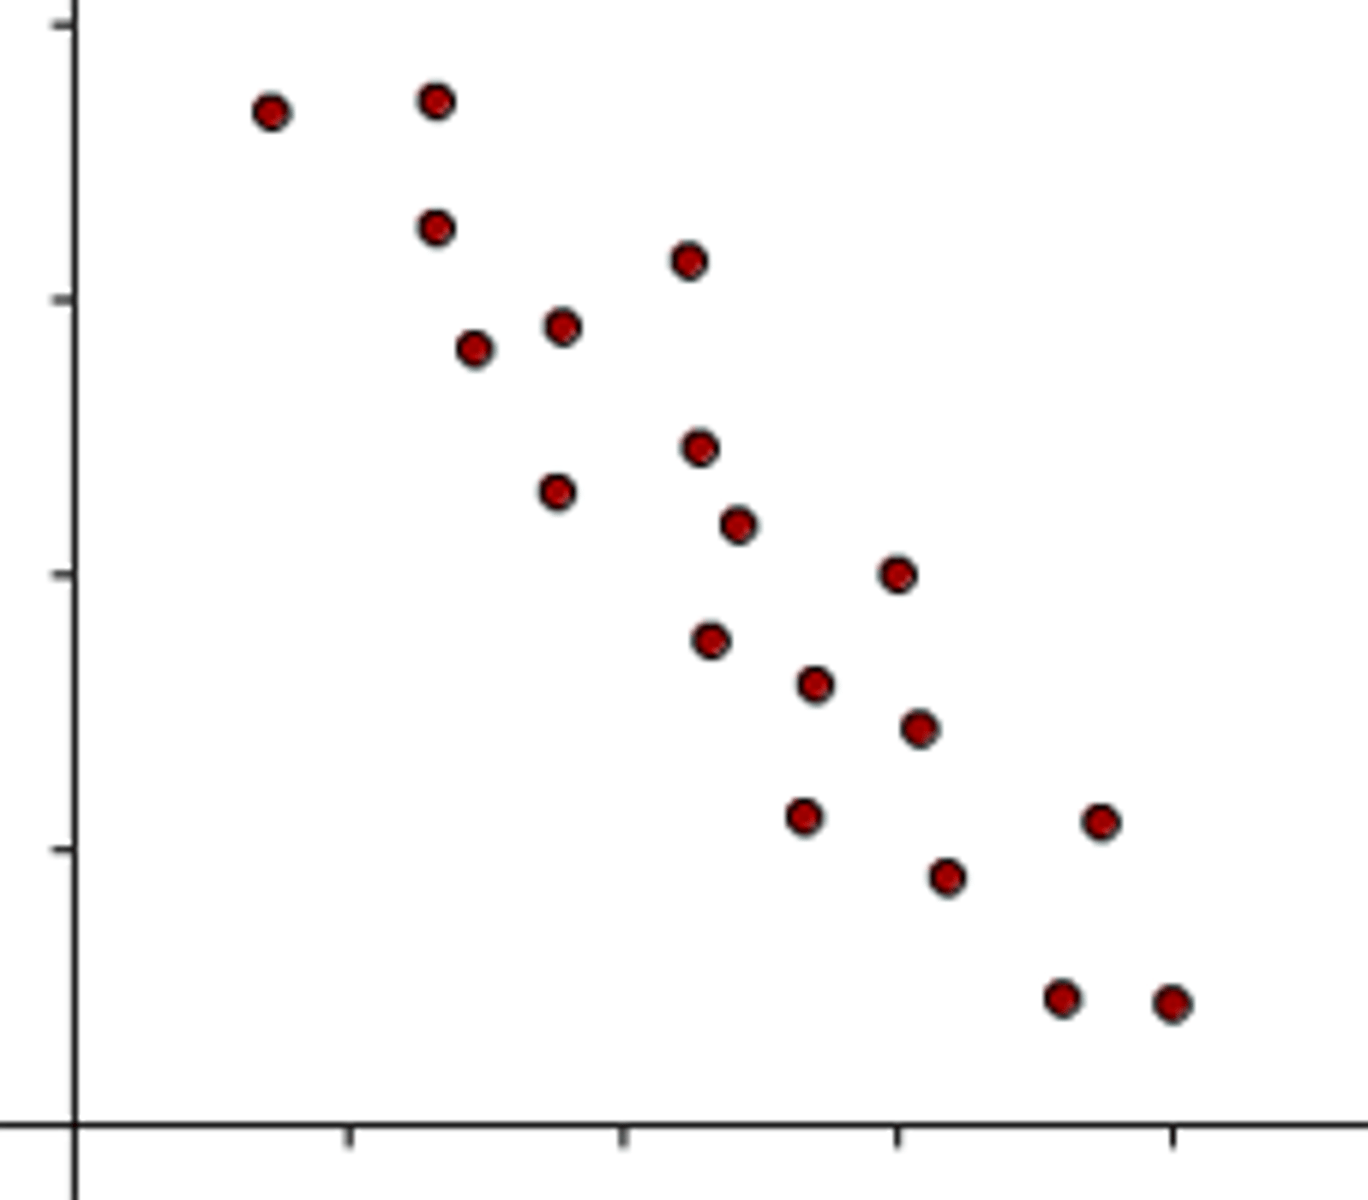
negative correlation
as one variable increases, the other decreases
EX: As snowfall totals increase, the number of people driving decreases
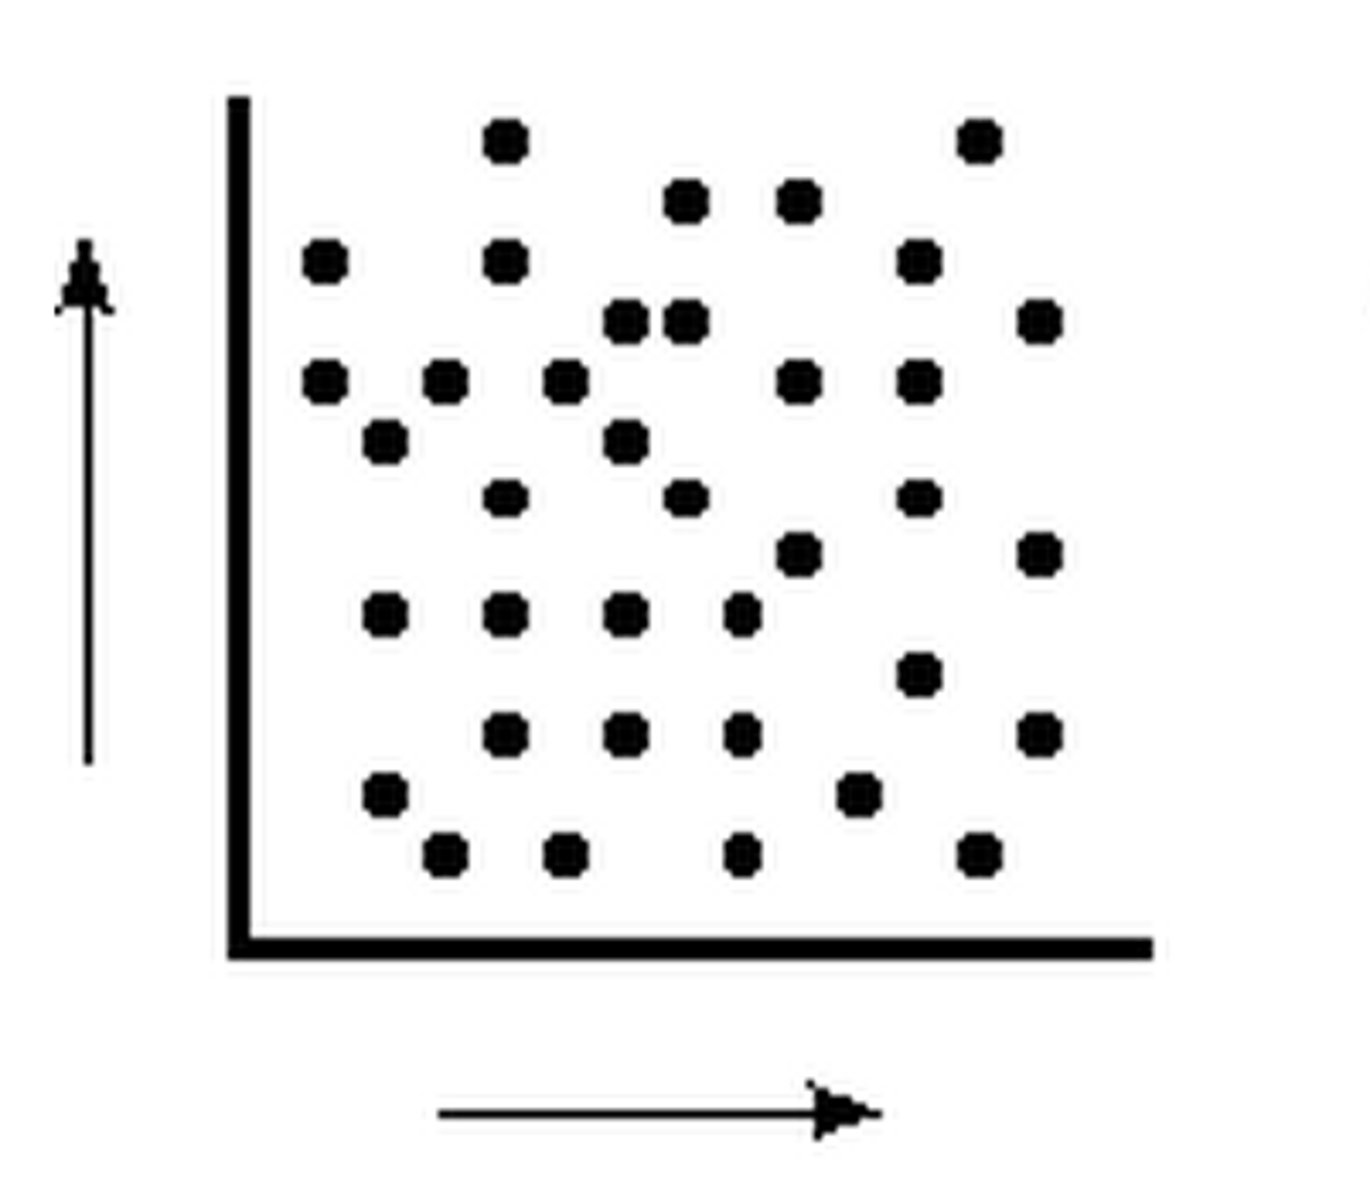
no correlation
there does not appear to be a relationship between two sets of data
regression line
the best fitting straight line to a set of data points. A best fitting line is the line that minimizes the distance from it of all data points that fall
What are the strength sizes for correlation?
.1 = small
.3 = moderate
.5 = large
*Magnitude of the relation does not depend on the direction (positive or negative)
Pearson correlation coefficient formula
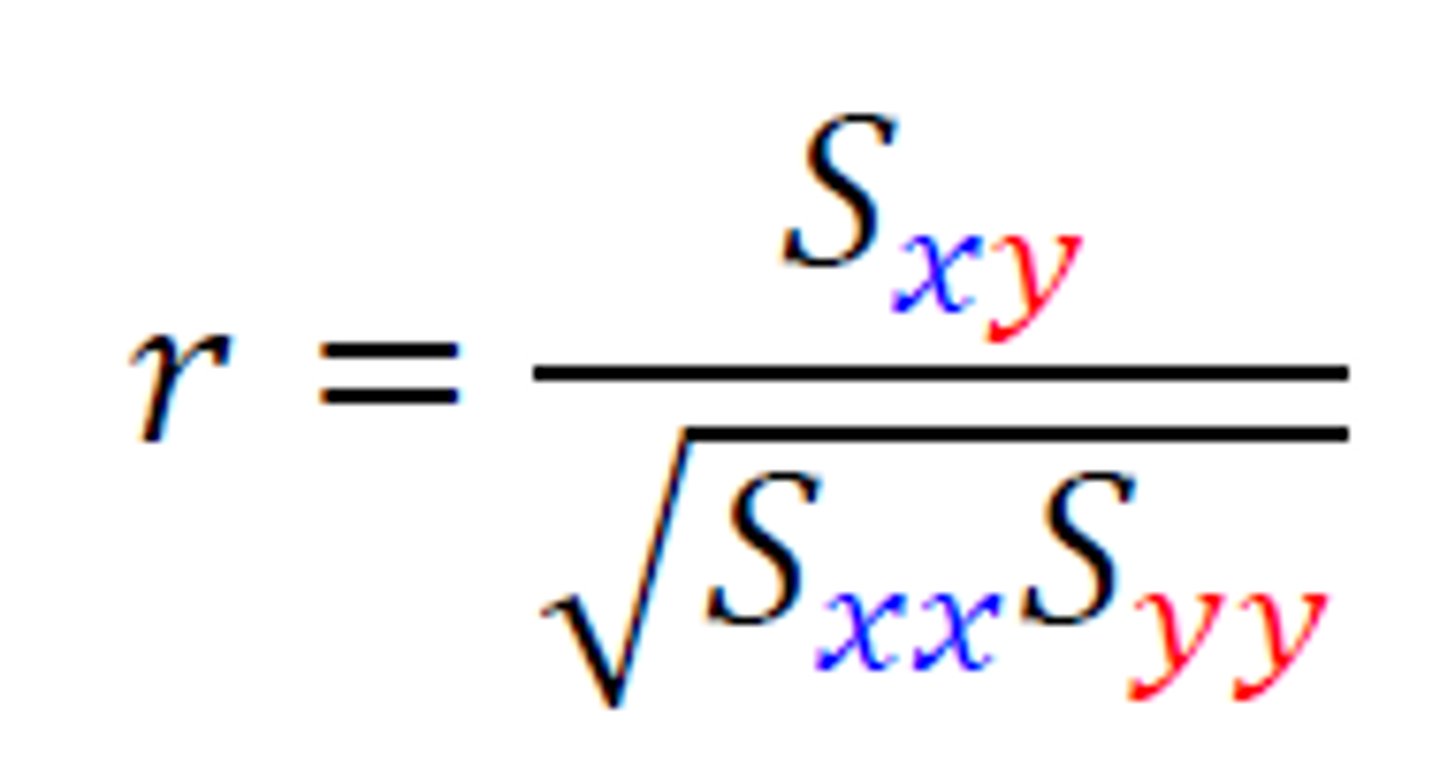
Pearson's correlation coefficient
The Pearson correlation coefficient (r)--used to measure the direction and strength of the linear relationship of two factors in which the data for both factors are measured on an interval or ratio scale of measurement
What is the purpose of the numerator in Pearson's correlation coefficient?
The value in the numerator reflects the extent to which values on the x-axis (X) and y-axis (Y) vary together
What is the purpose of the denominator in Pearson's correlation coefficient?
The value in the numerator reflects the extent to which values on the x-axis (X) and y-axis (Y) vary together
covariance
The extent to which the values of two factors vary together is called
coefficient of determination (r^2)
mathematically equivalent to eta squared, and is used to measure the proportion of variance of one factor (Y) that can be explained by known values of a second factor (X)
-just Person's coefficient squared
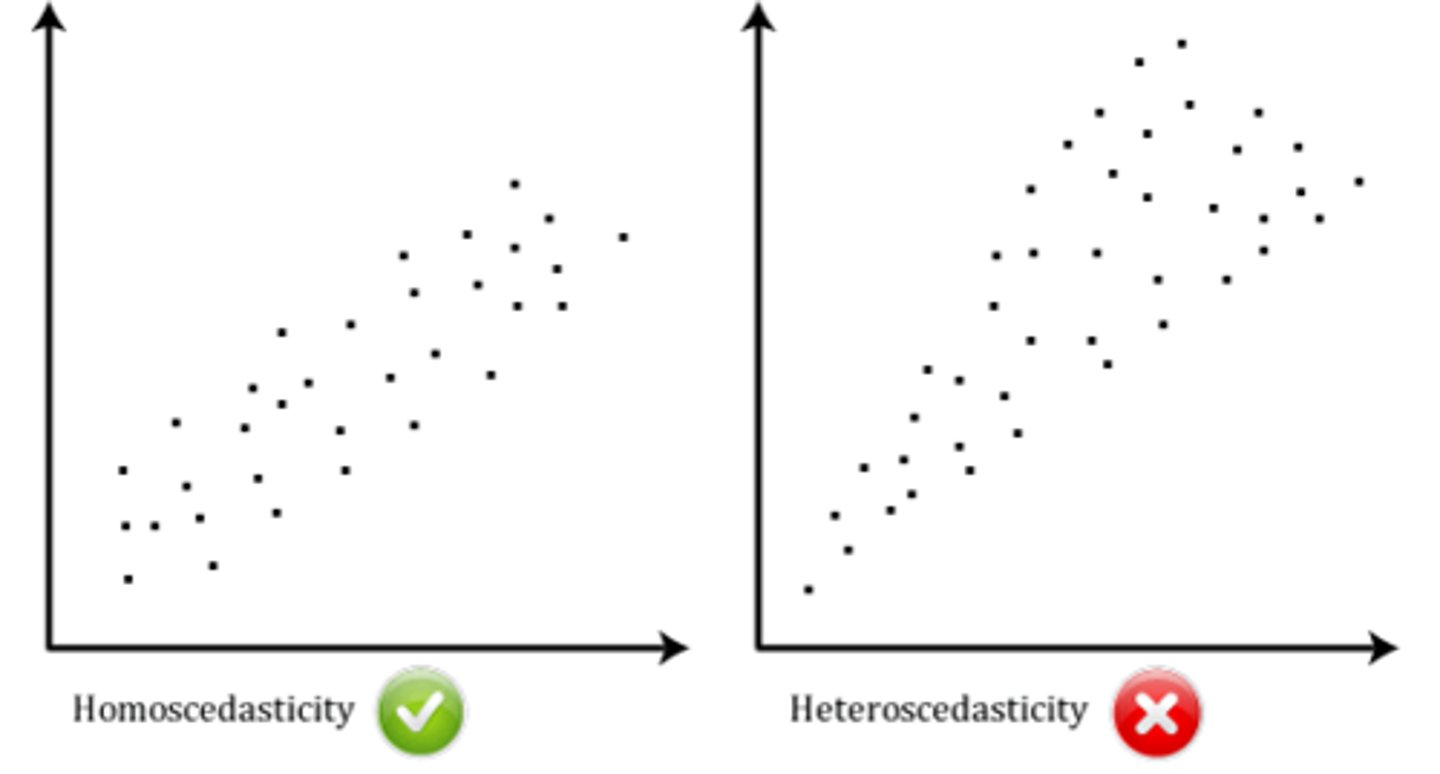
Homoscedasticity
assumption that there is an equal ("homo") variance or scatter ("scedasticity") of data points dispersed along the regression line
what are limits in interpreting correlation?
casualties, spruious relationships, outliers, and restriction of range
casualty
A significant correlation does not show that one factor causes changes in a second factor.
-We cannot infer causality based on correlation alone