Chapter 7 - Macroeconomic Measures of Performance
0.0(0)
Studied by 2 peopleCard Sorting
1/64
Last updated 4:56 PM on 4/1/23
Name | Mastery | Learn | Test | Matching | Spaced | Call with Kai | Chat |
|---|
No analytics yet
Send a link to your students to track their progress
65 Terms
1
New cards
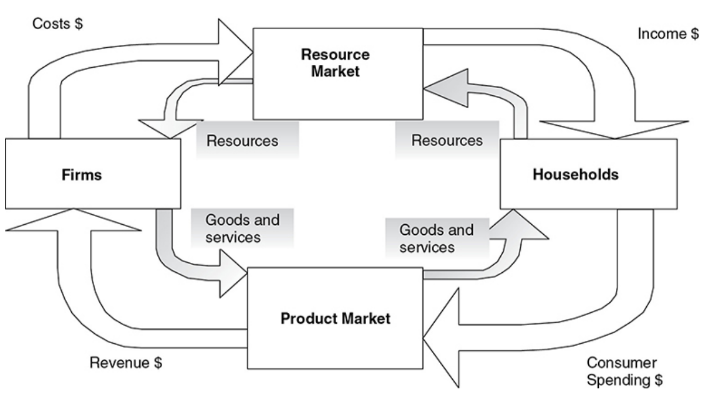
Circular flow of economic activity
A model that shows how households and firms circulate resources, goods, and incomes through the economy
2
New cards
Closed economy
A model that assumes there is no foreign sector (imports and exports)
3
New cards
Aggregation
The process of summing the microeconomic activity of households and firms into a more macroeconomic measure of economic activity
4
New cards
Gross domestic product (GDP)
The market value of the final goods and services produced within a nation in a given period of time
5
New cards
Final goods
Goods that are ready for their final use by consumers and firms, for example, a new Harley-Davidson motorcycle
6
New cards
Intermediate goods
Goods that require further modification before they are ready for final use, e.g., steel used to produce the new Harley
7
New cards
Double counting
The mistake of including the value of intermediate stages of production in GDP on top of the value of the final good
8
New cards
Secondhand sales
Final goods and services that are resold
9
New cards
Nonmarket transactions
Household work or do-it-yourself jobs are missed by GDP accounting
10
New cards
Underground economy
These include unreported illegal activity, bartering, or informal exchange of cash
11
New cards
Aggregate spending (GDP)
The sum of all spending from four sectors of the economy
12
New cards
GDP formula
GDP = C + I + G + (X – M).
13
New cards
Consumer spending (C)
Spending done by customers
14
New cards
Investment spending (I)
Investment is defined as current spending in order to increase output or productivity later
15
New cards
Three general types of investment included in GDP
* New capital machinery purchased by firms.
* New construction for firms or consumers.
* Market value of the change in unsold inventories.
* New construction for firms or consumers.
* Market value of the change in unsold inventories.
16
New cards
Government spending (G)
Purchases made by the govermnet for final goods and services and investments in infrastructure
17
New cards
Net exports (X-M)
X - exports
M - imports
M - imports
18
New cards
Aggregate income (AI)
The sum of all income earned by suppliers of resources in the economy
**Wages + Rents + Interest + Profit**
**Wages + Rents + Interest + Profit**
19
New cards
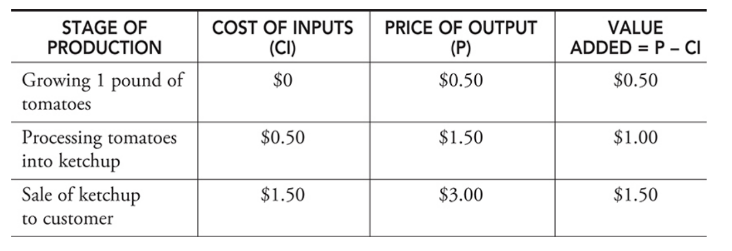
Value-added approach
A third approach to calculating GDP that considers all stages of production of a final good and the value that was added to the final good along the way
20
New cards
Nominal GDP
The value of current production at the current prices
21
New cards
Real GDP
The value of current production, but using prices from a fixed point in time
22
New cards
Deflating the nominal GDP or adjusting it for inflation

23
New cards
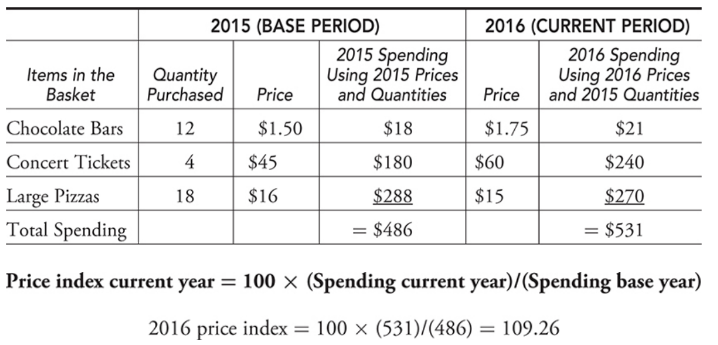
Base year
The year that serves as a reference point for constructing a price index and comparing real values over time
24
New cards
Price index
A measure of the average level of prices in a market basket for a given year, when compared to the prices in a reference (or base) year
25
New cards
Real rate of interest
The percentage increase in purchasing power that a borrower pays a lender.
26
New cards
Calculating real GDP with percentages

27
New cards
GDP price deflator
The price index that measures the average price level of the goods and services that make up GDP
28
New cards
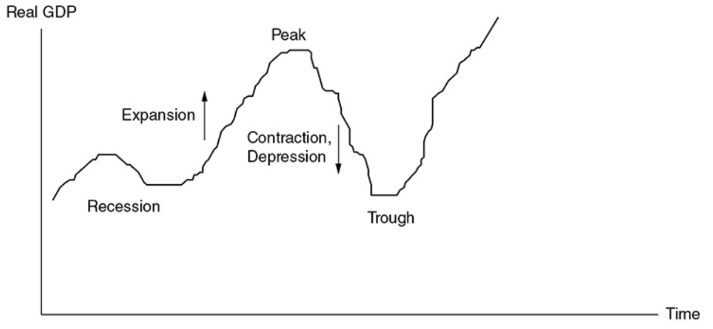
Business cycle
The periodic rise and fall in 4 phases present in economic activity
29
New cards
Expansion
A period where real GDP is growing
30
New cards
Peak
The top of a business cycle where an expansion has ended
31
New cards
Contraction
A period where real GDP is falling
32
New cards
Recession
Unofficially defined as two consecutive quarters of falling real GDP
33
New cards
Depression
A prolonged, deep contraction in the business cycle
34
New cards
Trough
The bottom of the cycle where a contraction has stopped
35
New cards
Consumer price index (CPI)
The price index that measures the average price level of the items in the base year market basket
36
New cards
Main measure of consumer inflation
Consumer price index (CPI)
37
New cards
Market basket
A collection of goods and services used to represent what is consumed in the economy
38
New cards
Inflation
The percentage change in the CPI from one period to the next
39
New cards
Annual rate of inflation on goods consumed by the typical consumer
The percentage change in the CPI from one year to the next
40
New cards
CPI
based on a market basket of goods bought by consumers, including products produced abroad

41
New cards
Measure of inflation of only consumer goods
CPI
42
New cards
GDP deflator
includes all items that make up domestic product
43
New cards
broader measure of inflation
GDP deflator
44
New cards
Nominal income
Todays income measured in todays dollars
45
New cards
Real income
Todays income measured in base year dollars

46
New cards
Expected Inflation
When inflation is predictable, people can plan accordingly. The bank adds an inflation factor on the real rate of interest to create a nominal rate of interest that savers receive and borrowers pay.

47
New cards
who does unexpected inflation hurt
Hurts employees if real wages are falling, as well as fixed-income recipients, savers, and lenders.
48
New cards
who does unexpected inflation help
Helps firms if real wages are falling, as well as borrowers. It might also increase the value of some assets like real estate or other properties.
49
New cards
Difficulties with CPI
* Consumer substitute
* Goods evolve
* Quality differences
* Goods evolve
* Quality differences
50
New cards
Consumer substitute
As the price of goods begins to rise, we know that consumers seek substitutes
51
New cards
Goods evolve
The emergence of new products (smartphones) and extinction of others (manual typewriters) is understood by firms and consumers, but the market basket must reflect this or it risks becoming irrelevant
52
New cards
Quality differences
Some price increases are the result of improvements in quality
53
New cards
Employed
A person is employed if they have worked for pay at least one hour per week
54
New cards
Unemployed
A person is unemployed if they are not currently working but are actively seeking work
55
New cards
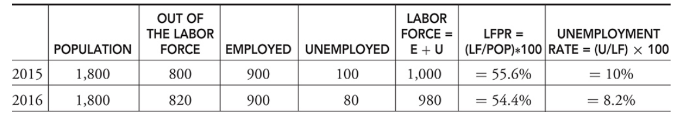
Labor force
The sum of all individuals 16 years and older who are either currently employed (E) or unemployed (U)
\
* **LF = E + U.**
\
* **LF = E + U.**
56
New cards
Out of the labor force
A person is classified as out of the labor force if they have chosen to not seek employment
57
New cards
Labor force participation
The ratio of the size of the labor force to the size of the population 16 years and older
\
* **LFPR = (LF/Pop)*100.**
\
* **LFPR = (LF/Pop)*100.**
58
New cards
Unemployment rate
The percentage of the labor force that falls into the unemployed category
\
* **UR = 100 × U/LF.**
\
* **UR = 100 × U/LF.**
59
New cards
Discouraged workers
Citizens who have been without work for so long that they become tired of looking for work and drop out of the labor force
60
New cards
Frictional unemployment
A type of unemployment that occurs when someone new enters the labor market or switches jobs
61
New cards
Seasonal unemployment
A type of unemployment that is periodic, is predictable, and follows the calendar
62
New cards
Structural unemployment
A type of unemployment that is the result of fundamental, underlying changes in the economy such that some job skills are no longer in demand
63
New cards
Cyclical unemployment
A type of unemployment that rises and falls with the business cycle
64
New cards
Full employment
Exists when the economy is experiencing no cyclical unemployment
65
New cards
Natural rate of unemployment
The unemployment rate associated with full employment, somewhere between 4 to 6 percent in the United States