Economics Mock Exam March 2026
1/124
Earn XP
Description and Tags
Paper 2; ALL CONTENT (EXCLUDING HL)
Name | Mastery | Learn | Test | Matching | Spaced | Call with Kai |
|---|
No analytics yet
Send a link to your students to track their progress
125 Terms
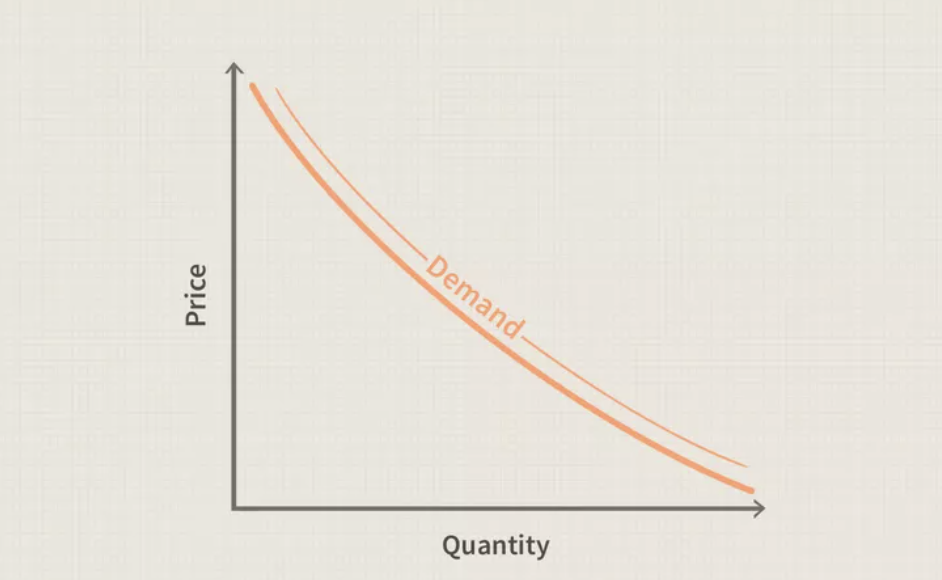
Law of demand
As price of product goes down, quantity demanded increases, ceteris paribus
Non-price determinants of demand (shift in demand)
Income (normal/inferior goods)
Price of related goods (substitutes/complements/unrelated goods)
Taste and preferences
Future price expectations
Number of consumers
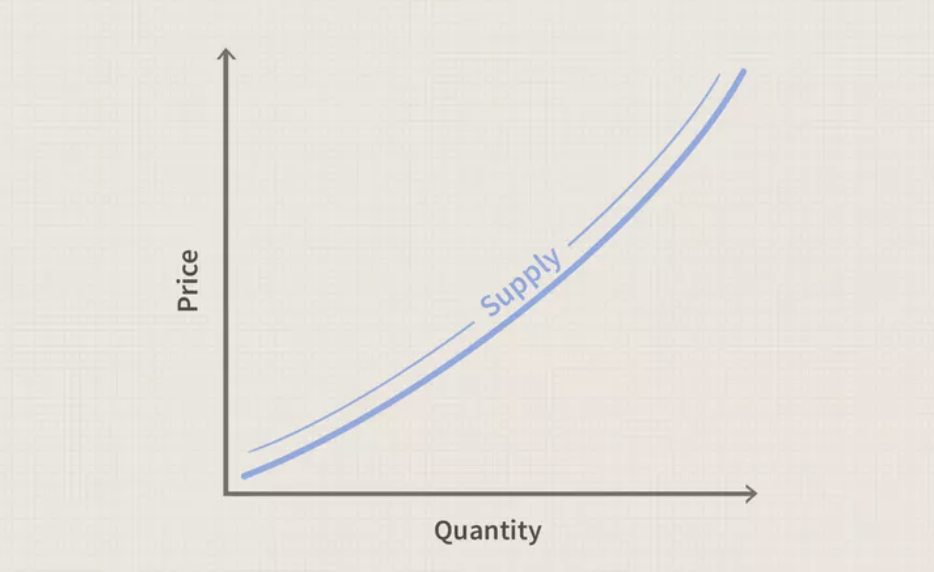
Law of supply
As price of product rises, the quantity supplied increases, ceteris paribus
Non-price determinants of supply
Costs of factors of production
Price of related goods (joint/competitive supply)
Government intervention (indirect taxes/subsidies)
Expectations on future prices
Changes in technology
Weather/natural disasters
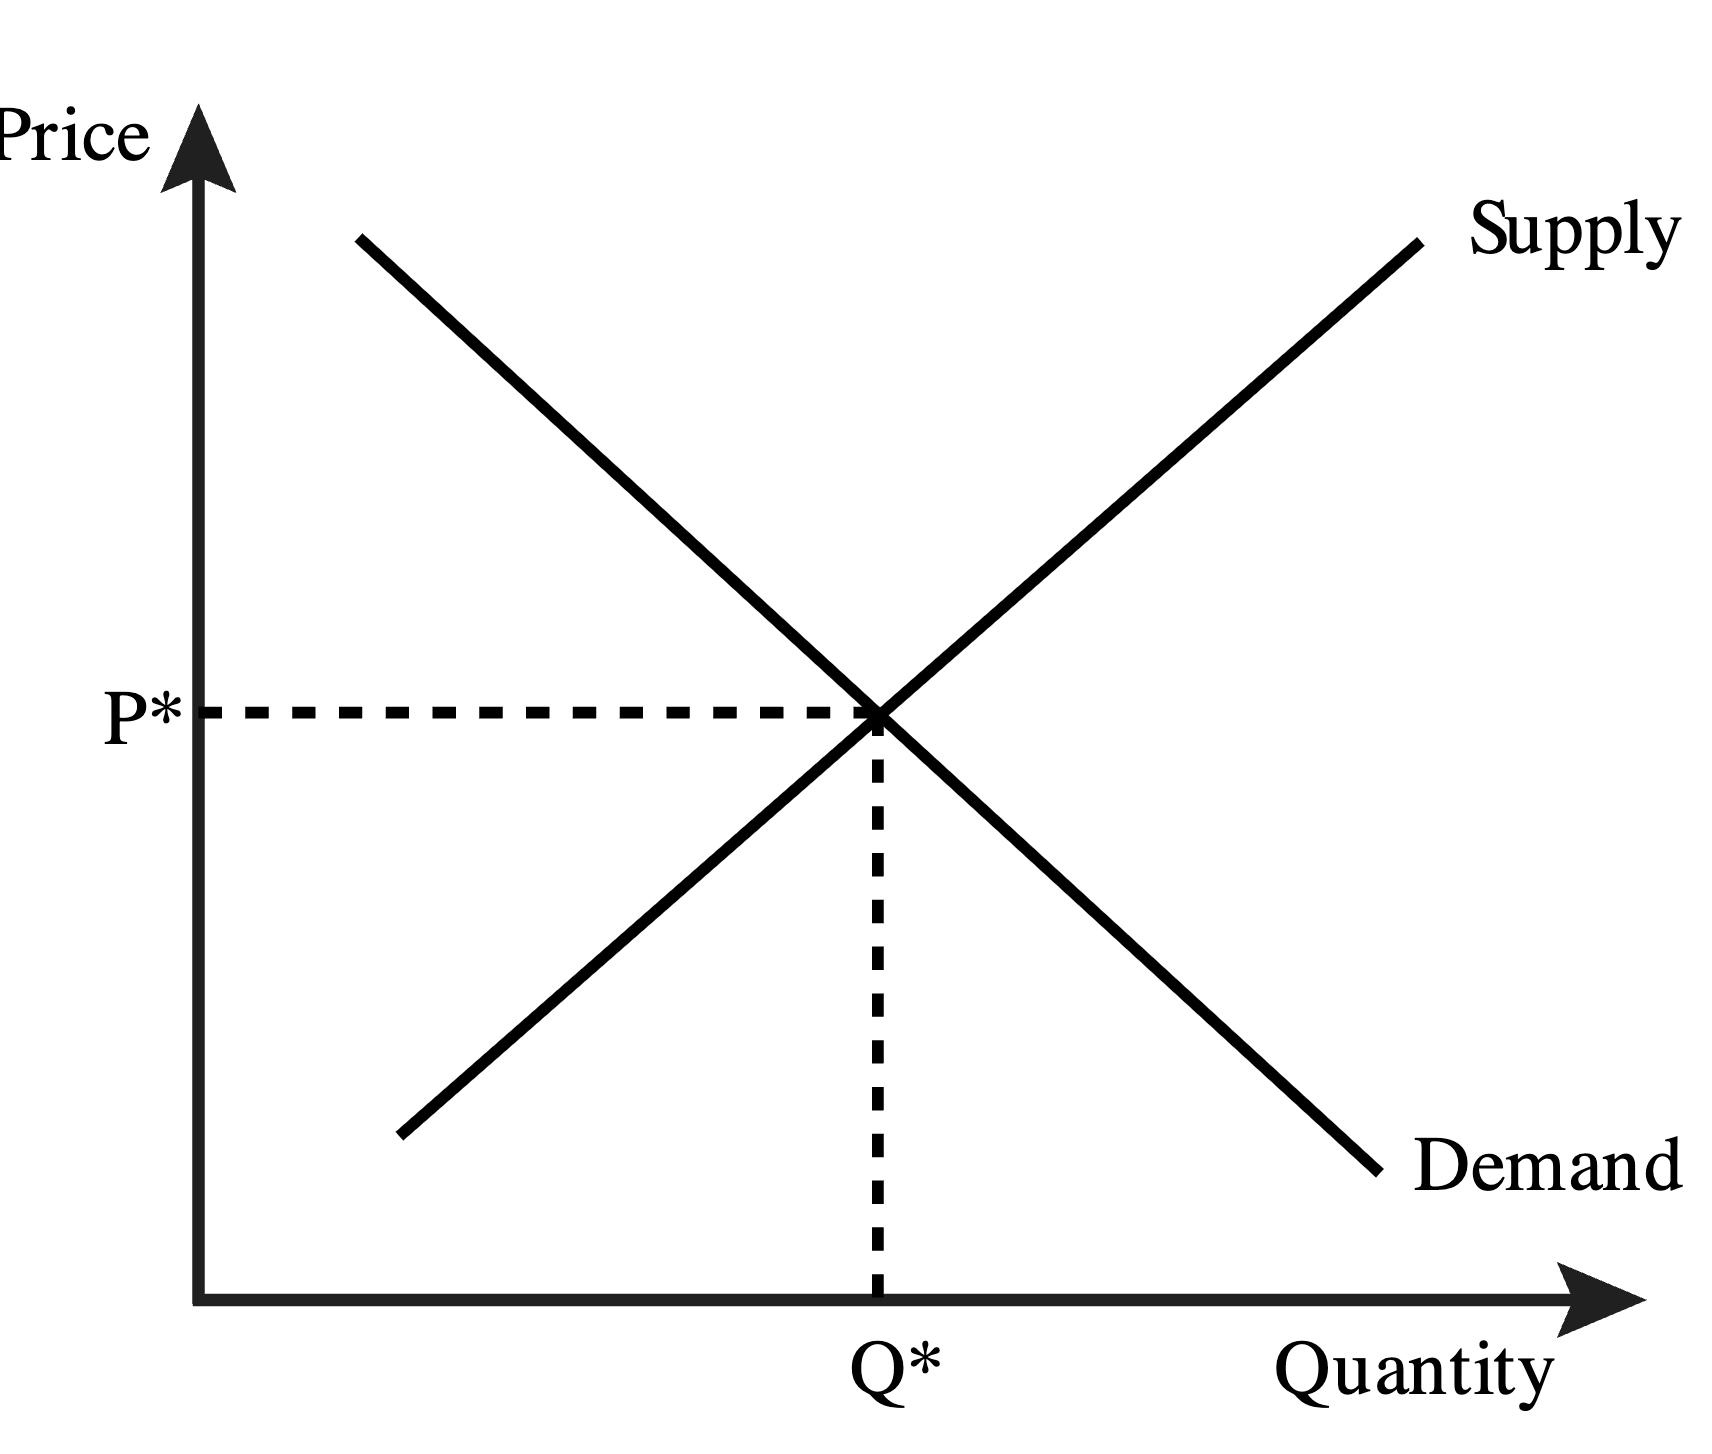
Market equilibirum
Point where supply meets demand, so both buyers/sellers are satisfied with the price and quantity in the market (profits and utility are maximized at market clearing price)
Allocative efficiency
Resources were used to productively meet societies’ wishes
Signalling function
Type of price mechanism to signal information to consumers and producers (set by actions in the market, reflecting of change)
Rationing function
Type of price mechanism to ration scarce resources by price
Incentive function
Type of price mechanism to incentivize producers and consumers to either increase prices, buy more, or by less (which lowers price)
Price elasticity of demand
Extent to which demand for a good or service will be affected as a result of change of one its price
PED formula
Change in demand / change in price
(New - old / old) / (New - old / old)
If price is elastic, total revenue…
Increases as price decreases, or decreases as price increases, demand is changed
If price is inelastic, total revenue…
Increases as price increases, or decreases as price decreases, demand is unchanged
Determinants of PED
Availability of substitutes
Necessity of a product
How widely the product is defined (iPhones vs smartphones as a whole)
Proportion of income spent
Time period considered
Importance of PED for government decision-making
Provides a view to determine taxing and subsidies
Example: Government placing tax on fuel, allowing firms to raise price without major changes in demand as it is inelastic
Income elasticity of demand
Measure of how much the demand for a product changes when there’s a change in consumer income
YED formula
Change in demand / change in income
(New - old / old) / (New - old / old)
If YED is positive, the good is...
A normal good (inelastic)
If YED is negative, the good is…
An inferior good (elastic)
If YED is between 0-1, the good is…
A necessary good (elastic)
If YED > 1, the good is…
A luxury good (elastic)
Price elasticity of supply
The extent to which quantity supplied is impacted by variations in price
PES formula
Change in supply / change in price
(New - old / old) / (New - old / old)
Determinants of PES
How much costs rise as output rises (unused capacity/mobility of factors)
Time period considered (immediate/short/long-term)
Ability to store stock
Why governments intervene markets in the first place
Have the ability to support households, firms, influence consumption, production, protect consumers from monopolistic issues, promote well-being, earn revenue, etc.
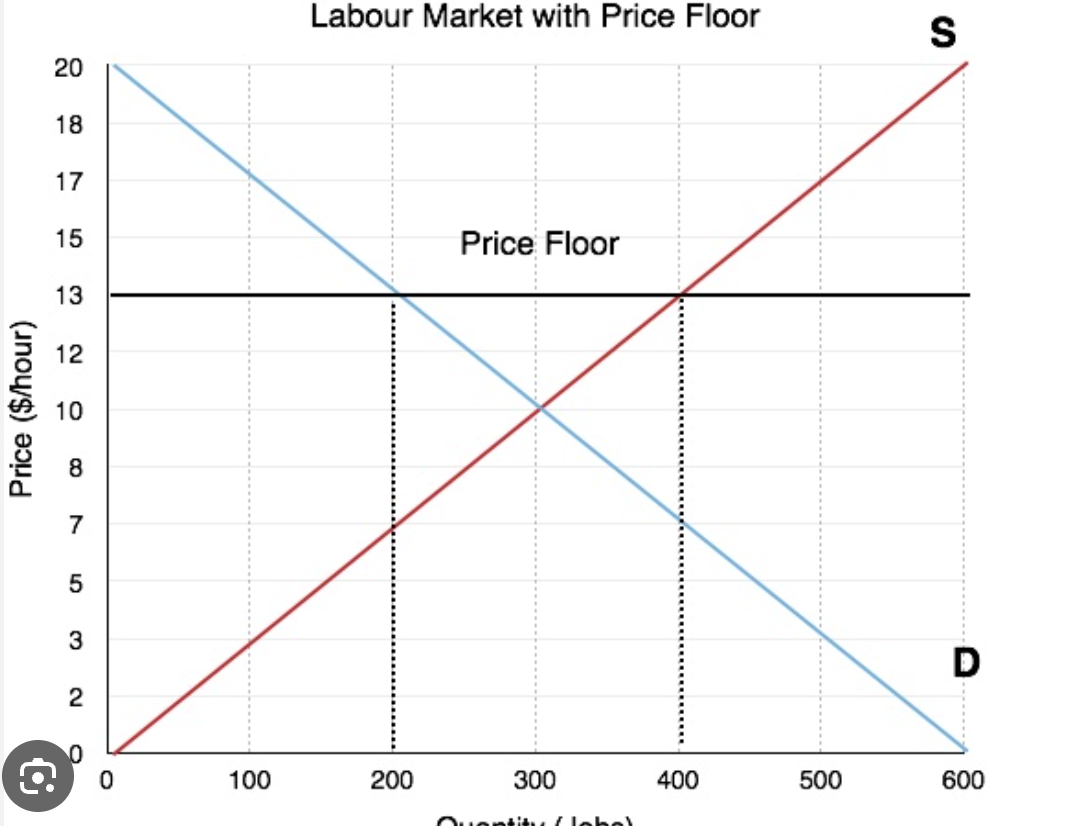
Price floors
Government intervenes by setting a minimum price that prevents producers from reduce price (price is set above equilibrium), to raise income for producers, protect workers, which leads to excess supply
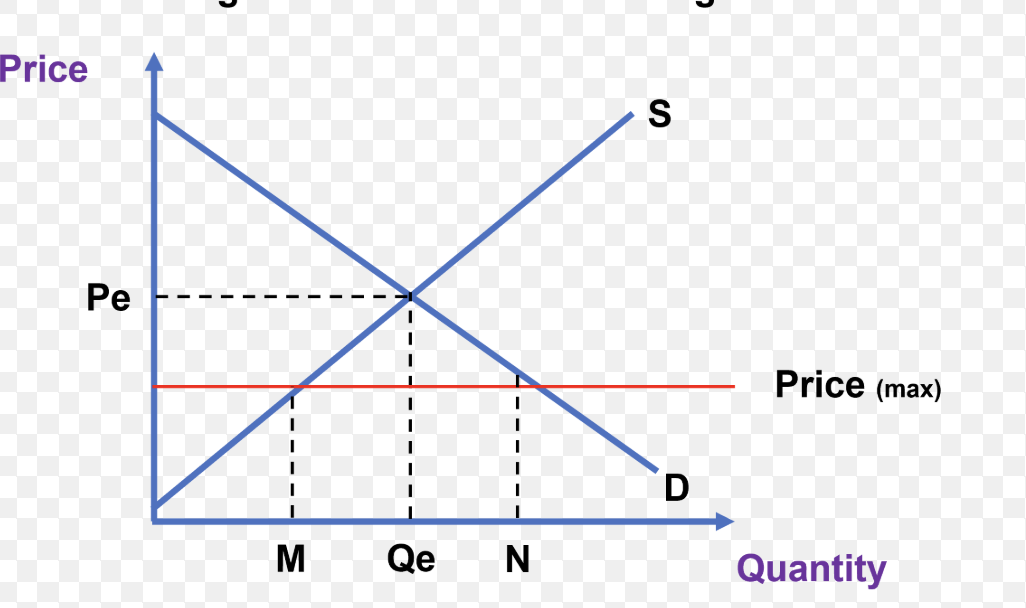
Price ceilings
Government intervenes by setting a maximum price that prevents producers from raising price above equilibrium (price is set below equilibirum), to help consumers in markets of necessity goods, ensuring affordability, which leads to excess demand
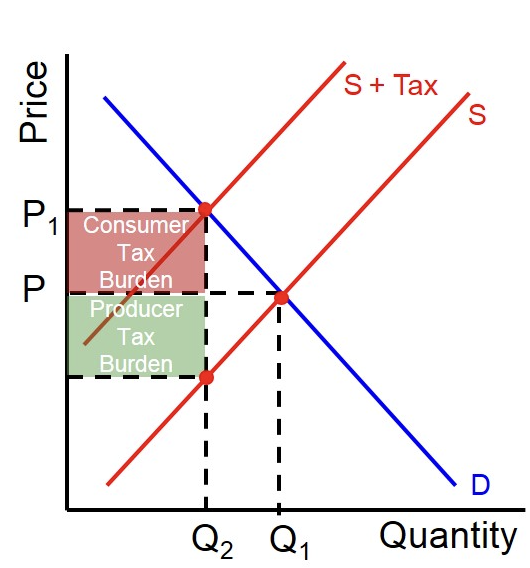
Indirect taxes
Tax imposed by the government on producers for goods and services (e.g., VAT, excise duties), increasing costs and shifting supply left, reduces consumption and raises revenue
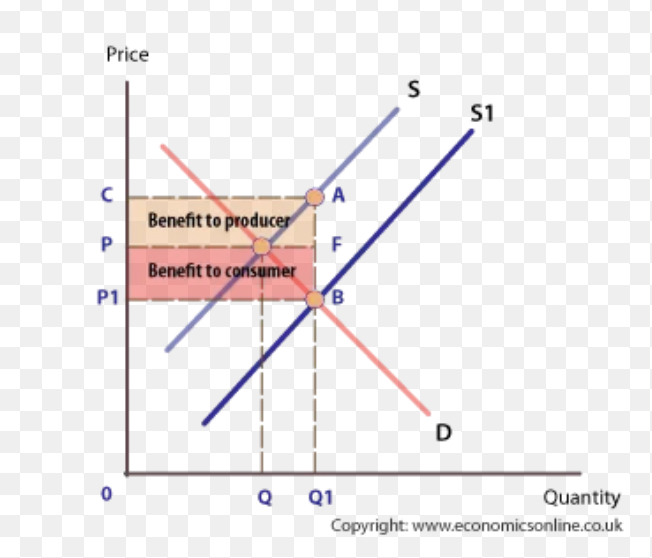
Subsidies
Government payment to producers to lower production costs, shifting supply right to increase output and lower prices
Tax burden diagram
Where consumer + producer burden = government revenue
Subsidy burden diagram
Where benefit to consumer + benefit to producer = government loss
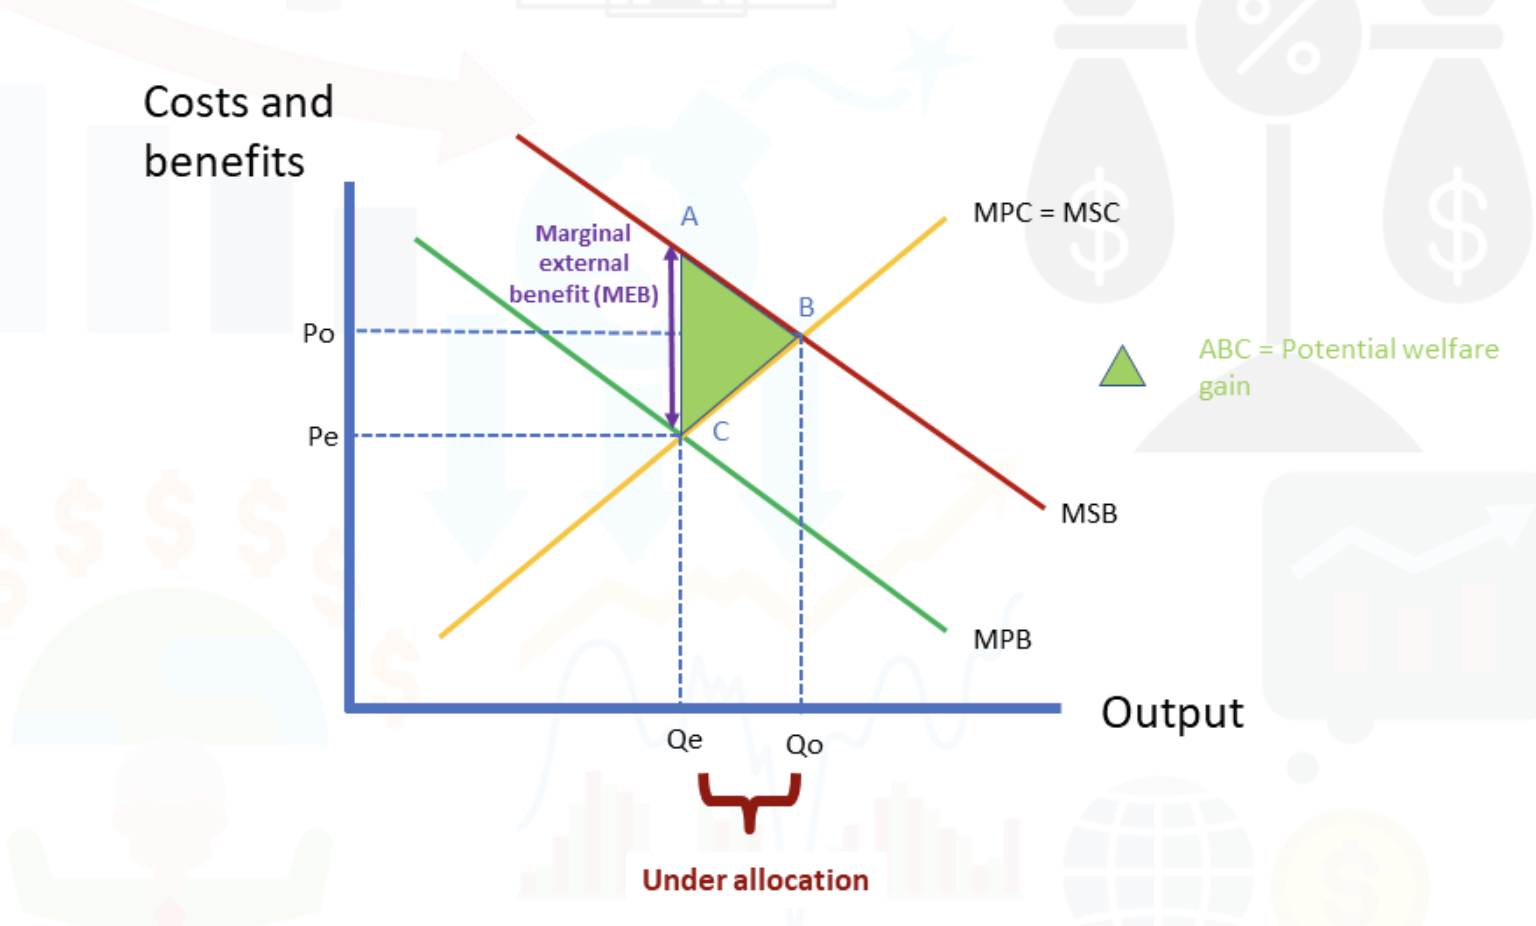
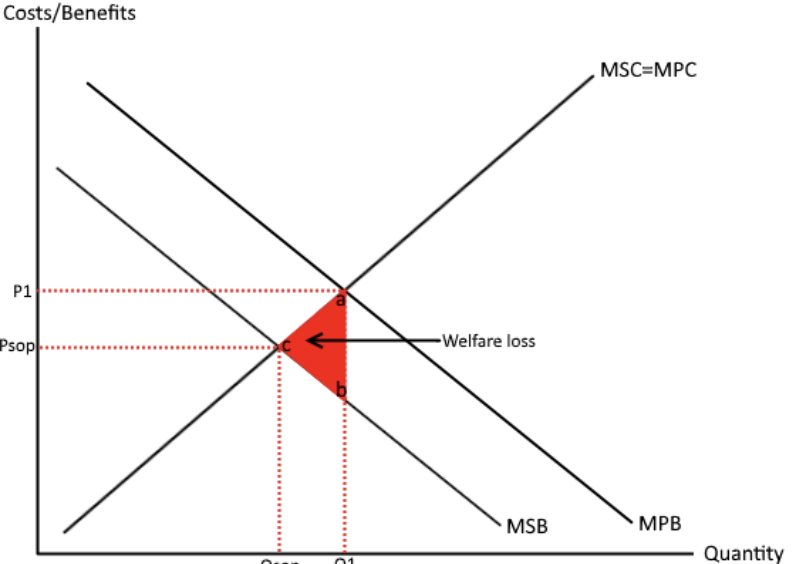
Positive externalities of consumption
When an individual's consumption of a good or service provides an unintended benefit to a third party (society)
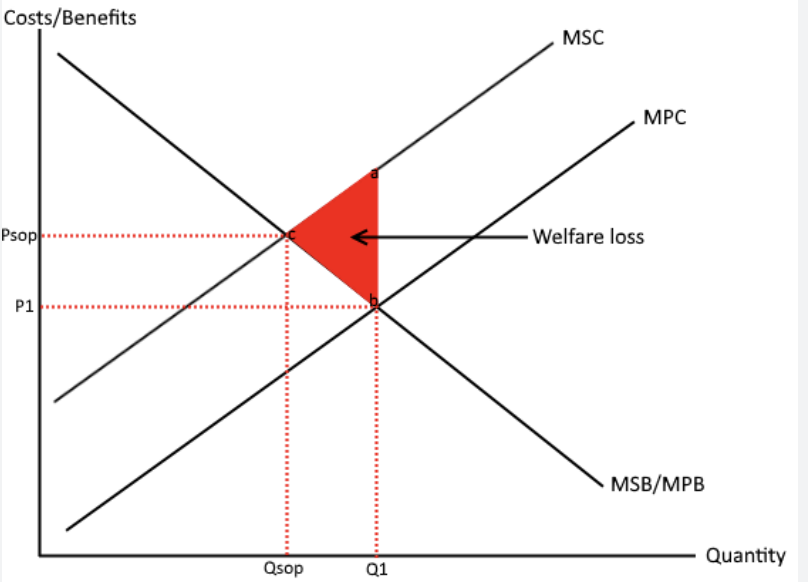
Positive externalities of production
When the production of a good or service creates benefits for third parties not involved in the market transaction
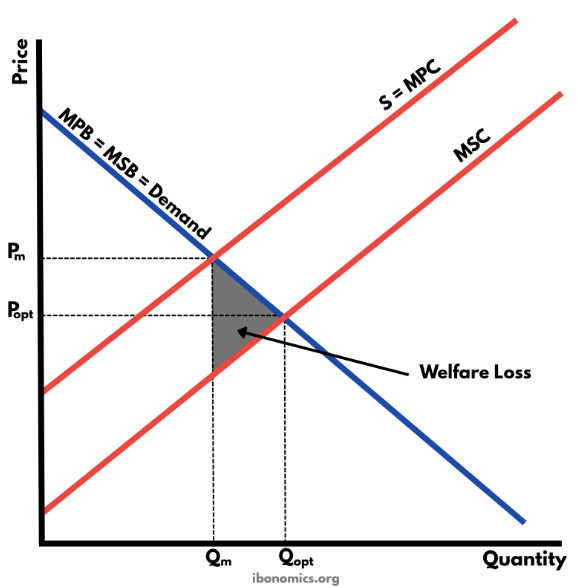
Negative externalities of consumption
When an individual's consumption of a good or service imposes external costs on third parties, resulting in market failure where the MPB > MSB
Negative externalities of production
Costs imposed on third parties (society, environment) arising from the production of a good, which are not reflected in the market price, when MSC > MPC
Merit goods
Goods that are beneficial to consumer but people may not consume enough because they ignore the potential benefits (imperfect information), where demand of it is lower than it should be (like vaccines, university, sports, etc.)
Demerit goods
Products or services such as tobacco, alcohol, and junk food, that are harmful to consumers and society, resulting in overconsumption and market failure, and a negative externality of consumption
Common pool resources
Natural resources that are difficult to exclude people from (fishing grounds, forests, etc.,), which are rivalrous and result in the tragedy of the commons and negative externalities
International agreements on negative externalities and common pool threats
Intended agreements that are legally binding with the primary purpose of preventing the abuse of human impact on natural resources
Ex. UN Framework Convention Paris Agreement
Tradable permits
Market-based approach which limits access to a resource, where the permission can be traded around, which allows incentive to adopt cleaner technology and sustainable action-making
Carbon tax
Tax imposed when fossil fuels are burned, eliminating the negative externality (Pigouvian tax), to incentivize reduction of electric consumption, and carbon emissions, generating government revenue
Subsidies reducing negative externalities and threats to common pool resources
Governments allocating funds to reduce costs to producers to make energies that are sustainable more affordable, with cooperation needed
Improving positive externally knowledge on explaining benefits
Using advertising public campaigns to mitigate the imperfect information that consumers may have, shifting MPB curve to MSB curve
Legislation on achieving potential welfare gain
Passing laws to insist certain actions of positive externalities (like requiring vaccinations), but could be seen as infringing
Public goods
Goods not to be provided in a free market (national defense, flood barriers, streetlights, etc.,), which are non-excludable, non rivalrous, but causes the “free-rider problem”, direct provision may be needed (using tax payers money), or private partnership
National income
Total value of all final goods and services produced by a country's factors of production, or the total income earned by residents, within a specific period (usually a year)
GDP (Gross Domestic Product)
Total value of final goods/services produced in a national (domestic) economy
GNI (Gross National Income)
Total income earned by a country’s factors of production regardless of where assets are located
(Nominal) GDP formula
C + I + G + (X - M)
Where…
C = Consumption
I = Investment
G = Government Spending
X = Exports
M = Imports
Real GDP/GNI
When the GDP/GNI have been adjusted for inflation
Real GDP formula
(Nominal GDP / GDP deflator) x 100
GDP Deflator formula
(Real GDP / Nominal GDP) x 100
OECD Better Life Index
Measure of economic well-being that promotes policies to improve socio-economic well-being including 35+ countries and key members, allowing for comparison of well-being across countries based on 11 essential topics (material living, quality of life)
Happiness Index
Measure of economic well-being put by the UN sustainable development solutions to rank happiness levels and immigration, drawn from polls
Happy Planet Index (HPI)
Measure of economic well-being that measures sustainable well-being taking account of sustainability
GDP/GNI per capita formula
total GDP/GNI / size of population
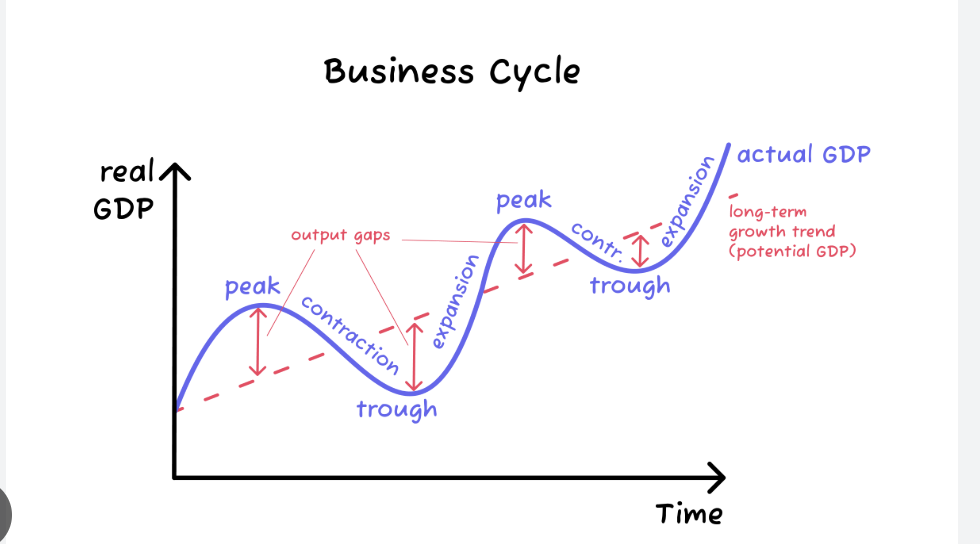
Business cycle + phases
Graph that shows periods of growth and slow/falling growth of GDP/output over time
Phases: boom, recession, trough, recovery
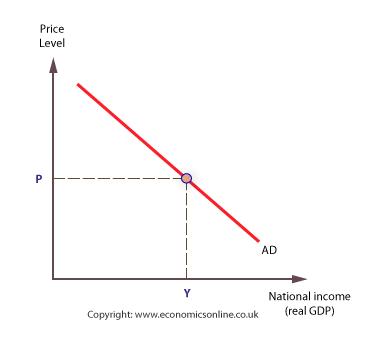
Aggregate demand
Total spendings on goods and services in a period of time at a given price level
Graph shows relationship between average price level and real output
Determinants of aggregate demand
Consumption (spendings on goods/services domestically)
Can change due to income taxes, interest rates, wealth, expectations/confidence, debtness
Investment (additional capital to economy)
Can change due to interest rates, business taxes, tech changes, expectations/confidence, debtness
Government spending (on health, edu, law, etc.)
Can change due to political/economic priorities
Net exports
+ net = trade surplus —> shift right
- net = trade deficit —> shift left
Can change due to export levels or import levels
Aggregate supply
Total amount of goods/services that all industries produce at every given price level
—> sum of supply curves in ALL industries in the economy
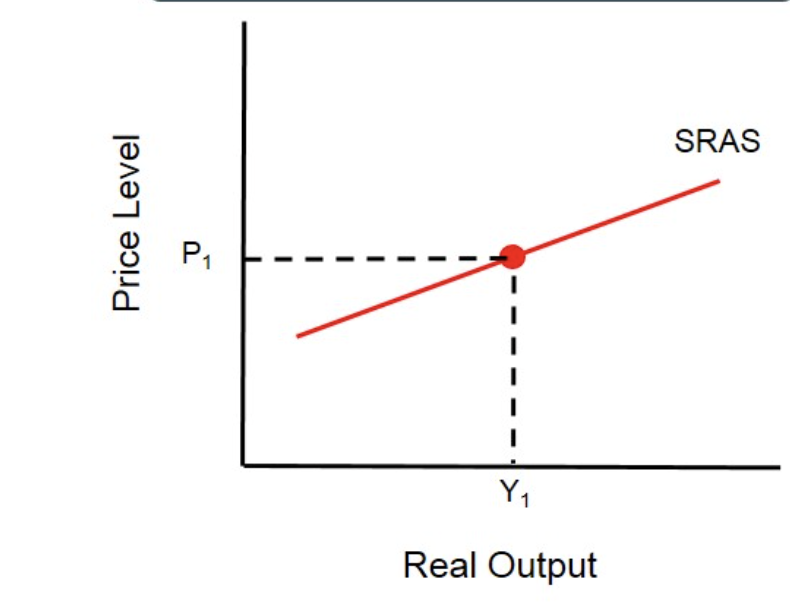
Short-run AS
Positive relationship between price level and amount of output that a country’s industry may supply
Factors of production don’t change
Price of labour is fixed
Larger level of output = higher average costs of production
Determinants of SRAS (supply-side shocks)
Change in costs of production
Wage rates, raw materials, imports, taxes/subsidies
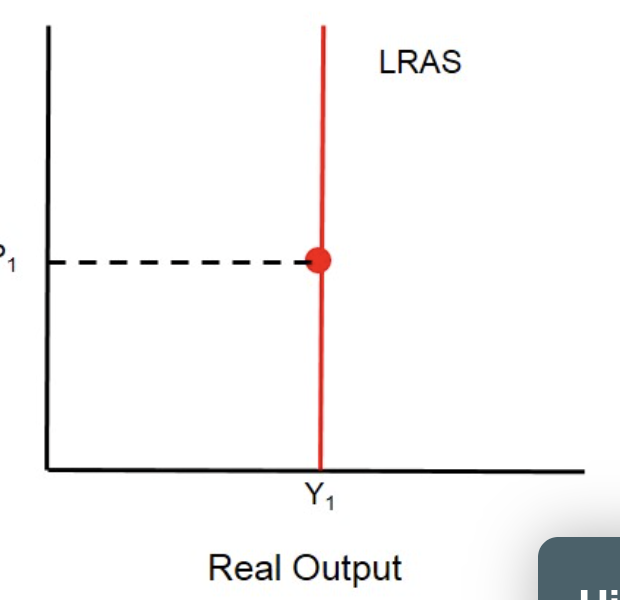
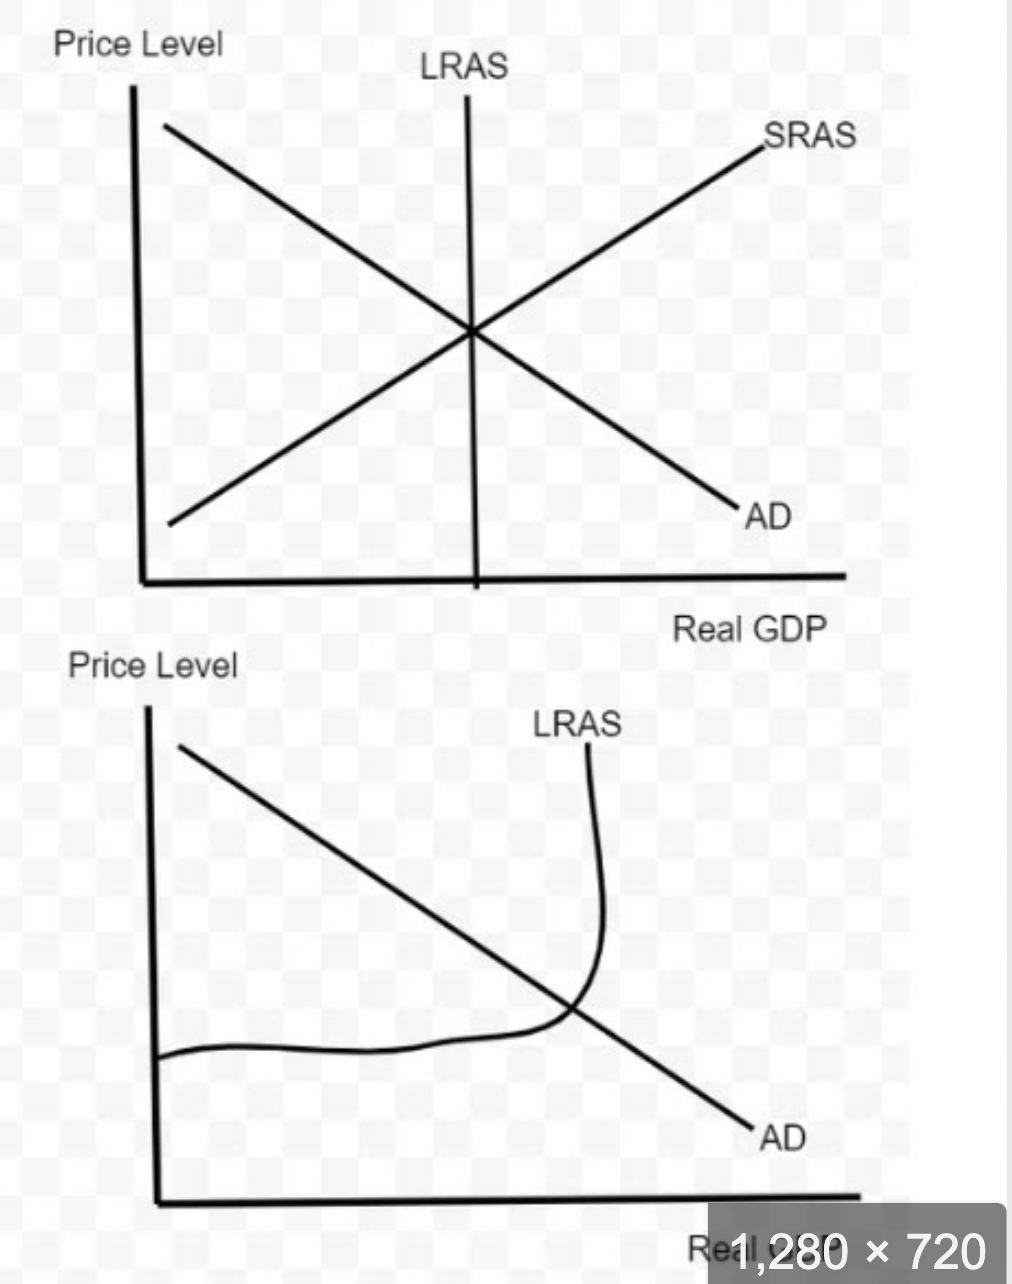
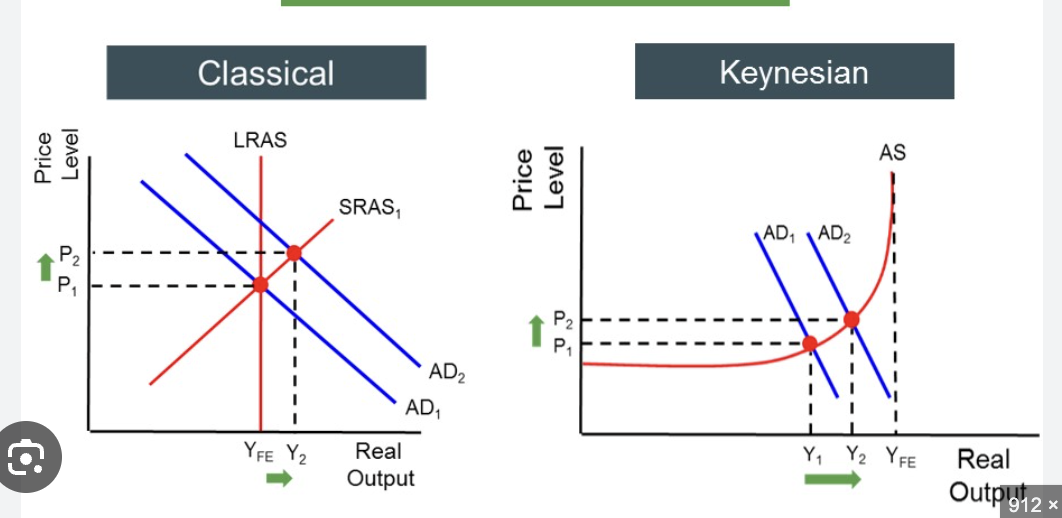
Neo classical Long-run AS
Curve viewed as perfectly inelastic/vertical, known as “full employment level of output” —> where output is at FULL CAPACITY, also assumes that potential output is based entirely on quantity/quality of factors of production
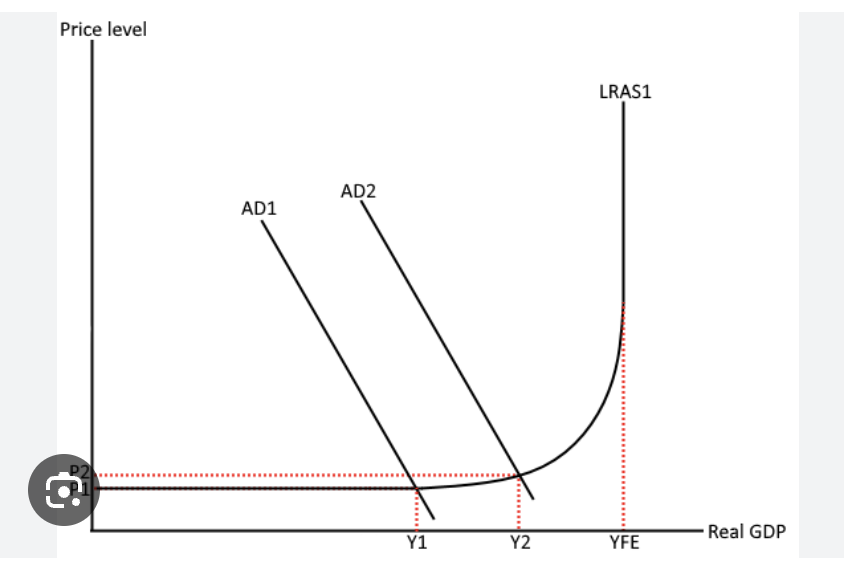
Keynesian AS
Shows 3 possible phases and doesn’t distinguish between short/long-run
Phase 1: Perfectly elastic at low levels of economic activity, producers raise levels without having larger costs due to SPARE CAPACITY
Phase 2: Spare capacity used up, factors are scarce, price will rise for higher costs
Phase 3: Impossible to increase output further, perfectly inelastic
Determinants of Keynesian/Neoclassical AS curves
Will shift as country’s factors of production change
Tech changes (land), birth rate (labour), investment (capital)
Supply-side policies (interventionist or market-based)
Macroeconomic equilibrium
Point where AD=AS, national income = level of output a country produces, short and long-run are existent
Short-run: Output produced = total demand, no reason for prods to change output, no up/down pressure
Neo Long-run: Economy always move at full employement level of output, impact of AD —> price levels
Keynesian Long-run: Occurs at different levels/phases
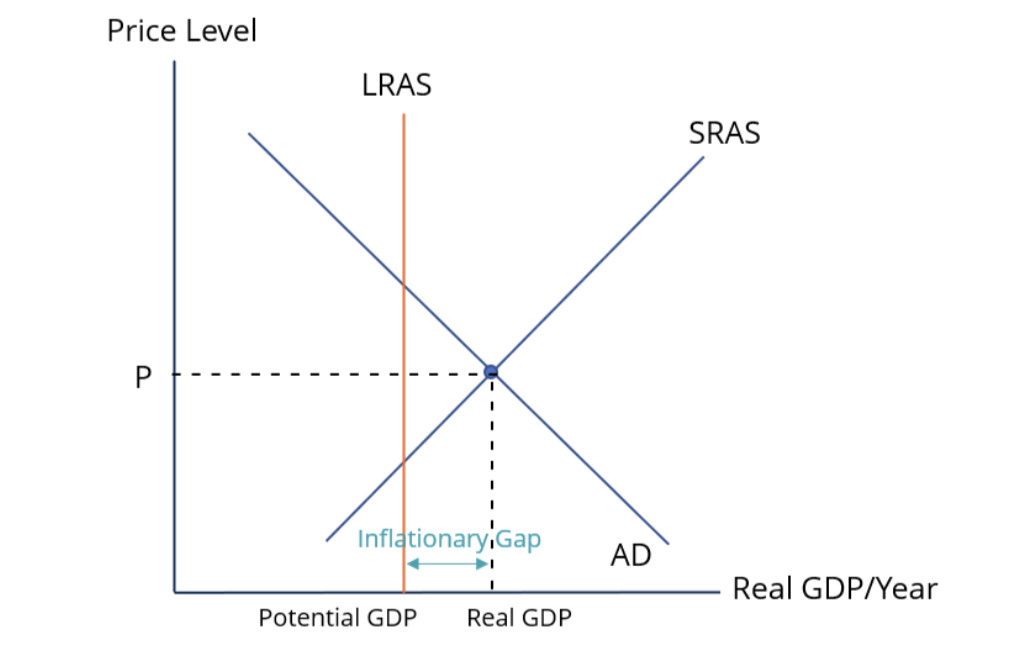
Inflationary gap
Economy is at equilibrium at a level of output > than full employment level of output, increases scarce + labour capital
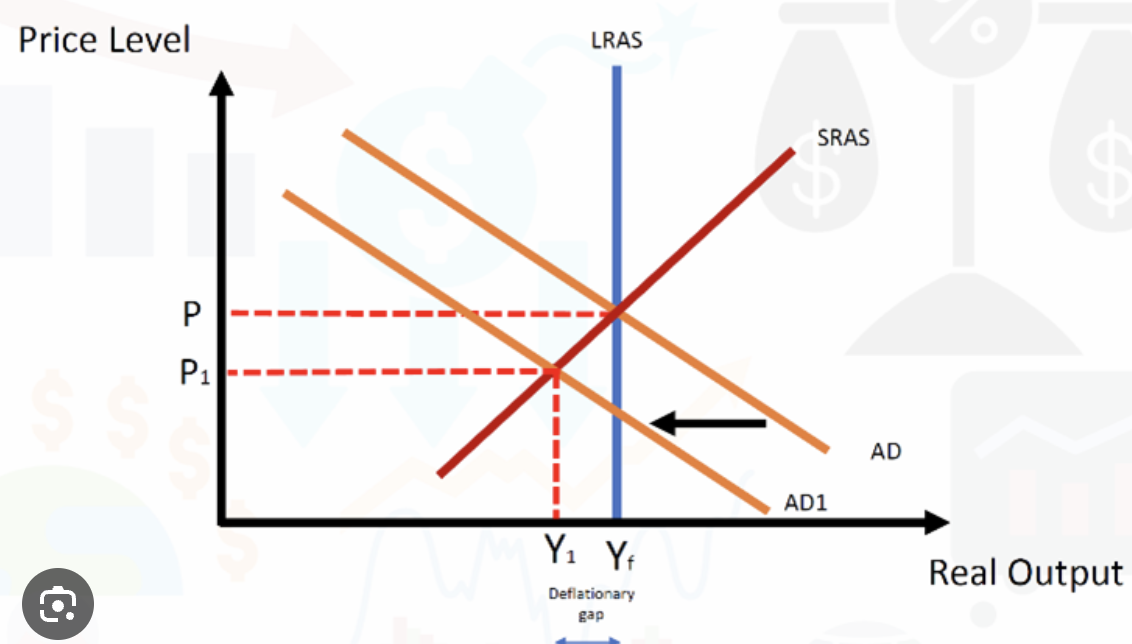
Deflationary gap
AD decrease where economy is at equilibrium but output level is < full employment level of output, so factors of production may have fallen and SRAS shifts right, government intervention is not present
Macroeconomic objectives
Low unemployment, low/stable rate of inflation (price stability), economic growth, income distribution, national debt
Unemployement
People of working age without work available and actively seeking employment
Unemployment rate
Number of unemployed / Total labour force x 100
Why is it difficult to measure unemployement?
Geographical disparities create variety among regions (urban v rural)
Age disparities
Ethnic differences create suffering due to prejudice/opportunity
Gender disparities where lack of education and discrimination causes inequality
Costs of unemployement
Less income
Lower standards in living
Higher levels of abnormal mental health
More poverty, homelessness, higher rates of crime, gang activity
Actual output less than potential
Government spends more on solving social issues stemmed from unemployment
Types of unemployement
Cyclical: related to business cycle —> firms need less labour at certain phases
Structural: worst type, related to fall in demand for labour, or difficulty to change jobs (skills needed), or change in framework of economy
Frictional: short-term, in-between jobs or left education to find one, not negative, reduced through market-based solutions
Seasonal: unemployed on a seasonal basis (tourism, agriculture, etc)
Inflation
Persistent increase in the average price level in the economy, measured through Consumer Price Index (CPI), on everything
Costs of high inflation
Loss of purchasing power for consumers
Real interest rates will be negative, so savings aren’t worth as much
Economic growth decreases due to less investment from consumers
Nominal interest rates increase to mitigate
More competitive internationally in trading (imports attractive)
Uncertainty in investments
Wages low so labour unrest + dispute
Consumer price index (CPI)
Measures the average percentage change over time in the prices paid by consumers for a representative "basket" of goods and services, primary indicator of inflation (rising cost of living) or deflation (falling prices)
Limitations of CPI
Not applicable to ALL people
Errors in data collection
Not taking account of changes
Countries differing in measurements
Prices vary for non-sustained reasons (seasons)
Changes in consumer prices
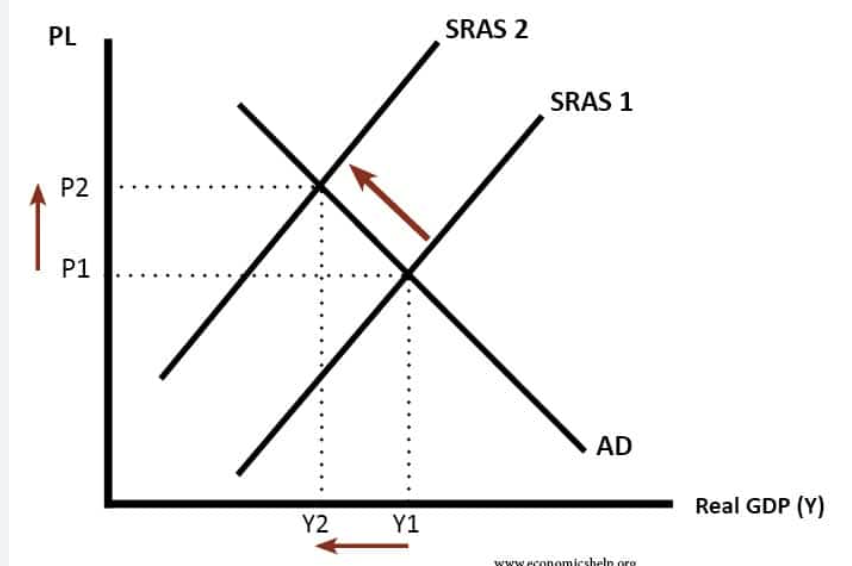
Cost-push inflation
Occurs when there’s an increase in costs of production, so short-run AS falls short, can change costs of domestic raw materials, increase imported capital costs, lowers exchange rate, increases costs of labour
Demand-pull inflation
Occurs when there’s an increase in AD, pulling up price levels, due to change of components
Deflation
Persistent fall in the average price levels of the economy (good and bad),caused by either a significant drop in Aggregate Demand (AD) or a substantial increase in Aggregate Supply (AS)
Costs of deflation
Unemployment (low AD makes businesses lay off workers)
Decreased consumption of durable goods to wait for further drops, can lead to a deflationary spiral
Fall in consumer confidence lowering AD
Investment decrease and makes less profit for businesses
Increase in debt for those taking loans or mortgage
Monetary policies ineffective to increase AD
Growth rate formula
(Real GDP in year 2 - Real GDP in year 1) / (Real GDP in year 1) x 100
Economic inequality
Unequal outcomes where treatment isn’t same for everyone —> inequality in income and wealth
Lorenz curve
Way in which income inequality is measured, divided into quintiles, useful to compare countries/distribution, modeled from GINI index, cumulative
Gini coefficient = A + (A+B)

How to calculate cumulative share of income for graphing Lorenz curve
Add through each quintile
1st, 1st + 2nd, 1st + 2nd + 3rd, etc.
5th = richest income
Gini coefficient
Numerical measure of income or wealth inequality within a population, ranging from 0 (perfect equality) to 1 (perfect inequality
Higher = more unequal distribution of income
Absolute poverty
Occurs when income of a person/household isn’t enough to meet basic needs (food, shelter, education, health, etc.), making under International Poverty Line (set by World Bank)
Purchasing power parity (PPP exchange rates)
Relative poverty
Based on living standards in a particular country
How is poverty measured?
Using World Banks International Poverty Line
Nations set own poverty line
Using OECD to provide poverty rate, or percentages below poverty line
Market-based measure —> basket of goods and services needed (setting the poverty line)
Multidimensional Poverty Index (MPI)
Developed by UN to recognize those in poverty and it’s a composite indicator to measure dimensions of poverty (health, education, standard of living)
Considered poor if experienced less in 1/3 of weighted indicator
Difficulty in measuring poverty
Many types, so varies and difficult to measure and define
Elements are impossible to measure (fear, vulnerability)
Surveys may be limited in poorer countries
Government lack of interest/efforts
Causes of inequality and poverty
Inequality of opportunities (different conditions, opportunity potentials vary, ex. poor household = less opportunities)
Discrimination (due to race, ethnicity, age, religion)
Discrimination in human capital (supply/demand for type of labour, wanting skilled people)
Different levels of ownership of resources, like capital
Globalization of tech process (leading to labour differences, hollowing out middle class)
Market-based supply-side policies (deregulation in financial market increases opportunity for wealthy)
Consequences of inequality and poverty
Pro: more incentive for entrepreneurship and innovation for investment
Con: drives productivity levels down, bringing less economic growth
Leads to low living standards and social tensions with less privilege —> also leads to promotion of criminal acts
Progressive taxes
Taxes that are based on income earned —> higher income = higher share of income, or corporate taxes
Pros: narrows gap, gov can use revenue for other finances
Cons: less incentive to work harder
Regressive taxes
Taxes that take a larger share of income from lower-income people than higher-income people
Ex. gas prices having different impact based on income (someone rich v someone poor)
Discourages consumption of negative externalities
Other domestic policies to reduce inequality/poverty
Transfer payments
Public health insurance
Programs to educate on childcare
Improved access to childcare
Diversity programs/regulation
Laws to encourage diversity
Equal wages
Minimum wages
Transfer payments
Tax revenues to redistribute income and provide different types of assistance to groups in the economy to improve living standards and opportunity
Childcare support
Paternity/maternity pensions/benefits
Depends on level to ensure what needs to be prioritized
Universal Basic Income (UBI)
Solution to benefits of unemployment being taken advantage of —> “free money for everyone”, giving everyone a guaranteed amount with no conditions, even to the rich
Fiscal policies (demand-management)
Set of government policies relating to expenditure/taxation rates, using expansionary to increase AD, or contractionary to decrease AD, aims to..
Maintain low/stable rate of inflation
Low unemployment rate
Stable long-term economic growth
Reduce business cycle fluctuations
Equitable income
Balance between imports and export