Intro to Finance Midterm
1/90
Earn XP
Description and Tags
MGCR 341
Name | Mastery | Learn | Test | Matching | Spaced | Call with Kai |
|---|
No analytics yet
Send a link to your students to track their progress
91 Terms
cost benefit analysis
any decision where benefits exceed costs drive value for the firm
role of competitive markets
goods can be bought and sold at the same price, and the market price is what determines the value of the goods. when benefits exceed costs for a decision, the firm’s market value increases
the valuation principle
value of an asset to investors/the firm is determined by the market price
interest rate (r)
rate at which money can be borrowed or lent over a given period
higher interest rate: costs more to borrow money, cost of money is higher
interest rate factor (1+r)
rate of exchange between future $ and $ today
discount factor 1/(1+r)
the value of $ today received in the future
future value
the value of a cash flow that has moved forward in time
FVn = PV0 (1 + r)n
present value
the value today of a future cash flow
PV0 = Ct /(1+r)t
net present value
the difference between present value of benefits and costs
NPV = PV (benefits) - PV (costs)
impact on firm value: positive projects increase firms NPV
accept positive NPV projects, choose investments with highest NPV
role of financial markets and assumptions
allocate resources over time and allow people to obtain personal risk-return combination
assume that these financial markets are efficient and there is free access to them
preferences
don’t matter unless you don’t have free access to a given market since you can buy and sell to get what you like
law of one price
in competitive markets, assets and portfolios with the same cash flows must have the same price
arbitrage
Exploiting inefficiencies in the market, can borrow capital to exploit an opportunity.
An arbitrage opportunity is any situation in which it is possible to make a profit without taking any risk or making any investment
transaction costs
most markets have these, including commissions for brokers, bid (price when selling), and ask (price when buying): spread (difference between bid and ask)
compounding
the process of earning interest on previous interest, accumulating interest over time on an investment to earn more interest
simple interest
interest earned on just the initial principle
relationship between fv and pv
FVn = PV0 (1 + r)n
you’d be indifferent between the two since they are equal, what changes is when they’re received
combining and comparing cash flows
only values at the same period in time can be compared or combined
perpetuity
a stream of equal cash flows that occur regularly and last forever
first cash flow happens at t=1 (a year from the present)
PV0(perpetuity) = c/r
annuity
a stream of equal cash flows arriving at regular intervals over a specific period of time (not forever) where the first cash flow happens at t=1
PV0 (annuity) = (c/r)(1-(1/(1+r)^n)
FVn (annuity) = c/r (1+r^n -1)
OR
FVn (annuity) = PV0 (annuity) (1+r)^n
growing perpetuity
a stream of cash flows that occurs at regular intervals and grows at g forever
PV0 (growing perp.) = c/(r-g)
growing annuity
a stream of n growing cash flows paid out periodically and regularly
PV0 (growing annuity) = (c/(r-g) * (1- ((1+g)/(1+r))n
EAR
the total amount of interest that will be earned at the end of one year
adjusting the discount rate to different periods
cash can arrive at different time intervals. when computing PV or FV, you should adjust the discount rate to match the time period of cash flows.
equiv. n period effective rate = (1+r)n - 1
APR
Indicates the amount of simple interest earned in a year without considering the effects of compounding that may occur
an indirect way of quoting
can keep APR if the frequency of compounding is equal to the making of payments (otherwise have to convert)
APR to EAR conversions
per compounding period:
EAR = (1+ (APR/m)m) - 1
continuous compounding:
EAR = eAPR - 1
pure discount loans
the borrower receives money today and repays a single lump sum at maturity
interest only loans
the borrower gets money today and pays interest each period and repays the entire principle at some point in the future
amortized loans
the borrower pays the interest plus some fixed amount
balloon/bullet payment
amount that the borrower needs to pay to liquidate loan before maturity
real vs nominal interest rates and cash flows
real: accounts for inflation
real CF = nominal CF/ (1+ i)t
real interest rate
convert nominal rate r into real interest rate rr
1+rr = (1+r)/(1+I)
rr = (r-I)/(1+I)
rr = r - 1
where I is the expected annual inflation
when I = r, rr = 0
when i<r (i inflation is less than the rate r): real interest rate > 0 (positive)
when i>r (i inflation is greater than the rate r): real interest rate < 0 (negative)
be consistent with the discounting
the determinants of interest rates
The determinants of interest rates: fundamentally, interest rates are determined in the market based on governments, institutions, and individuals’ willingness to borrow and lend
some of the main factors:
inflation
expectations of future growth and productivity
central bank monetary policy
yield curve terms
key terms
term structure: the relationship between the investment term and the interest rate
yield curve: a plot of bond yields as a function of the bond’s maturity date
risk free interest rate: the interest rate at which money can be borrowed or lent without risk over a given period
PV of a stream of cash flows
cash flows should be discounted using the discount rate that is appropriate for their horizon
PV = sum of all { (ct/(1+rt)t)
where rt is the effective rate per period between 0 and t
overnight rate
the rate at which banks can borrow cash reserves on an overnight basis from the Bank of Canada
determines v short term interest rate
increasing yield curve
interest rates are expected to rise, long term rates higher than short term rates to attract investors
inverted yield curve (decreasing)
interest rates are expected to fall, long term rates are lower than short term rates to attract borrowers
connection to recessions: often inverted yield curves predict recessions
opportunity cost of capital
when calculating the NPV of an investment or project with risky cash flows, we need to use a discount rate that considers timing and the riskiness of the cash flows (because investors are usually risk averse)
cost of capital
the best available expected return offered in the market on an investment of comparable risk and term to the cash flow being discounted
bond
a security sold by a government or corporation to raise money from investors exchange for a promised future payment
debt
bond’s maturity
n, the final repayment date
coupon payments (CPN)
the promised interest rate of a bond paid periodically until maturity
CPN = (coupon rate * face value) / number of coupon payments per year
zero coupon bonds
payment structure that just pays face value at maturity
face value (fv)
the notional amount of the bond used to compute interest, usually repaid at maturity
yield to maturity (YTM)
the single discount rate that sets the pv of the promised bond payments = current market price of the bond
→ to discount, find the corresponding effective rate
coupon rate
sum of all coupons during a year divided by face value of the bond
determines the amount of each payment
price of a zero coupon bond
p = fv / ( 1 + YTMn)n
YTM of a zero coupon bond
YTMn = (fv/p)1/n - 1
YTM is expressed as an effective rate per period for holding the bond until maturity n periods in the future
return on bonds
return = (p1 - p0)/p0
(selling at t = 1)
buying at t=1 and getting fv at t=2
return = (fv1 - p1)/p1
coupon bonds
pays regular coupon interest payments (CPN) up to maturity (n) when it also pays its face value
return comes from: difference between purchase price and principal value and the periodic coupon payments
price of a coupon bond
p = (cpn/ytm) (1 - (1/(1+ytm)n)) + (fv/(1+ytm)n)
at par bonds
when price equals face value
at a premium bonds
price is greater than fv
at discount bonds
price is lower than fv
zero coupon bonds always trade at a discount
coupon bonds may trade at a discount (or at par or at premium)
bond prices just after a coupon
if the coupon rate = YTM: bond trades at par just after coupon payment
if coupon rate greater than YTM: bond trades at a premium just after coupon payment
if coupon rate less than YTM: bond trades at a discount just after coupon payment
time and bond price dynamics
if a bond’s YTM is known to remain constant, the per period return of an investment in the bond equals its YTM even if you sell the bond early
interest rate risk (risk factors in bond valuation)
the price of the bond changes due to changes in the interest rate → the bond price decreases when the interest rate rises. bond prices and interest rates move in opposite directions
credit risk (risk factors in bond valuation)
bonds typically have some probability of default → the risk that arises for bond owners from fluctuating interest rates.
all else equal, the prices of bonds with longer maturities are more sensitive to interest rate changes.
all else equal, the prices of bonds with higher coupon rates are less sensitive to changes in interest rates
the risk of default by the issuer of the bond, so that the bond’s cash flows are not known with certainty → to compensate, investors would either demand higher promised coupon payments or only will pay a lower price for the bond
if the bond has already been issued and the coupon rate is fixed, then higher default risk implies lower bond price, all else equal → at a fixed point in time, if the bond price decreases, YTM increases
firms rate the creditworthiness of bonds which are used by investors to make decisions (eg standard and poor’s, moody’s)
credit risk and yields for bonds
the YTM of a bond is calculated using the promised cash flows rather than expected cash flows
the YTM of a bond that has default risk ≠ the expected rate of return of investing in the bond
higher YTM ≠ an expected higher return for the bond
common stocks
partial ownership in a corporation
voting rights
dividends (decided by BOD) → proportional to ownership
public equity
traded on an exchange
private equity
not publicly traded
residual claim
common shareholders have claim over a firms cash flows and assets after all obligations to creditors and preferred shareholders are met
pre-emptive right
shareholders can share proportionally in new stock sold
limited liability
shareholders can only lose up to what they invested in the equity
payout policy
share repurchases: firms can use cash to buy back its own equity
cash dividends: payments made from firm’s earnings paid to shareholders
everything is at the board of directors’ discretion, and unless a dividend is declared by the board of directors, it isn’t a liability of the company
dividends and share repurchases are not tax deductible
can have regular and one time “special” dividends
preferred stock
usually no voting rights
preference in payments of div and liquidation (often fixed div rate)
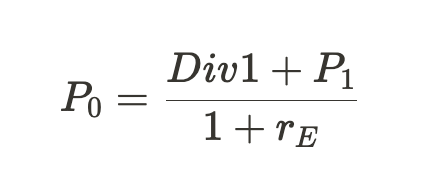
common stock valuation
at t = 1: P0 = Div1 + P1
stock prices
stock returns
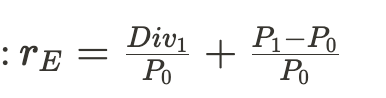
dividend yield from re formula

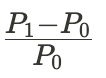
capital gains yield from re formula
EQUITY VALUATION MODELS
dividend discount model
constant div growth model
constant growth model
total payout model
discounted FCF model
valuation by multiples
dividend discount model
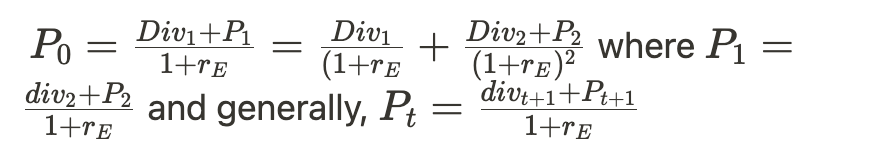
generally: P0 = ∑divt / (1+rE)t
the price of a stock today = the pv of all future dividends
constant div growth model
P0 = Div1/(rE - g)
rE = Div1/P0 + g
where div yield: div1/p0
capital gains yield: g
constant growth model
P0 = divN/(1+rE)N + 1/(1+rE)N * divN+1/(rE -g)
dividends and growth, determining rate of growth for firms divs
divt = EPSt * Dividend Payoutt
where earnings are total profit minus depreciation, taxes and interest
EPS_t (earnings per share) = earnings/number of shares at time = t
dividend payout ratio_t: fraction of the earnings firms pay out as dividends in period t
if a firm has constant dividend payout ratio, the growth in dividends per share div_t is determined by growth in EPS_t
if all increases in future earnings are from new investments from RE
growth EPS rate = retention rate * return on new investment
where retention rate is fraction of earnings that the firm retains (that it doesnt pay out in dividends)
hence, the growth in EPS_t is determined by the retention rate and return on new investments
the total payout model
extends the div discount model to share repurchases
P0 =
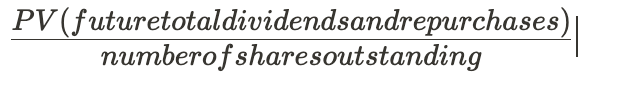
where the numerator is the current value of firm’s equity which when you divide by denominator of # of shares gives price per share, P_0
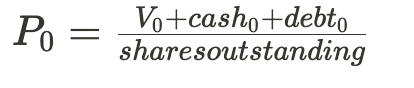
discounted FCF model
DCF (discounted free cash flow model): enterprise value = market value of equity + debt - cash
where cash is excess cash beyond what is needed for operations
estimating stock price ind PV of firms FCF to pay all investors, enterprise value is V_0,
V_0 = PV (future free cash flow of firm)
free cash flow of a firm
how much cash is available to debt and equity holders after accounting for operating expenses, taxes, changes in working capital, and needed investments in fixed assets → ignores effect of firm debt
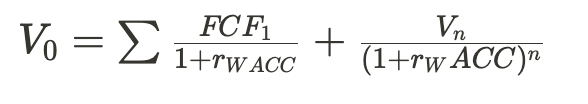
estimating a firms EV
since we discount the cash flows to all investors, we use the WACC (weighted average of cost of capital), denoted by r_{WACC}
Forecast FCF to some horizon (time n) together with the terminal value (beyond forecast period value of asset) of enterprise at time n
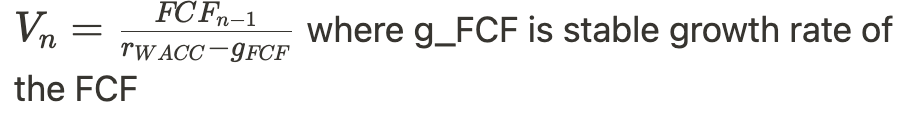
methods to estimate terminal value
liquidation value: firm stops operating at a foreseeable point in the future and will sell the assets, then the terminal value is the market value of those assets
multiple valuation: terminal value of the firm found by adding a multiple to expected earnings or revenues in that year (relative valuation)
stable growth model: assumes that the cash flows beyond terminal year n will grow constantly forever. in this case, the terminal value is a growing perpetuity:
why does discounting a firm’s FCF give us the enterprise value (enterprise value = debt + equity - excess cash)?: because all of the firm’s FCF plus excess cash go to debt holders or shareholders
valuation by multiples
an asset should sell for $20 if it has 2x the cash flow as a very similar asset that sold for $10 recently
choose the right multiples and truly comparable firms
choosing the right firms to compare with
similar enough to be comparable, need a large sample to filter out unique features
eliminate firms with rare events
criteria:
industry classification
technology
clientele
size
leverage (equity with different financial risk)
valuation by multiples: P/E ratio
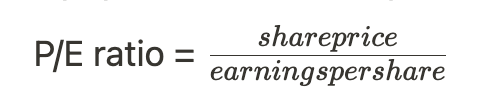
trailing p/e
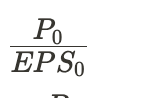
to estimate the value of a firms share price, multiply earnings per share by average P/E of comparable firms
forward p/e
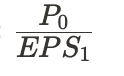
to estimate the value of a firms share price, multiply earnings per share by average P/E of comparable firms
interpreting P/E ratio
if dividends grow at rate g forever then using the dividend model
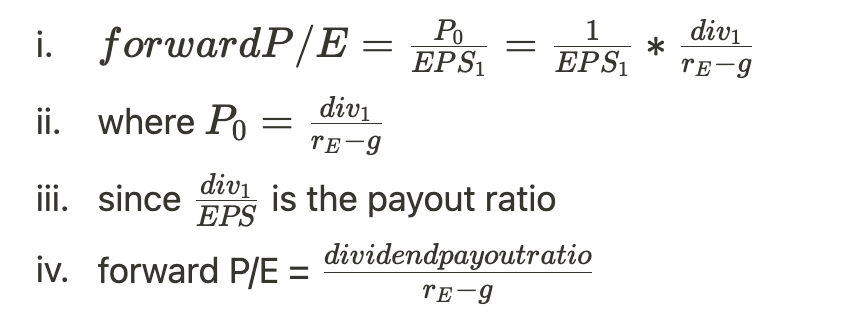
p/e ratio depends on
equity cost of capital (ie the equity’s risk) → decreasing factor
growth rate → increasing factor
dividend payout ratio → increasing factor
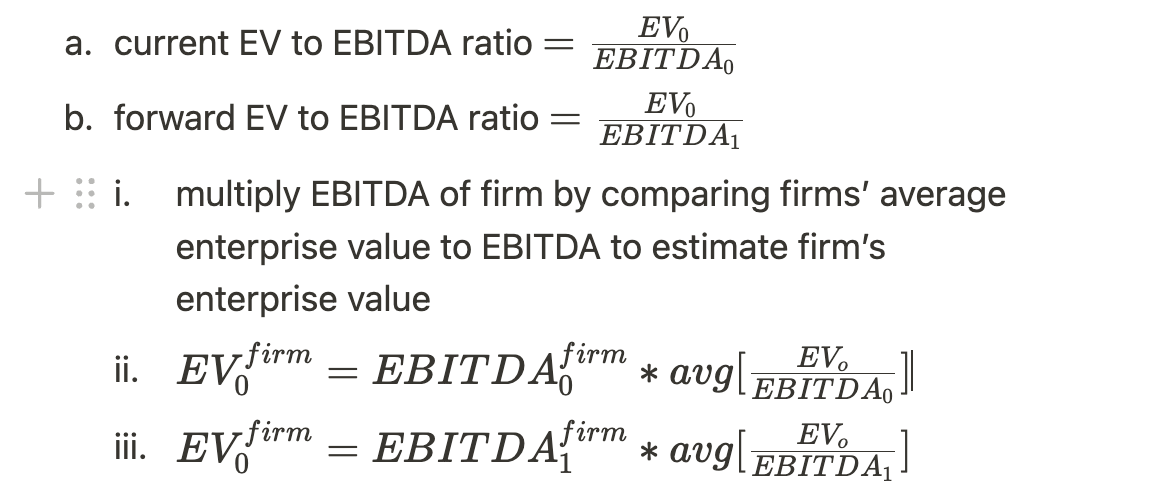
enterprise to EBITDA multiple
efficient markets hypothesis
implies that securities will be fairly priced based on their future cash flows given all publicly available info to investors