GCSE Geography Paper 1 (Physical)
1/252
Earn XP
Name | Mastery | Learn | Test | Matching | Spaced | Call with Kai |
|---|
No analytics yet
Send a link to your students to track their progress
253 Terms
tornadoes
vertical funnels of rapidly spinning air containing clouds, strong wind, rain & sometimes hail
move at 15-30kmph and can have wind speeds of over 400kmph
flooding
a consequence of extreme weather (heavy rainfall in a short time) when water overflows its natural / artificial banks onto land that’s usually dry
thunderstorms
rain, clouds, lightning, thunder, wind
lightning
a type of extreme weather seen during thunderstorms. a bolt can contain 1bil volts of electricity
dust storms
a type of extreme weather, happens when very strong winds carry clouds of dust across an area
weather vs climate
WEATHER: the day to day changes in the atmosphere
CLIMATE: the average weather of an area based on data collected over 30 years
warm air
warm air rises - when air is heated it expands, becomes les dense and starts to rise, creating low pressure
as the air rises it starts to cool and any water vapour in the air condenses, causing clouds to form & possibly rainfall
low pressure because the air is exerting less pressure on the earth
clouds, rainfall, wind, hurricanes
cold air
cold air falls - becomes more dense & falls towards the ground, creaitng high pressure. it’s pushing down so pressure increases
no rising air = no clouds/rain, so calm, sunny, hot days in summer & clear, cold days in winter
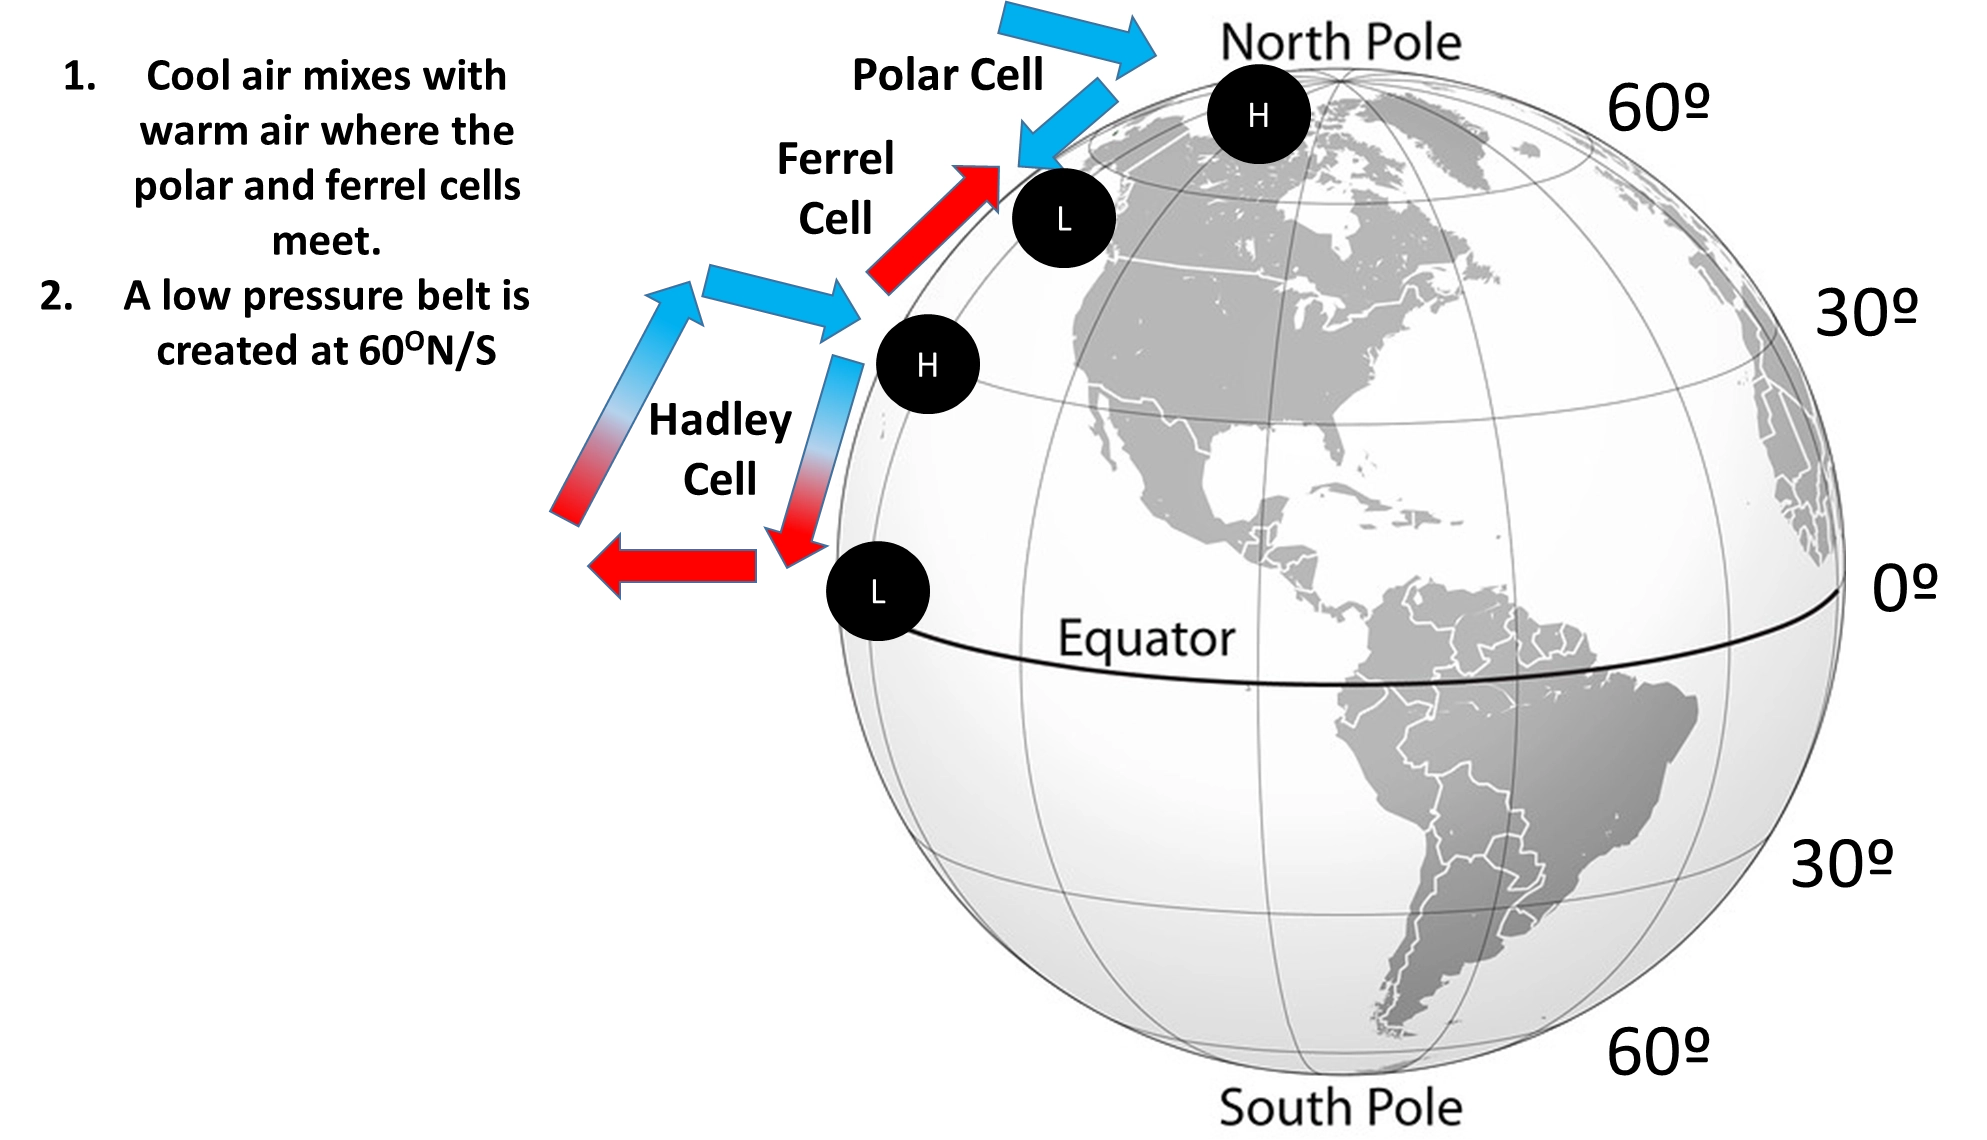
the global circulation system
the equator receives the most heat from the sun & the north/south pole the least. this causes a surplus of heat at the equator. to provide polar areas with heat the earth operates the GCS
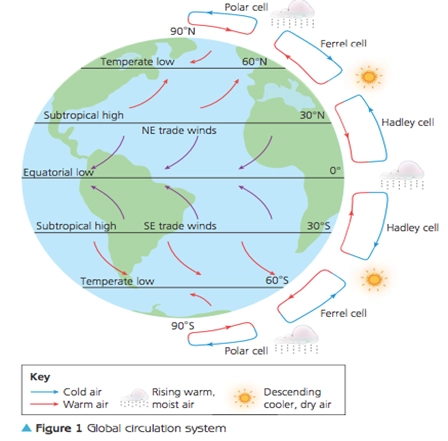
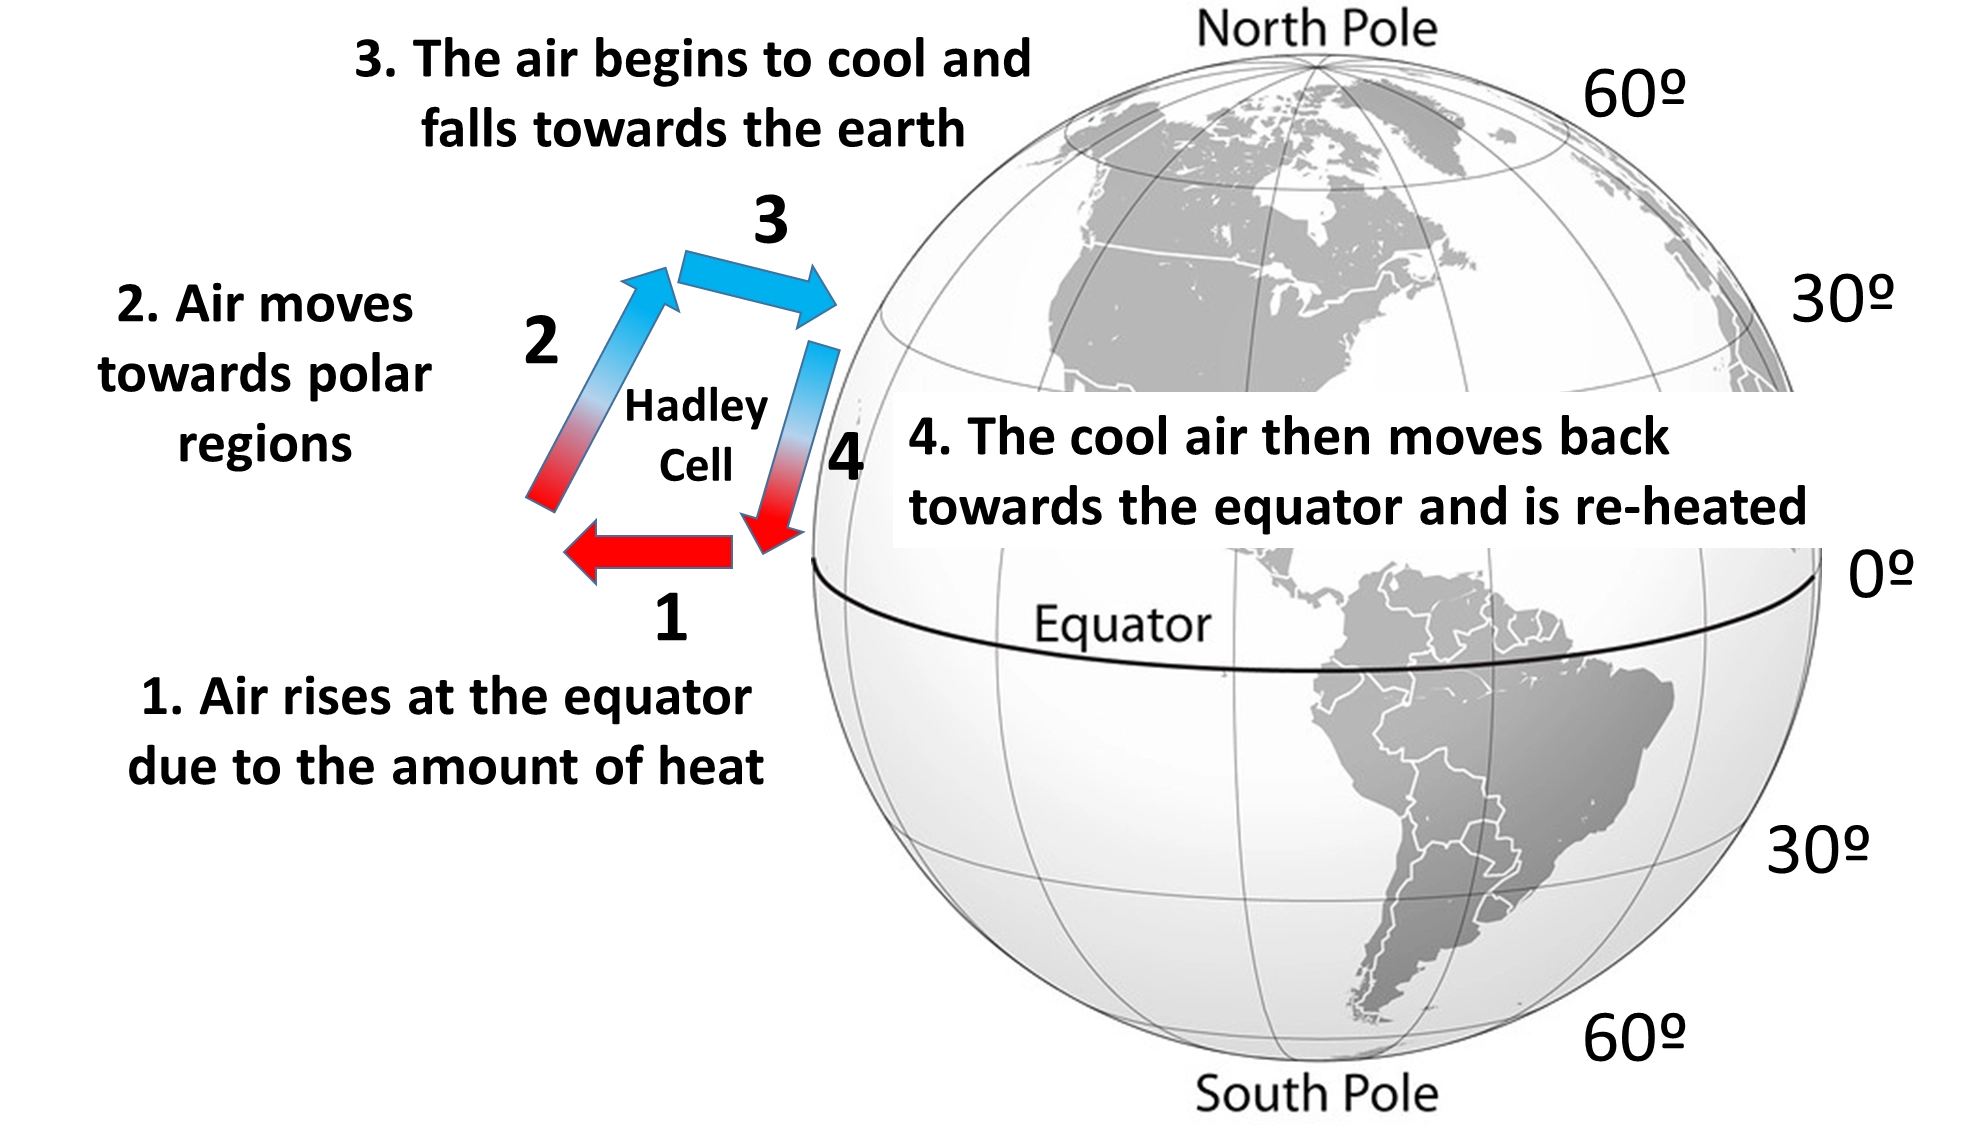
GCS: hadley cell
at the equator hot air rises creating a low pressure system & a band of high rainfall
at 30° cool air sinks creating high pressure so clear skies & desert climates
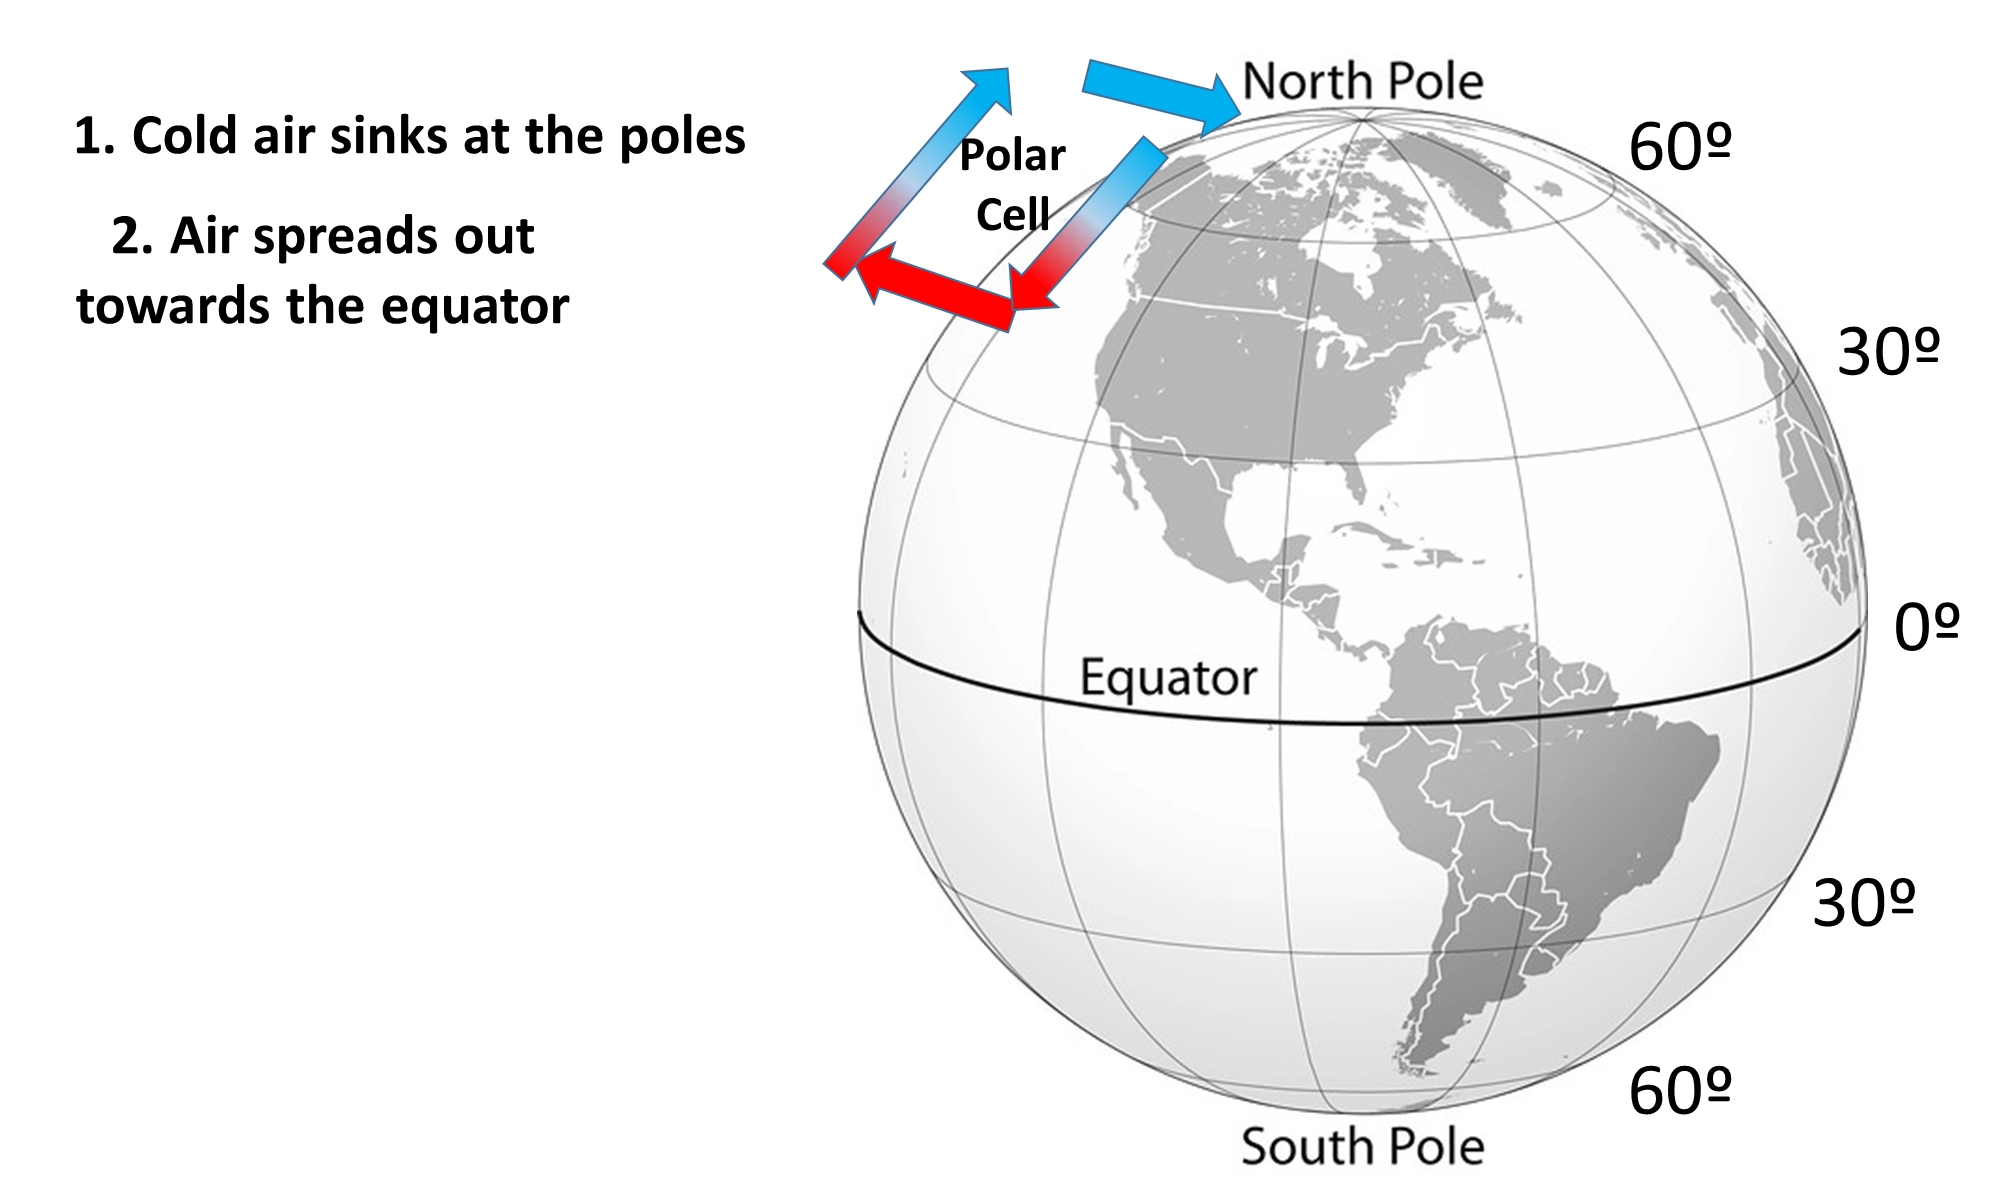
GCS: polar cell
cold air sinks and moves away from the poles
GCS: ferrel cell
at 60o there’s a band of low pressure as warm air from the ferrel cell mixes with cold air from the polar cell, creating rain
extreme weather
unexpected / unusual / unpredictable / severe / unseasonable weather
can take place over 1 day or a period of time
causes of extreme weather - temperature
the GCS can cause temps to be v high in high pressure areas around 30o. there are few clouds (sinking air) so there’s little to block the sun’s energy. temps in polar regions are very low
causes of extreme weather - the albedo effect
albedo - how much a surface reflects / absorbs the sun’s rays
polar ice has high albedo so reflects more heat so the poles are colder
oceans & rainforests have low albedo so absorb more heat so they’re warmer
causes of extreme weather - clouds
clouds can both cool the plant (reflect sunlight) and warm it (trap infrared heat). low thick clouds reflect causing cooling, while high thin clouds trap causing warming
cooling - clouds act as a white shield, reflecting incoming sunlight back into space. this reduces the amount of energy reaching the surface, particularly with low altitude clouds
warming - clouds act as a blanket, trapping radiation emitted by the surface & reemitting it. this keeps the surface warmer
high clouds - thin & cold, let most sunlight through while trapping outgoing heat = net warming effect
low clouds - thick & warm, reflect substantial sunlight & emit heat similar to the surface = net cooling effect
causes of extreme weather - ocean currents
because water is fluid, ocean currents more heat easily
the UK is warmer than other countries at similar latitudes because it’s warmed by a warm ocean current from the caribbean
causes of extreme weather - altitude
higher up, pressure is lower so temps are cooler (~1o per 100m altitude)
causes of extreme weather - precipitation
occurs when warm wet air rises & cools, causing water vapour to condense
air rises in low pressure belts so precipitation is frequent & intense in those areas. in high pressure belts air sinks & precipitation is v low
causes of extreme weather - wind
the movement of air from an area of high pressure to one of low pressure. greater pressure difference = stronger wind. (usually winds at ground level are slowed by friction)
trade winds blow from high pressure belts → low pressure belts
katabatic winds are caused by air flowing downhill
jet streams are high in the atmosphere and very strong as there’s little to slow them down
measuring wind
anemometers are used to measure wind speed by counting the number of times they rotate per minute
wind speed & direction can be shown using a rose chat
wind speed is measured using the Beaufort scale which ranges from 0 (calm) to 12 (hurricane)
australia vs uk - temperature
australia is warmer than the uk
in darwin (city in N australia) the average max summer temp is 33oC. temps over 40oC are considered extremely hot
in london the average max summer temp is 23o. temps over 30oC are considered extremely hot
australia vs uk - wind
australia has stronger extreme winds than the UK, partly because of tropical storms
strongest wind in australia is over 400km/h (recorded off the NW coast during a cyclone in 1996)
in the UK gales (winds 62kmph+) are rare. strongest every sea-level wind was over 220km/h (recorded in scotland in 1989)
australia vs uk - precipitation
australia has much lower precipitation than the UK
average annual rainfall in australia is 465mm. average annual rainfall in UK in over 1150mm
extremely wet years: 500mm+ in australia vs 1210mm+ in UK
extremely dry years: 360mm- in australia vs 950mm- in UK
tropical storms
powerful rotating storms, aka hurricanes, cyclones & typhoons depending on where they occur
form over tropical oceans & move east → west during summer & autumn, steered by trade winds
wind speeds over 120kmph, can be up to 650km wide & bring heavy rain (up to 250mm in 1 day)
a storm can last 6-14 days, bringing devastation to any land in its path
droughts
periods where there is much less precipitation over a specific time than is usual for the area, leading to water shortages. not no rainfall at all. an event of prolonged shortages in water supply, can be atmospheric (below average precipitation), surface water or ground water
can lead to food shortages, hunger & death
linked to long periods of high pressure - few clouds & so less precipitation. high temps also mean more water evaporates from plants, lakes & streams
can last for months / years / as little as 15 days
impact is worsened if people are using too much water or if water is being wasted
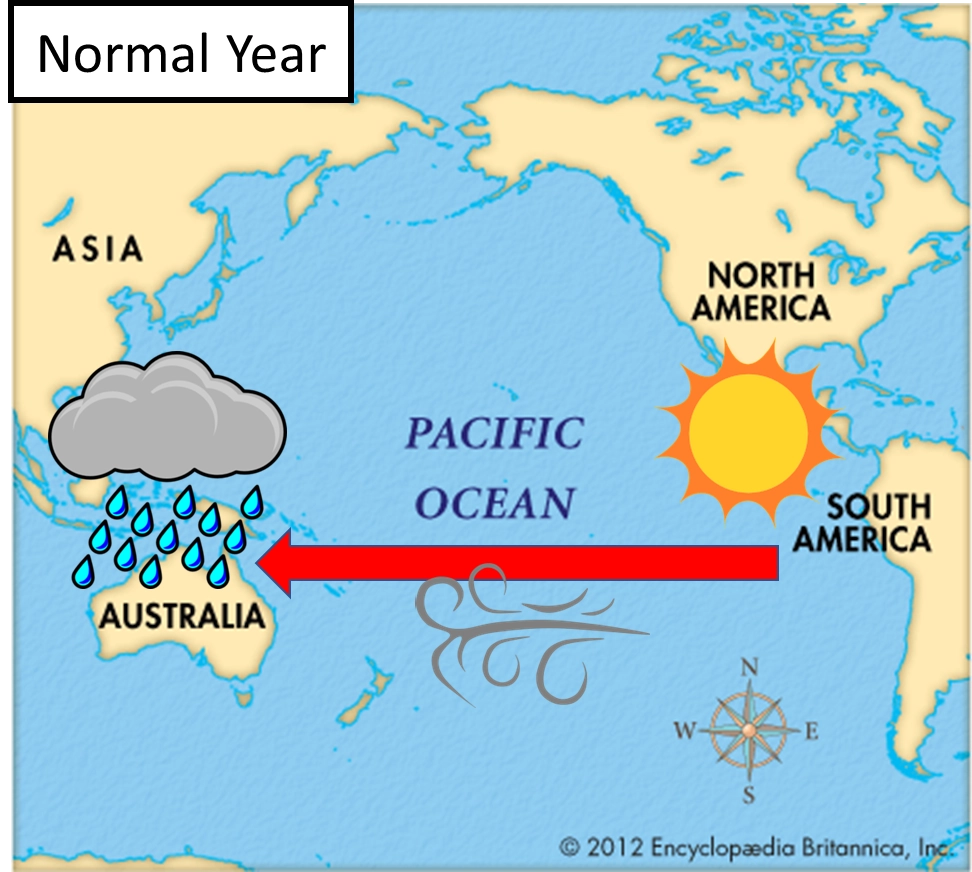
pacific normal conditions
winds blow east → west (south america → australia)
winds push warm water to the west making the sea levels in australia higher & warm. low pressure here due to warm water heating the air above it
peru = high pressure, v little rain
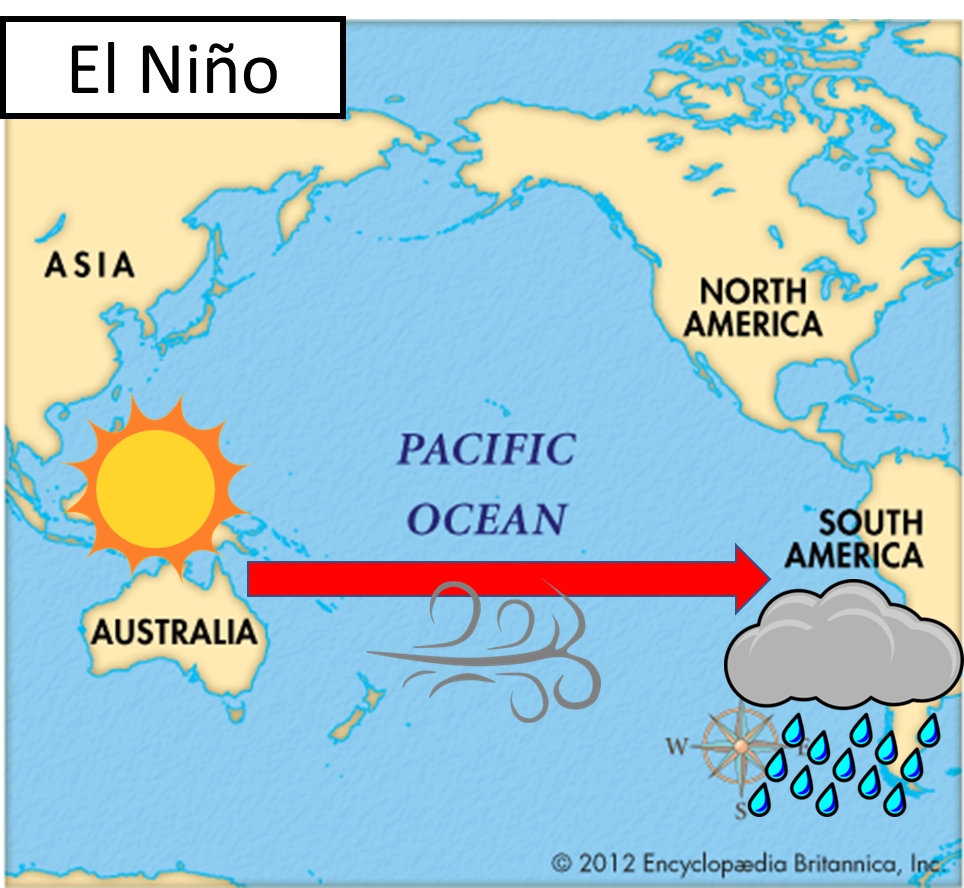
el nino
a weather event that takes place in the pacific ocean between australia & south america. happens every 5-7 years and involves a shift in the usual climate of the pacific ocean
el nino conditions in the pacific
usual winds reverse, blowing west→east
australia: cold ocean waters, falling air leading to high pressure, low rainfall, drought & wildfires
peru & south america: warm ocean waters, rising air leading to low pressure, high rainfall, storms & flooding
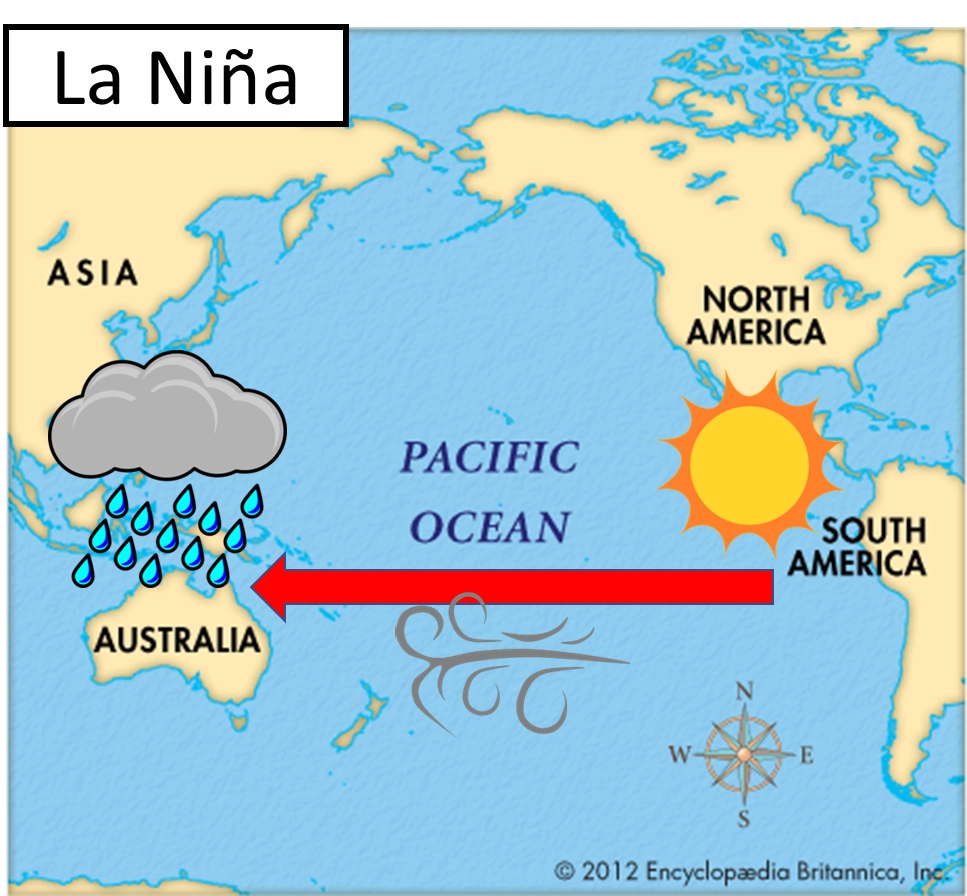
la nina conditions in the pacific
conditions are the same as a usual year but more extreme. could (but doesnt always) follow an el nino event
opposite impacts to el nino: australia = flooding, peru = droughts
tropical storm formation
occur in late summer & early autumn when oceans are warmest
form between 5o & 15o where trade winds meet. must be at least 5o so the coriolis effect can start the storm spinning
ocean must be at least 26.5oC and 60m deep. depend on a warm ocean for energy so it dies when reaching land. steered by light winds at sea
ocean water evaporates
air above the ocean warms up & rises
this creates low pressure which sucks in air from trade winds. winds spiral & absorb more moisture from the ocean
humid air forms storm clouds
cool air sinks, creating an area of calm, clear conditions (eye)
effects of tropical storms
strong winds can blow roofs of buildings, tear down trees & crops, damage communication & transport networks
heavy rain can cause short term flash flooding (especially in urban areas), mudslides & landslides, and flooding downstream
low air pressure raises the sea level (especially as the storm nears land) leading to coastal flooding
industries eg fishing, shipping, transport & tourism are vulnerable to tropical storms. millions of people living along coastlines are affected
typhoon hayan
hit the phillippines in november 2013. category 5 storm, winds over 315km/h
philippines stats
7th most populous nation in asia
population 98.4 people
LIDC, GDP per capita $2,765 (less money for preparation, defences, rebuilding)
typhoon haiyan impacts
worst impact = storm surge: 7.5m at the coast, 5m at Tacloban city where 5,800 people were killed.
90% of buildings in TC destroyed, electricity supplies cut, infrastructure & communications destroyed. 5 million people had their homes destroyed/become uninhabitable. airport unusable
estimated 6,340 fatalities, almost all in Tacloban city / the Visayas region
looting & assault during early days (only 100/1300 police officers reported for duty). relief trucks attacked & looted. martial law declared to maintain order
hospitals run low on supplies & shut (lack of staff, safety regulations)
agriculture, fishing, tourism & manufacturing industries damaged = large economic setbacks
storm surge
a sea level rise experienced in a tropical storm due to low pressure & strong winds
often causes coastal flooding & is the cause of most deaths in a tropical storm
typhoon haiyan responses
UN fundraising appeal raised $788 million. foreign nations donated total of $550 million. but total damage was over $8 billion and only 20% of those requiring aid had received it by mid november
attempts to move 1000s of people by military aircraft were slowed by miscommunication & panic
US sent marines & navy personnel, UK sent air force & navy
government grants for local fishing businesses to buy new boats. rice seed provided for farmers by oxfam. tent schools built by save the children
soft engineering schemes to reduce future storm impact: mangrove plantations & afforestation (create windbreaks & stabilise soil), Philippines Weather Service warnings via internet & social media
uk heatwave
2018 (joint hottest summer for UK). temps 35.3oC
UK heatwave causes
jet stream was further north than usual meaning high pressure weather stayed over the UK for a long time & weren’t moved away
high pressure prevented formation of clouds/rain. higher jet stream prevented clouds & storms coming
jet stream
a high altitude band of wind that blows at high speeds east → west
UK heatwave impacts
4% revenue rise for businesses. ice cream sales rose by 24%, burgers by 14.4%, sausages by 5.1%
57% of population stayed in UK for summer = large tourism increase
UK economy gained total £31 billion (increased spending & staycations)
wildfires around manchester (winter hill & saddleworth moor). on SM 18km2 burnt. fires spread quickly due to changing wind direction. only extinguished after 3 weeks. 150 people evacuated. ecological impacts estimated to last 15 years
that summer there were 663 more deaths than the average. the NHS & care homes struggled to cope
food & farming industry - yields decreased by 20% and food prices increased by 5%
underground reached temps over 40o+, roads melted, rail tracks bent
driest summer in 57 years (only 15mm of rain in june) = low reservoir stocks & water shortages
UK heatwave responses
farmers were allowed to take more water from groundwater sources & river channel flow than usual for irrigation. however this raised criticism due to environmental impact
roads were shut down (melting tarmac), gritting trucks were put on standby, speed restrictions implemented for trains
hosepipe ban in august
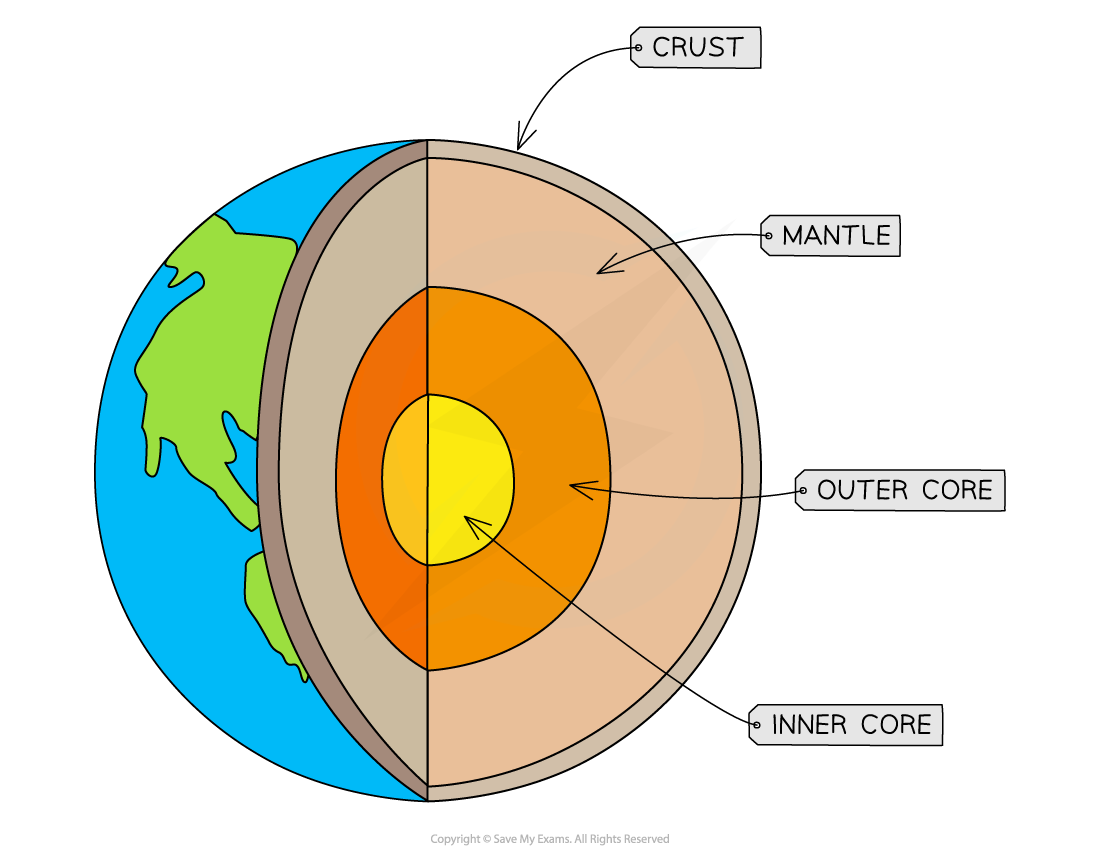
structure of the earth
inner core: 1400km in diameter, solid & dense, made of iron & nickel, temps of 5500oC
outer core: 2100km thick, semi-molten metal layer, temps of 5000-5500oC
mantle: 2900km thick, semi-molten layer, less dense than outer core
crust: two types (continental / oceanic), thickness varies
earth’s crust & types
two types:
oceanic: thinner (5-10km) but heavier & denser
continental: thicker (25-90km) but older & lighter
oceanic crust is constantly being created & destroyed due to plate movement, because it’s denser so subducts under the continental crust. this means continental crust is much older than oceanic crust as it isn’t destroyed
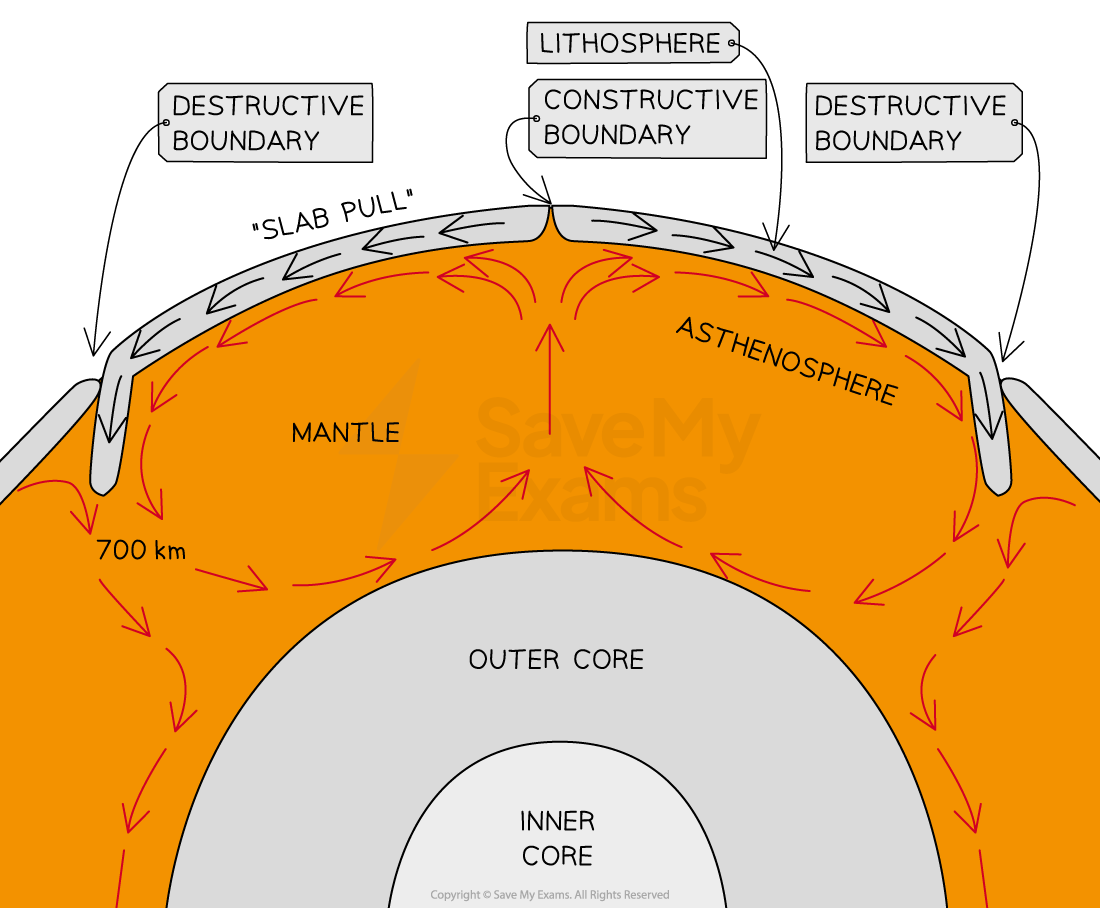
tectonic plates + movement theories
the earth’s crust is broken into a number of tectonic plates which move on top of the semi-molten mantle below
tectonic theory once stated that their movement was due to convection currents in the mantle
current theory is ridge push & slab pull:
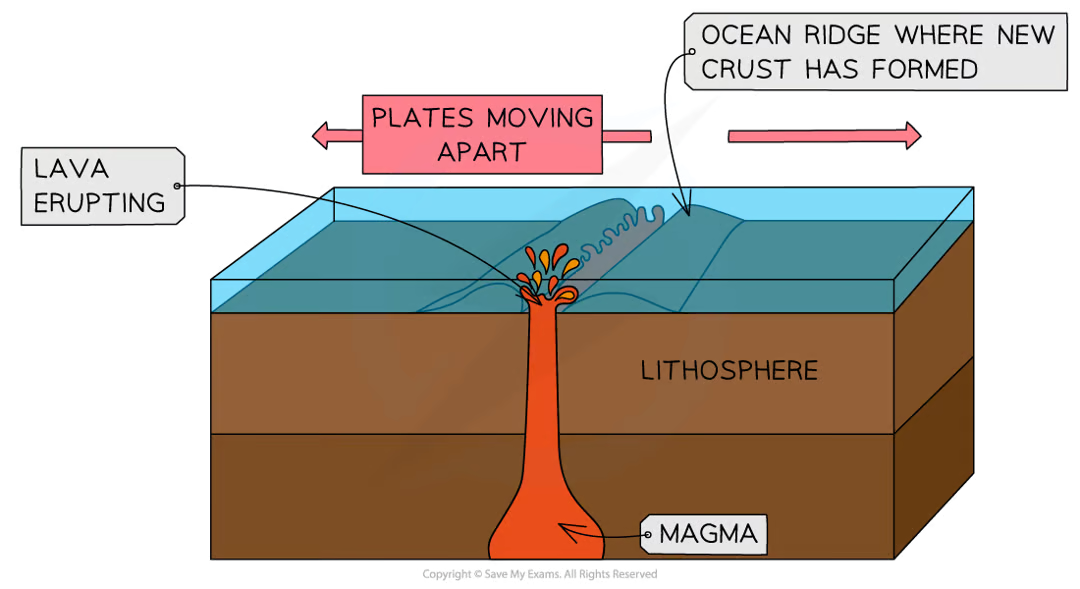
ridge push: new crust forming at the constructive boundary which pushes the older crust away
slab pull: the weight of the denser oceanic plates subducting and dragging the rest of the plate along
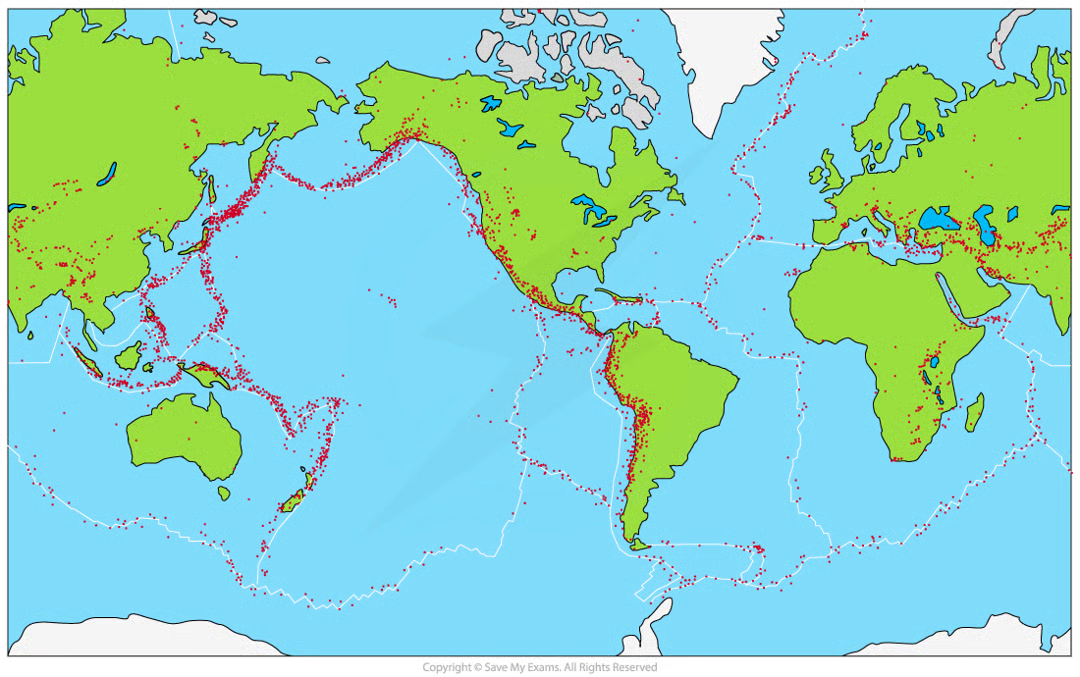
earthquake/plate boundary distribution
plate boundary/margin = where two plates meet
earthquakes occur at all types of plate boundaries. most (90%) occur along the pacific ‘ring of fire’
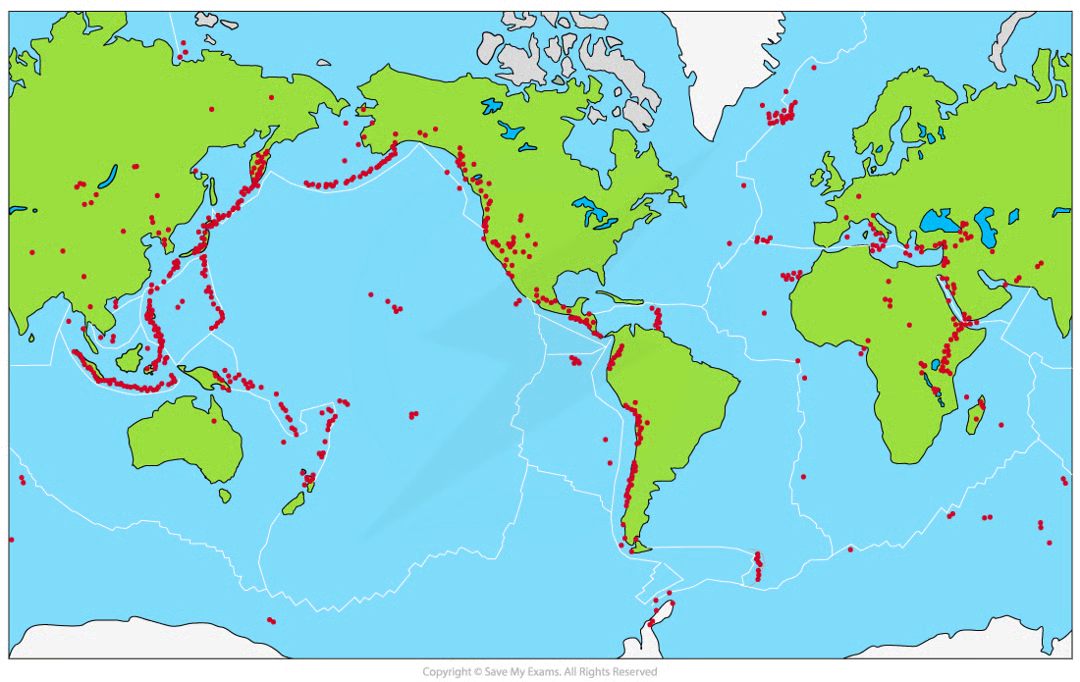
volcano distribution
most volcanoes occur at constructive & destructive plate boundaries. most (~75%) are located around the pacific ring of fire
hotspots occur away from plate boundaries
4 types of plate boundary
constructive
destructive
conservative
collision
constructive plate boundaries
plates are moving apart e.g. mid-atlantic ridge
both volcanoes & earthquakes occur
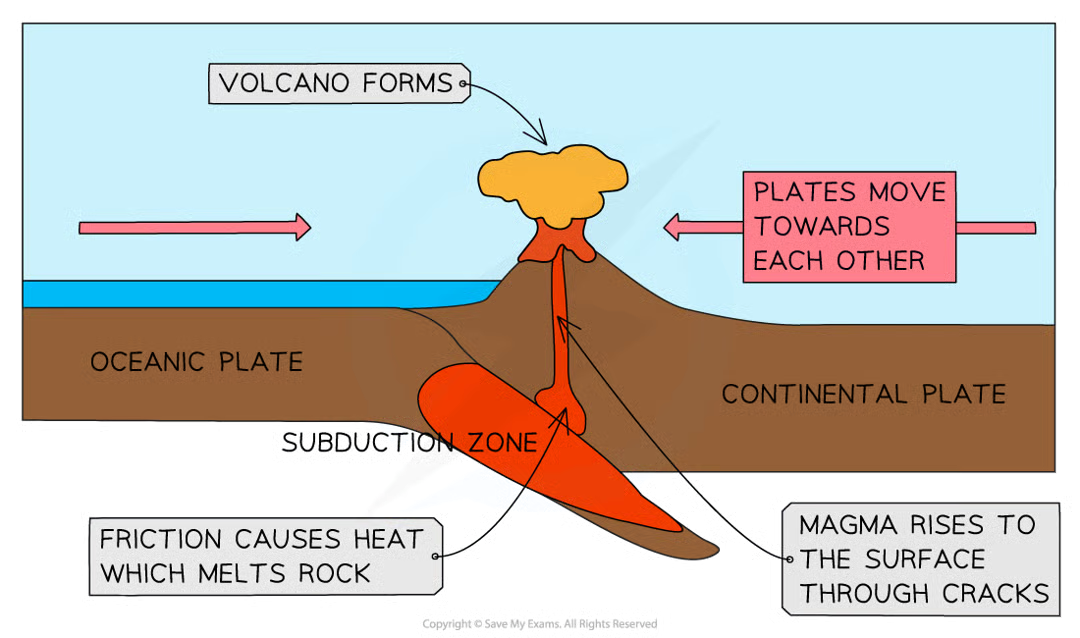
destructive plate boundary
plates are moving together. the denser heavier oceanic plate subducts under the lighter less dense continental plate
e.g. nazca plate & south american plate
both volcanoes & earthquakes occur
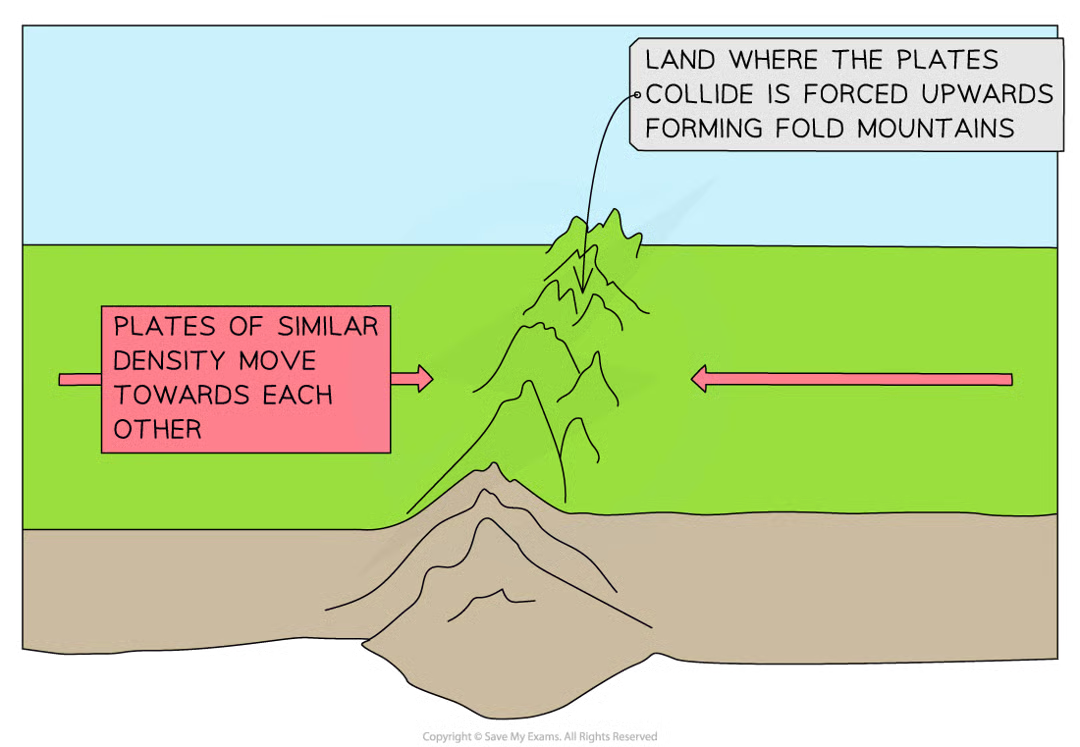
collision plate boundary
two continental plates are moving towards each other. they are less dense than the mantle below them so they don’t subduct & the crust is forced upwards forming fold mountains e.g. Himalayas
no volcanoes but earthquakes only
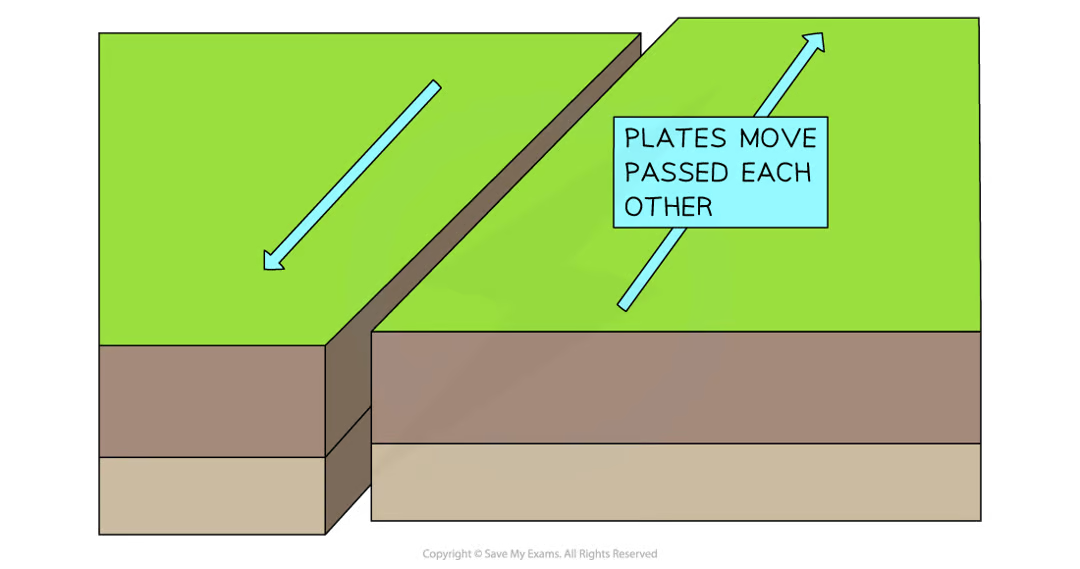
conservative plate boundary
plates move past each other in opposite directions/the same direction at different speeds. earthquakes only
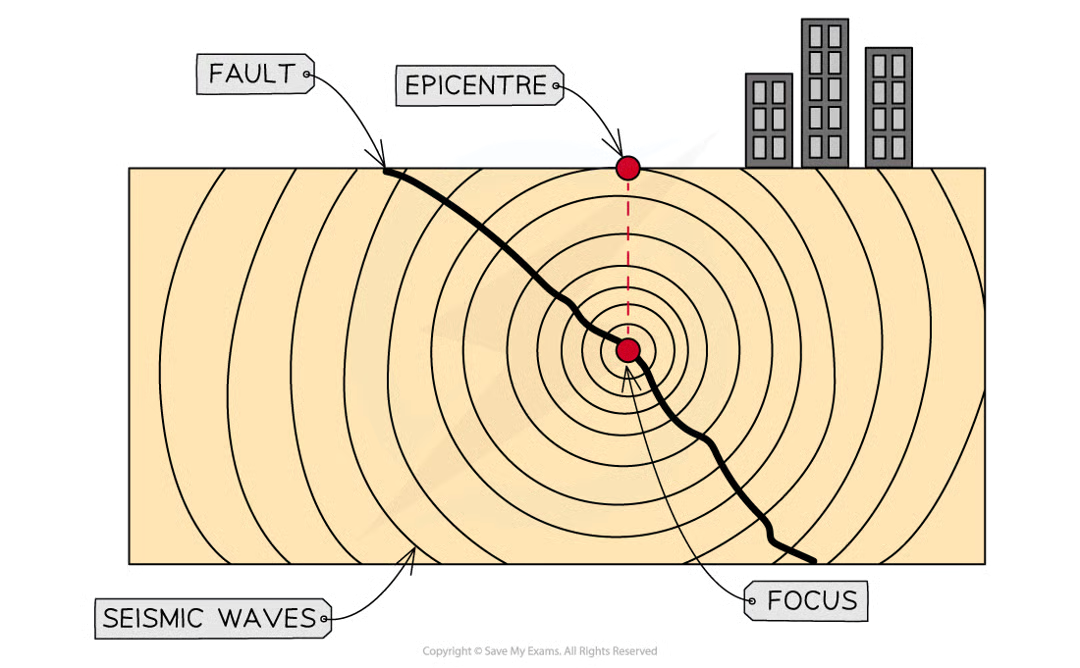
causes of earthquakes at plate boundaries
earthquake = the sudden violent shaking of the ground. happen at all 4 plate boundaries
focus = the point at which the earthquake starts below the earth’s surface
epicentre = the point on the earth’s surface directly above the focus
measuring earthquakes
seismometers are used to record the size of the seismic waves
the magnitude (amount of energy released) is measured on the moment magnitude scale which replaced the richter scale.
the damage caused by earthquakes is measured on the mercalli scale, which goes from 1 (not felt) to 10 (extreme)
deep focus earthquakes
the depth of the focus can affect the impact of an earthquake
deep focus = depth > 70km
often at destructive plate boundaries
very powerful
seismic waves move vertically so smaller area of effect
shallow focus earthquakes
the depth of the focus can affect the impact of an earthquake
shallow focus = depth < 70km
all plate boundaries
less powerful
seismic waves move horizontally so larger area of affect
how earthquakes happen - sequence
the same regardless of the boundary:
as tectonic plates move they get stuck
pressure builds up as the plates continue to try move
eventually they jolt free & the pressure is released as energy
earthquake starts at the focus, epicentre is above that
energy passes through the earth’s crust as waves - the earthquake
earthquakes can happen due to human activity e.g. drilling into the crust / mining
measuring volcano magnitude
measured on the Volcanic Explosivity Index (VEI) - an open ended scale but the highest recorded in human history was an 8 (tambora 1815)
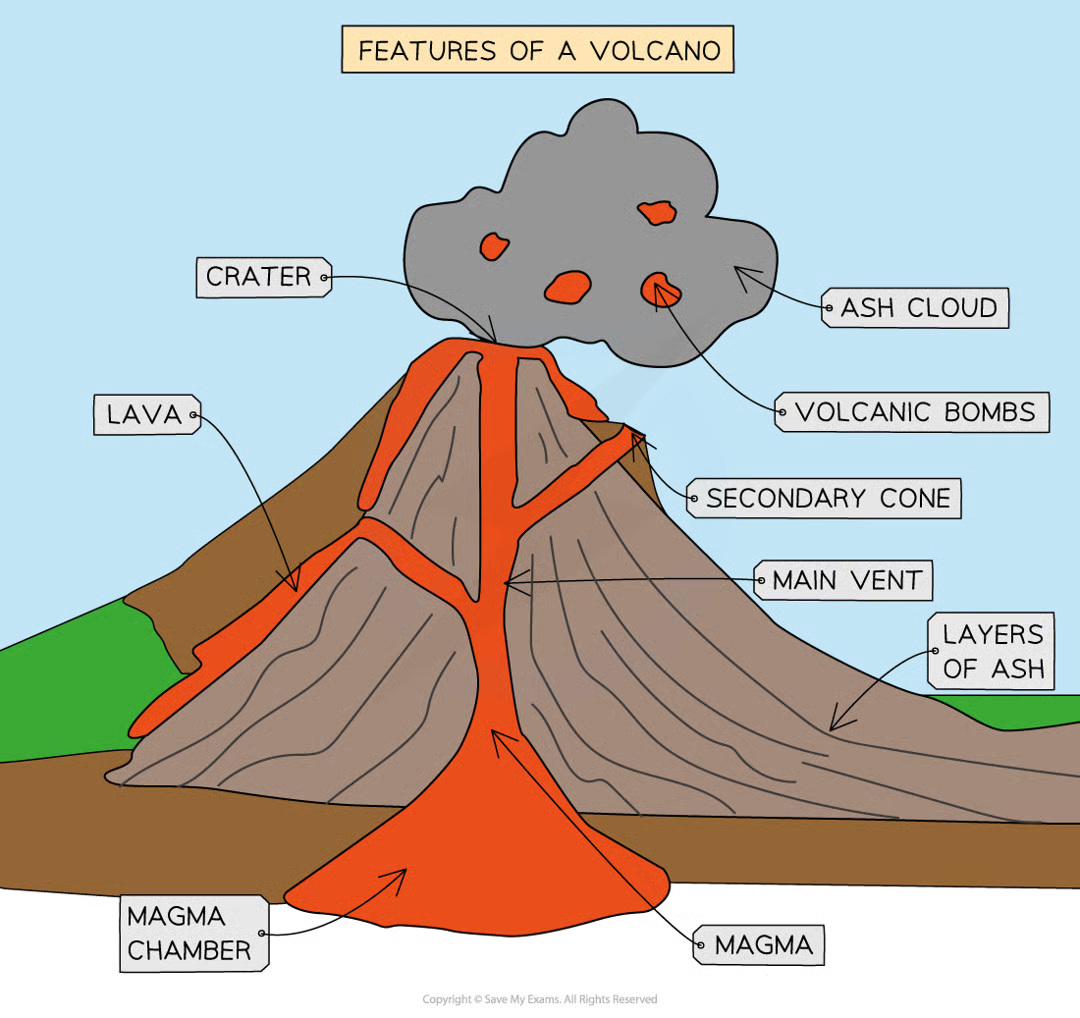
features of a volcano
volcanoes are formed when magma erupts onto the earth’s surface as lava through a vent in the earth’s crust
types of volcanoes
due to the type of lava erupted the formation of a volcano varies. there are 2 types, composite & shield
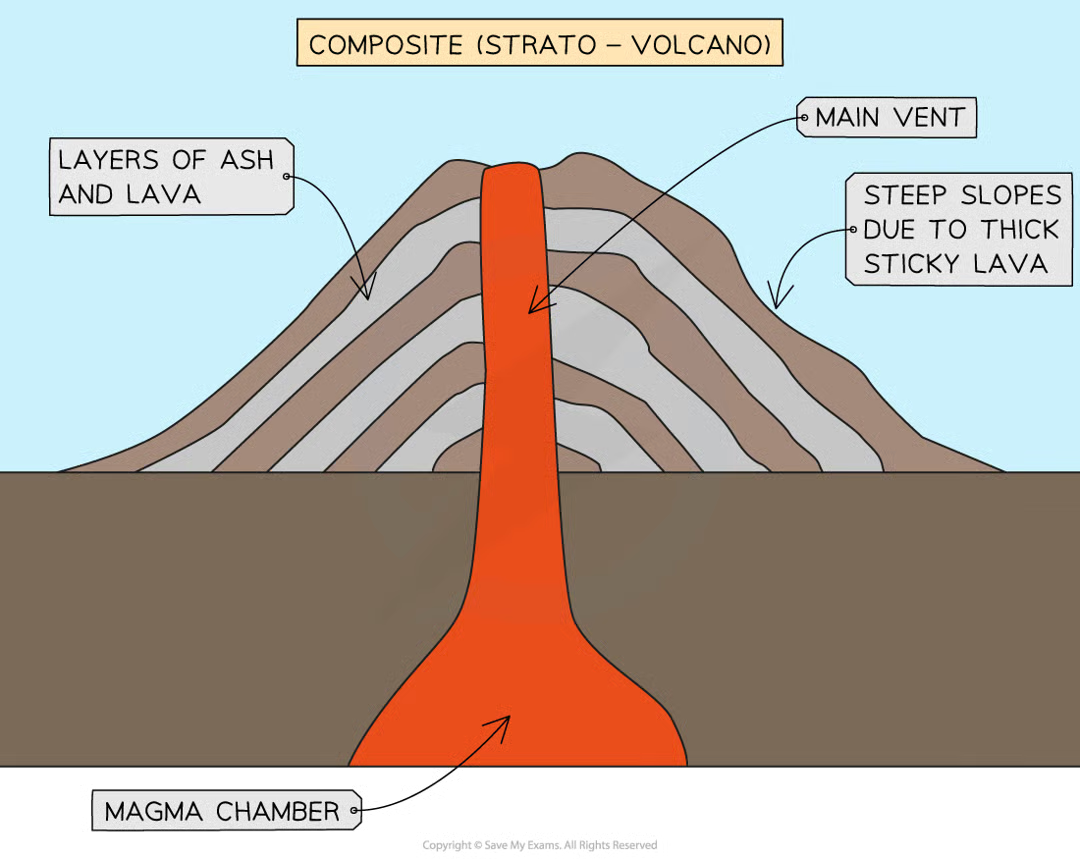
types of volcanoes: composite volcanoes
aka strato-volcanoes
steep sided
viscous (sticky) lava
more explosive eruptions
formed from alternating layers of ash & lava
tend to be on destructive plate boundaries
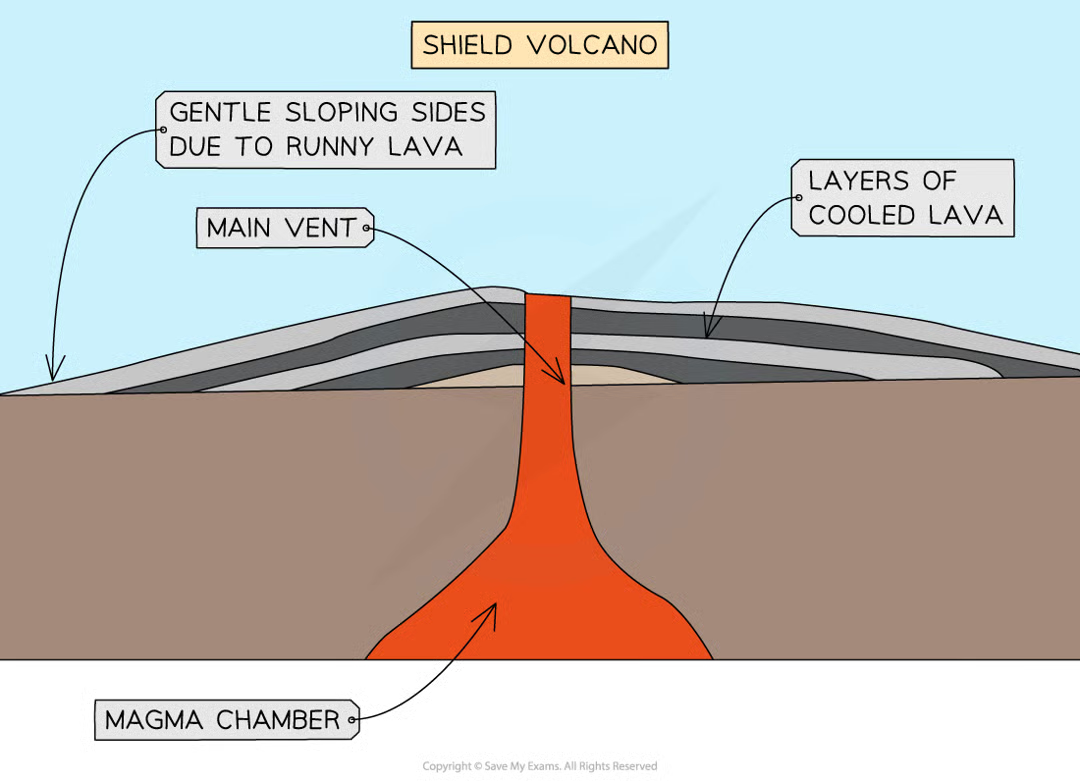
types of volcanoes: shield volcanoes
gently sloping sides
runny/thin lava
less explosive, gentle eruptions
tend to form on constructive plate boundaries or hot spots
frequent eruptions
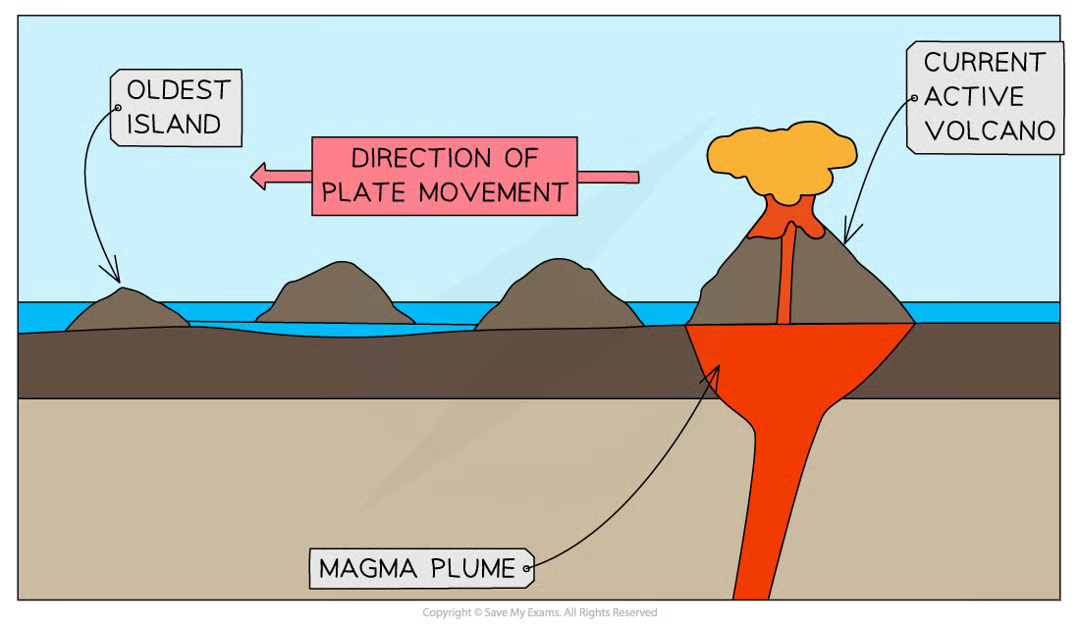
hot spot volcanoes
at a hot spot the tectonic plate passes over a plume of magma & the magma rises to the surface through cracks in the crust. as the tectonic plate moves slowly over the magma plume a line of islands may form e.g. hawaii
nepal background info
one of the poorest countries in the world - GDP of under $1000
landlocked, between china & india
in 2015 80% of the population lived in rural, often remote communities
nepal earthquake background info
25 april 2015 at 11:26am nepal was struck by an earthquake with a magnitude of 7.8
the epicentre was 80km northwest of kathmandu (the capital) in the gorka district
it had a shallow focus - only 15km beneath the surface
over 300 aftershocks followed the main earthquake
cause of nepal earthquake
caused because nepal is located on a collision boundary between the indian & eurasian plates
nepal earthquake effects
~9000 deaths
over 20,000 people injured
7,000 schools & 1,000 health facilities were damaged
almost 3.5 million people were made homeless
offices, shops & factories were destroyed so people couldn’t make a living
UNESCO world heritage sites and many temples were destroyed
loss of tourist income which nepal is reliant on
avalances on mount everest & in the langtang valley
landslides blocked roads & rivers
damages estimated between $7-10 billion - ~35% of GDP
immediate responses to nepal earthquake
$3 billion donations of money & aid from around the world - $3.3 million from china & $51 million from UK
many countries sent aid in the form of temporary shelters, medicines, food, water, clothes, search & rescue teams, medical staff
90% of the nepalese army was mobilised
tent cities were set up in kathmanu for those made homeless
GIS crisis mapping tool was used to coordinate the response
$3 million grant was provided by the asian development bank for emergency relief
long term reponses to nepal earthquake
landslides were cleared & roads repaired to restore access to remote rural communities
schools were rebuilt
earthquake drills were introduced to give people education on what to do in an earthquake
stricter building codes with more enforcement were introduced
$200 million was provided by the asian development bank for rebuilding
a new government task force was set up to plan for future earthquake events
monitoring of earthquakes
accurate prediction of earthquakes isn’t currently possible but monitoring is. many different monitoring methods are being used to help research possible prediction methods e.g:
tiltmeters - monitor ground changes
clusters of small earthquakes
changes in radon gas emissions
changes in animal behaviour
remote sensing of ground movement using satellites
preparation for earthquakes
countries can prepare for earthquakes in 4 main ways:
building design + earthquake resistant structures
land use planning
earthquake drills
emergency planning
earthquake preparation: building design
in developed countries building design & engineering is common to reduce the impact of earthquakes
building regulations & codes require new buildings to include earthquake resistant features e.g:
shutters on windows to prevent falling glass
cross bracing of steel frames
foundations sunk deep into bedrock
frames which sway with earthquake tremors
rubber shock absorbers to reduce tremors moving through the building
earthquake preparation: land use planning
mapping areas most at risk from earthquakes
planning can ensure valuable services e.g. fire service & hospitals aren’t build in high risk areas
densely populated housing can be located away from high risk areas
earthquake preparation: drills & education
in many countries earthquake drills are regularly carried out. they help people prepare for what to do in an earthquake to protect themselves
education about how to prepare homes means people are less likely to be injured by falling objects & furniture
earthquake remote sensing & GIS
remote sensing of the earth’s surface by satellites like Sentinel 1 provides data about changes in ground movement
geographic information systems (GIS) provides layers of data e.g. vulnerable areas, land use & infrastructure like roads. this data is then used to assist with land use planning
earthquake management in nepal (developing country)
earthquake experts view kathmandu as one of the most dangerous places in the world for earthquake risk
in 1977 the government created the kathmanu valley earthquake risk management project (KVERMP) which included the school earthquake safety program (SESP) which provided funding to schools for earthquake drills, training to make buildings more resistant to earthquakes, and earthquake safety day. however this was mainly in urban areas so people in rural areas didn’t have drills or knowledge. the 121 recognised languages in nepal make communication of advice & education difficult
83 open spaces around kathmanu were allocated to be used as camps for displaced populations where they would be supplied with shelter, food & medical services. however there weren’t enough supplies to begin with
the improved 1994 national building code & training building inspectors. however the building code was often ignored so many buildings still weren’t earthquake resistant
government’s 2009 national strategy for disaster risk management & 2010 national emergency operations centre to coordinate the humanitarian response & restoration of infrastructure. however due to political instability they weren’t as effective
nepal red cross society maintained 12 warehouses with stocks of emergency supplies. but these weren’t enough for the scale of the disaster
earthquake management in japan (developed country)
japan is one of the wealthiest countries in the world - GDP per capita $48,000. also one of the most seismically active places with 20% earthquakes over magnitude 6 happening there
earthquake drills practised regularly so people know what to do during + after an earthquake. but people weren’t prepared for tsunami
people were encouraged to have an emergency survival bag always packed & ready. but many didn’t have it
buildings were designed to be earthquake resistant, building codes tightened after 1995 kope earthquake, over 80% of buildings in tokyo are earthquake resistant. but many buildings didn’t survive the tsunami
3-10m sea walls built in some coastal areas + breakwaters off the coast at kamashi & ofunato bay. but the tsunami overtopped the sea walls
trains automatically stop when an earthquake is detected to avoid derailments + nuclear power stations automatically shut down. but there was an issue restoring the cooling system at the fukushima nuclear power plant leading to radioactive contamination in the area
$20 million tsunami warning service with 180 seismic stations & 80 water based sensors. warnings issued via phone, tv, sirens & loudspeakers. but people ignored tsunami warning as they thought they’d be protected by sea walls
climate change definition
large scale, long term changes in average temperatures and weather patterns
past patterns of climate change
global climate conditions of earth change over time leading to colder & warmer periods
last 2.6 million years = quaternary period. in this there have been glacial (colder) periods and interglacial (warmer) periods
ice age = whenever the earth has permanent ice sheets. non ice ages are greenhouse periods
climate proxies: ice cores
cross sections of arctic/antarctic ice which trap ash, air bubbles & microbes. air bubbles contain CO2 providing information about past temps
give info about the climate for the last 2.6 million years
climate proxies: global temperature data
records of temps across the world have been kept from around 1880. scientists can use records to study the earth’s temp & compare it to different time periods, work out global average temps & develop lists of hottest / coldest years
climate proxies: sea ice positions
sea ice forms when the ocean freezes
landfast ice = sea ice that’s attached to land
global warming means there’s less sea ice and ice breaks apart easily. arctic sea ice is at an all time low
comparing photos (e.g. from 1900s and recent satellite images) can sow how much ice levels have decreased
but they aren’t very reliable as they provide comparison not quantitative data and can be edited
climate proxies: tree rings
each ring of a tree shows 1 year’s growth. warmer period = trees grow more = larger rings. fossilised tree remains enable scientists to examine the climate over thousands of years
climate proxies: art & diaries
paintings & diaries provide evidence seen by people in the past e.g. paintings of the frost fairs on the river thames in london in the 1800s, diaries kept by people like a farmer from north-west england from 1815
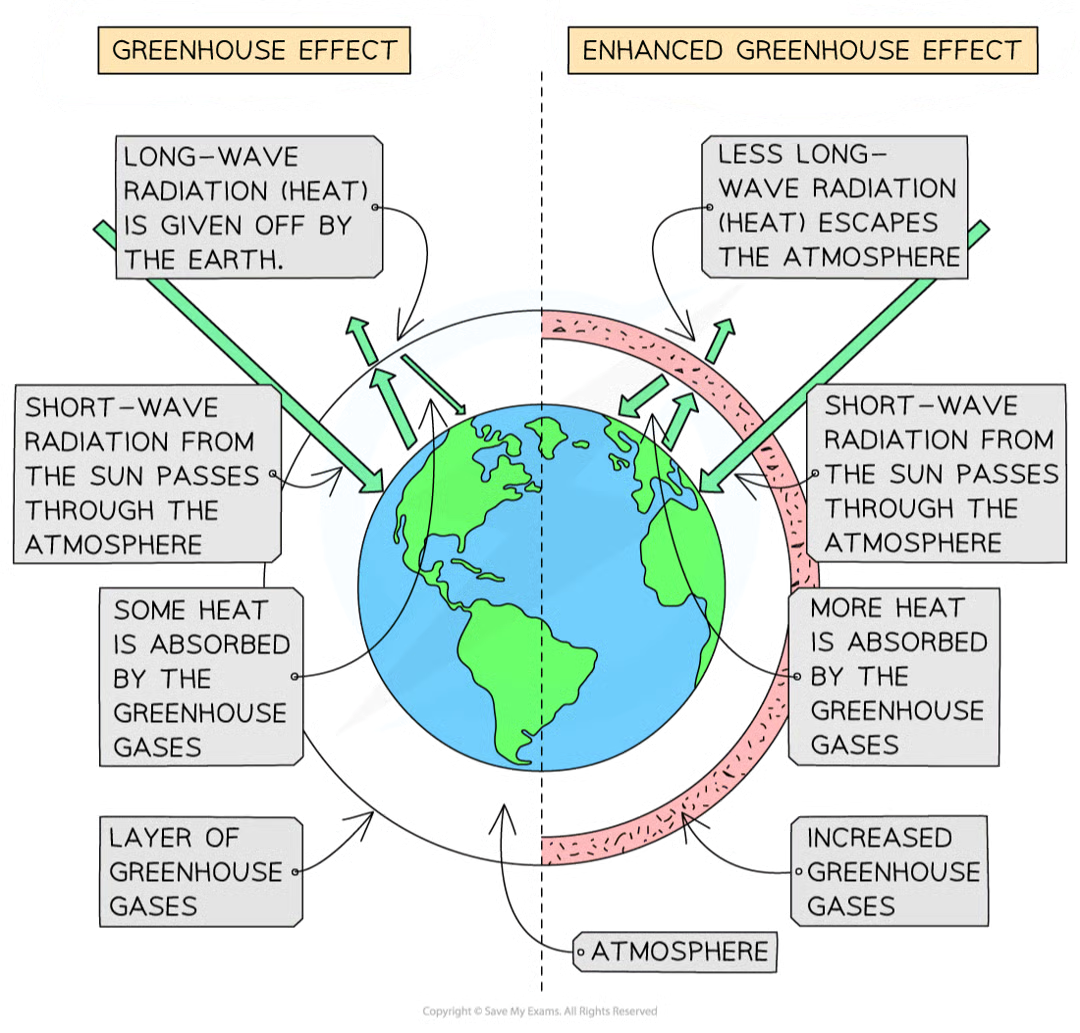
the natural greenhouse effect
essential to the survival of earth
greenhouse gases in the atmosphere allow short-wave radiation from the sun through to the earth’s surface
the radiation reflects off the earth’s surface (becoming long-wave radiation aka heat) & greenhouse gases absorb some of it & stop it from radiating out into space
this heats the earth up & maintains its average temp
without the greenhouse effect the average temp would be -18o
greenhouse gasses from natural sources
water vapour - evaporation from the oceans/seas & palnts
carbon dioxide - volcanic eruptions, wildfires, respiration
methane - oceans & soils from decomposition, termites
nitrous oxide - soils & oceans
causes of natural climate change: milankovitch cycles
long term changes to the earth’s orbit an position which change how much solar radiation the earth receives
obliquity - how the earth tilts on its axis
varies every 40,000 years. greater tilt = more severe seasons
precession - how the earth wobbles on its axis
every 24,000 years. can affect seasonal temps
eccentricity - changes in the shape of the earth’s orbit
changes every 100,000 years. more circular = colder, more elliptical = warmer
causes of natural climate change: volcanic eruptions
large scale eruptions lead to vast quantities of ash being ejected into the atmosphere, which blocks solar radiation, leading to a decrease in temps
when mount Pinatubo in the Philippines erupted in 1991 it put 20 million tones of sulphur dioxide & ask 20 miles into the atmosphere, reducing global sunlight by 10% and cooling the planet by 1.3o for 2 years
causes of natural climate change: sunspots
sunspots = dark spots on the sun’s surface
increased sunspot activity = higher average temps - sunspots show that the sun’s effectiveness at radiating heat is increased. however the IPCC states that the role of sunspots in climate change is minimal
natural vs enhanced greenhouse effect
human sources of greenhouse gases
carbon dioxide (CO2): released from burning of fossil fuels in power stations & vehicles, burning of wood, deforestation (as less CO2 is removed from atmosphere)
methane (CH4): released from decay of organic matter eg manure, landfill waste, crops, also released by cattle and during rice cultivation
nitrous oxide (N2O): released from artificial fertilisers & burning fossil fuels
chlorofluorocarbons (CFCs): released from aerosols, refrigeration units & air conditioning
human causes of climate change
fossil fuels account for ~50% of global greenhouse emissions. used in transport, construction, heating, manufacturing & energy production
agriculture - deforestation to clear land for grazing/crops means less CO2 is absorbed in photosynthesis. production of fertilisers & pesticides uses fossil fuels. increased dairy & beef cattle + rice cultivation increases methane emissions. artificial fertilisers increase nitrogen oxide emissions
construction - cement manufacture releases CO2 (made from limestone which contains carbon)
transport - increasing global population = more cars/lorries/planes. more transport uses petrol/diesel which comes from oil which releases CO2
sea level rise as a result of climate change
sea level has risen 20-23cm since 1880. each year it rises another 3.2mm. it’s estimated that 410 million people will be at risk from sea level rise by 2100. there are 3 reasons for sea level rise:
thermal expansion - water expands when warm so volume of water increases
melting glaciers & ice sheets adds water to seas/oceans
impacts:
social - displacement of people from homes & communities, food & water supplies threatened from salt intrusion (salt in freshwater stores), food shortages lead to malnutrition & famine
environmental - destruction of ecosystems eg coral reefs & mangroves, ocean acidification, increased coastal erosion, changing patterns of animal migration & behaviour
economic - cost of flood defences increases, relocation of people & building new homes is expensive, loss of jobs, reduction in tourism due to impact on coastal resorts
in the Maldives over 80% of islands are >1m above sea level & it’s been forecast that if sea continues to rise islands will be uninhabitable by 2050. the government has constructed an artificial island (Hulhumalé) as well as flood walls & defences around islands
ocean acidification
decreasing pH levels due to increasing levels of carbon dioxide absorbed by ocean/sea water
extreme weather events as a result of climate change
warmer sea/ocean temps = more evaporation = more frequent & severe storms. droughts & heatwaves are more common due to increasing global temps
the intergovernmental panel on climate change predicts that a 1.5o increase in average global temp will make 1 in 50 year heatwaves 8.5x more likely, 1 in 10 year droughts 2x more likely, and 1 in 10 year storms 1.5x more likely
extreme weather events like flooding & drought are forcing people to move - UN says an annual average of 21.5 million people were displaced by weather related events between 2008-2016. this could rise to a total of 1.2 billion people displaced by 2050. impacts include:
social - people displaced, food & water supplies threatened by flooding & drought, reduction of crop yields (20% in sub-saharan africa), food shortages = malnutrition & famine, less rain = lack of freshwater, higher temps & flooding = spread of disease
environmental - destruction of ecosystems eg coral reef bleaching & wildfires destroying forests, increased sea temps, changing animal behaviour / migration / hibernation, reduced biodiversity due to loss of species
economic - relocation & building new homes is expensive, loss of jobs, repairs are expensive, loss of crops reduces income & exports, decline in tourism eg lack of snowfall in ski resorts, extreme temps deterring visitors
changing weather patterns in the UK as a result of climate change
all 10 warmest years on record were in the last 20 years and 6 of the 10 wettest years were in the last 25 years. it’s predicted that by 2050 the UK will have higher average temps, wetter winters and drier summers. impacts include:
social - increased deaths in extreme heat especially people with respiratory & heart conditions, fewer deaths from cold, increase in hosepipe bans
environmental - ecosystems affected by drought / flooding / wildfires, changes in species due to higher temps
economic - increase in tourism due to warmer drier climate, longer growing systems increase income & exports, new warmer plants introduced, less water available for irrigation & power stations
landscape
the character of an area, resulting from the action and interaction of natural & human elements
a landscape’s character will depend on its initial geology, which gives the landscape its relief, which attracts human action/interaction. for example slate found in the mountains of north Wales attracted quarrying
very few landscapes are totally natural - people have had some sort of impact eg planting trees
the UK’s landscape is dynamic (constantly changing):
glaciers once covered the majority of the country
the sea surrounds the land making the UK an island with a changing coastline
rivers flow across the land from their sources to the seas
elements of a landscape
natural/physical: physical features eg mountains & coastlines, water eg lakes, rivers, ponds
human: human aspect eg farmland & buildings, infrastructure eg pylons & fences, landscaped eg road verges & gardens
biological: the living element eg trees, grass, animals, habitats eg marshlands & hedges
variable: temporary - seasonal or weather dependent things eg frozen lakes or storms, weather & couds, smells & sounds
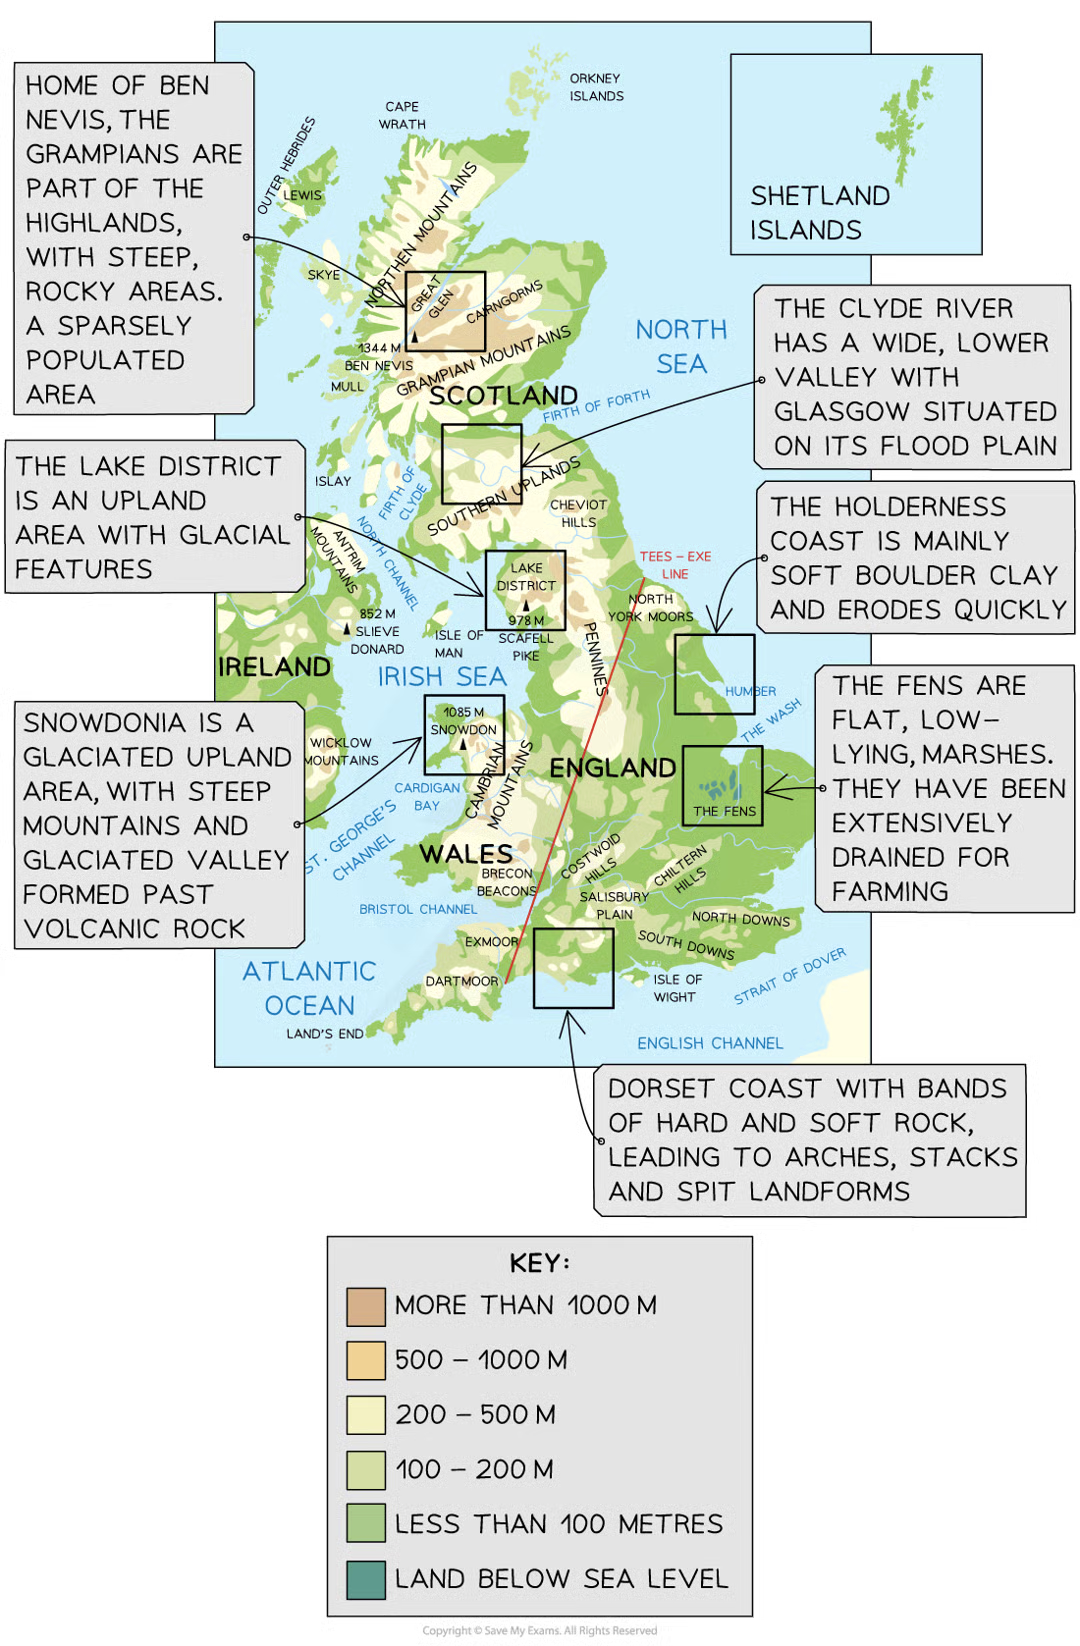
distribution of UK landscapes
uplands are found mostly in the north & west e.g. northern ireland, scotland, wales and north england (eg lake district, grampian mountains, snowdonia)
lowlands are found in the south & east - central & southern england (eg cotswolds, norfolk, south downs)
most cities are in lowland areas and often on main river courses e.g. liverpool on the mersey, bristol on the severn estuary & river avon
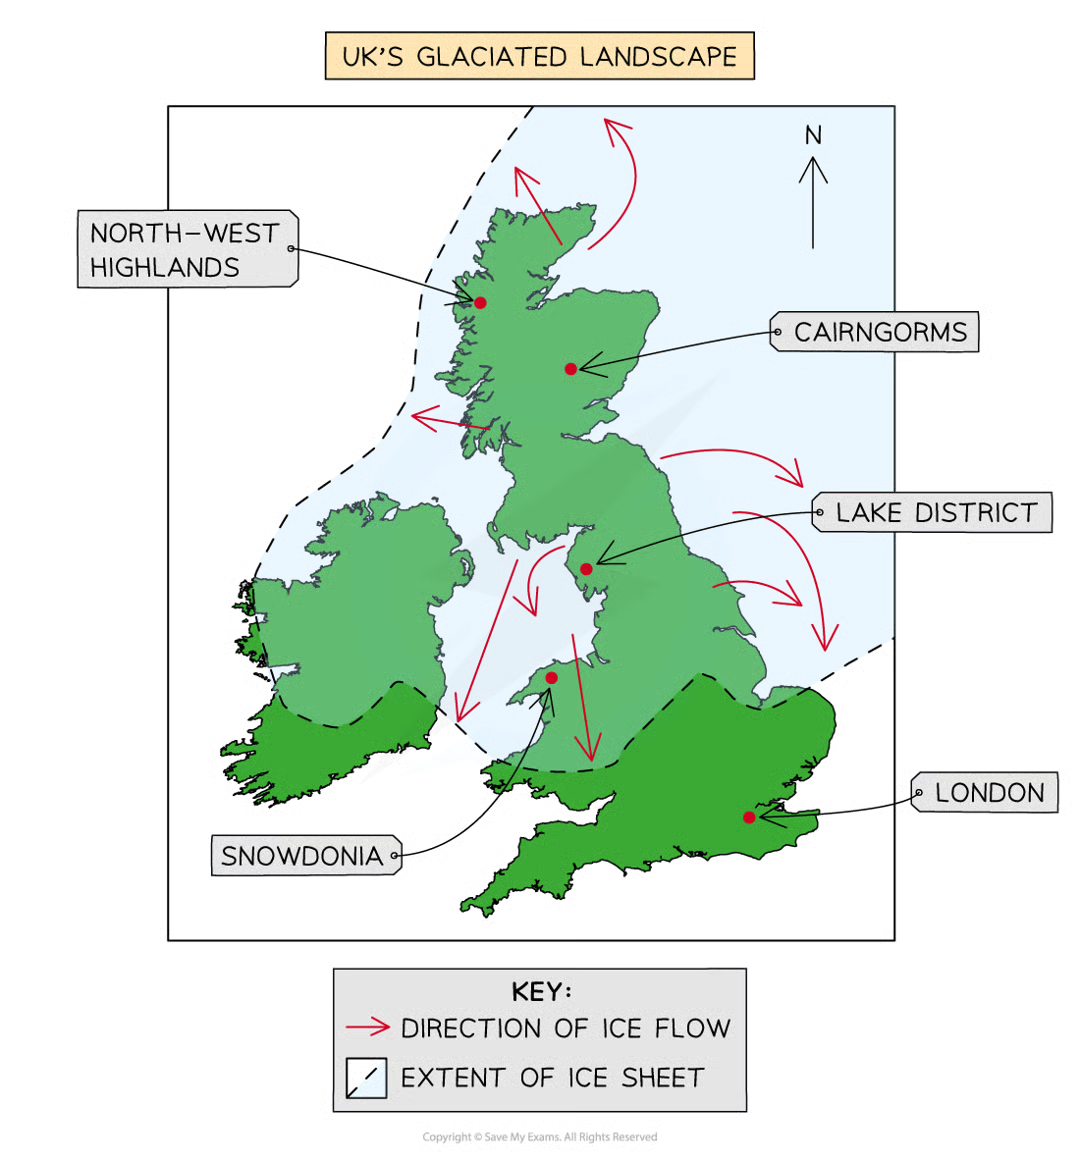
glaciation in the UK
europe’s last ice age peaked 20,000 years ago & ended 11,500 years ago. at that time 30% of the world’s land was covered in ice. temps remained below 0o all year in northern regions like scotland, allowing a 1km thick ice sheet to cover most of the country
ireland, wales, northern england, scotland, and the midlands were covered in perpetual ice, and much of the country was uninhabitable for humans
during the ice age, areas covered in ice were weathered & eroded to create a dramatic mountain scenery. afterwards, those areas were exposed as deep valleys with sediment deposits
today much of upland britain is covered in u-shaped valleys and steep, eroded mountain peaks