3 - Population Growth
1/11
There's no tags or description
Looks like no tags are added yet.
Name | Mastery | Learn | Test | Matching | Spaced |
|---|
No study sessions yet.
12 Terms
How has wirld population growth looked like in the past
in the year 1 AD world population was about 300 million → it took more than 1500 years to double
From 1750, world population doubled again in 150 years → 1.7 billion to 5 billion in 1990
From 1950, world population doubled again in 40 years → 2.5 billion to 5 billion in 1990
The size of the population is expected to double again by 2050 (60 years) → 10 billion
2030: 8.5 billion
2050: 9.7 billion
2100: 10.9 billion
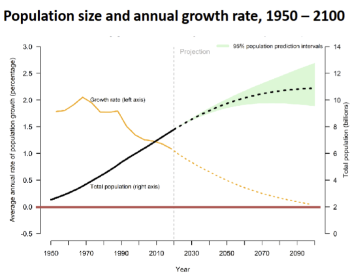
Worlds pop contirnues to grow but at a slower pace than at any time since 1950
growth rate of the worlds population peaked in 1965-1970 (2.1%). The rate of population growth has slowed by half, falling below 1.1% per year in 2015-20
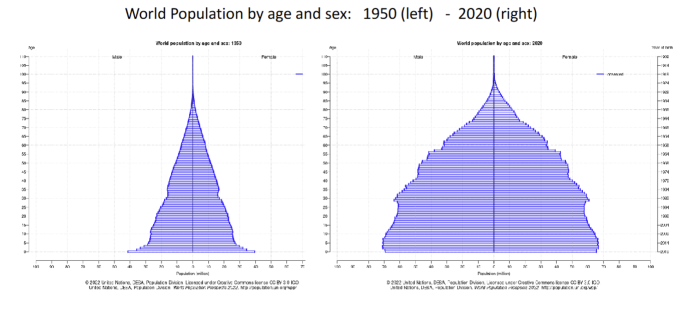
How did world population by age and sex change
Is global population growth actually growing?
A growing number of countries are experiencing a decrease in population size→ low fertility and high emigration
2010-2019: 14/27 countries show a negative rate of natural population increase
2019-2050: 47/55 countries show a negative rate of natural population increase
How has there been a demographic transition?
global population trends are driven largely by trends in fertiliity which has fallen markedly over recent decades in many countries
Life expectancy at birth for the world reached 72.6 years in 2019 having added more than 8 years since 1990
While considerable progress has been made in reducing mortality and closing the longevity differential between countries, the gaps remain wide
Historically, low levels of fertility combined with increased longevity ensure that population in virtually all countries and areas are growing older
2018, ppl aged 65 or over outnumber children under 5
Btw 2019-50 number of ppl aged 65 or over is projected to more than double
population ageing will have a profound effect on the potential support ratio → number of ppl working age per person age 65+
What are the phases of demographic transition?
1. Mortality and fertility → decline ( 1st mortality decreases then fertility)
decrease mortality → fertility remains high. Mortality declines most at youngest ages, causing an increase in the proportion of children in the population → decrease child support ratio.
Families and Gov may struggle to achieve educational goals for the high number of children
2. Population growth rates first accelerate due to difference btw mortality and fertility → then slow down again due to change in fertility rates.
decrease fertility → working age pop grows faster than pop as a whole → increase child support ratio
Economic advantages of having a large share of population in working years → demographic dividend
3. Society moved toward low fertility, long life and increased old population
increase life expectancy → increase in elderly population
decrease fertility → slows the growth of working age population → increase old dependency ratio
If the elderly are supported by transfers a higher total dependency ratio means a greater burden on the working age population
If elderly contribute through their own support through savings and asset accumulation in their lives and dissave in retirement, population ageing may cause lower aggregate saving rates, meaning less money available in the economy to invest
What are the drivers of demographic transition?
1. Mortality transition
the world demographic transition started in Europe around 1800 with a persisting decline in mortality
many low-income populations did not begin the mortality transition until some time in the XX century → rapid gains in life expectancy
2. Fertility transition
couples wish to have certain number of surviving children
decline in child mortality → decline in fertility
Some improvements in child survival is a response to parental decisions to invest more in health and welfare of a small number of children (quantity-quality trade off)
Changes in economic costs and benefits of childbearing (rearing): An economic Model of fertility: The Demand for Children (Becker,1981)
Bearing and rearing children is time intensive: increase tech progress → increase labour productivity → increase value of time → increase relative cost of children → decrease children
changes in labour productivity of women are particularly relevant
Rising income shifts consumption demand towards non-agricultural goods: increase returns to education → increase investment in education 0> increase cost of children → decrease children quantity
3. Population growth
combination of fertility and mortality determines population growth:
in so far as modern economies are characterised by:
increase in price of time (increase labour productivity) → hence fewer children
Decline in price of child quality (increase life expectancy, increase schooling opportunities, increase returns to schooling)
Increase in price of child quality (Increase in price of child quantity (decrease cost of fertility control)
Decline in fertility is consistent with Demand for Children model
4. Shifts in age distribution
These shifts are reflected in changes in “support ratios”:
child support ratio: number of adults in working age per children → working-age population (15-64) divided by young population (0-14)
Old age support ratio: Number of adults in working age per old individual → working age population (15-64) divided by old age population (65+)
total support ratio: number of adults in working age per non-working age individual (children and old individuals) → working age population (15-64) divided by young population (0-14) + old population (65+)
this ratio is 12 persons Sub-saharan africa
And 2 for Europe, New Zealand, Eastern and South-eastern Asia
What is the pessimists view of population growth and economic growth?
Malthus (1798)
increase income per capita → increase marriage → increase children (labour supply) → decrease wages and increase food prices → decrease consumption → decrease marriage and decrease fertility
Coale and Hoover (1958)
increase fertility → increase proportion of children → no immediate increase in labour supply
Children consmumere more than they produce → increase children → decrease consumption (children are costly)
The only escape is → tech progress : using tech if society can produce more supply of food then they can be out of this Malthusain trap
What is the optimists view of population growth and economic growth?
Smith, Marshall, Kuznets, Hirschman)
a large population brings economies of scale in production and consumption → increase demand
population pressure and economies of scale encourage technical innovation
Piketty (2014) → economic growth includes a purely demographic component and a purely economic component
more people demand more goods but this doesn’t lead to economic growth
only the latter allows for improvement in the SoL
What happens in low income countries for pop growth and econ growth
SR: increase pop growth → decrease econ growth → large number of dependent children
LR: young ppl → working adults → demographic dividend
What happens in high income countries for pop growth and econ growth
decrease pop growth → ageing population (low support ratio)
What are policy challenges of the demographic transition?
global population trends mask considerable and growung heterogeneity of demographic experiences around the world
While fertility and population growth continue to be high in the world’s least developed countries, fertility is failing, and populations are ageing everywhere else
Population ageing represents a significant achievement but many developing countries will grow old before they grow rich
Population dynamics are at the centre of the main development challenges in the XXI centruy
future population dynamics will be determined by today’s policies
Demographic dividend → the window of opportunity for development requires investment in the creation of new jobs and education
Population ageing → ensuring that national health care systems are capable of delivering services to a growing older population (dementia and other mental health problems)
Existing social security arrangements need to be reviewed. Rules for retirement need to be redefined to account for the balance between the duration of working lives and the duration of retired life
What are the policy challenges of demographic transition with policies to reduce fertility?
Externalities: social cost > private cost. If parents do not fully internalise the costs of children they are likely to have higher fertility than it is optimal from society’s point of view
tragedy of the commons → Gov spending on social welfare can be viewed as a common resource (e.g. education, health etc) → gov services are subject to congestion
Decrease wages → poor areas: individually it is rational to have many children as a strategy for maximising current family labour income and their own security in old age → increase labour supply → decrease wages (parents and children) → rents
Incomplete information: contraception information is poor → individuals have more children than they would want had they more information about fertility control