ap stats chapter 1
1/25
There's no tags or description
Looks like no tags are added yet.
Name | Mastery | Learn | Test | Matching | Spaced |
|---|
No study sessions yet.
26 Terms
individuals
objects descirbed by a set of data (‘WHO” is being measured)
variable
any characteristc of an individual (“WHAT” is being measured)
distribution
tells us what values a variable takes and how often it takes those values
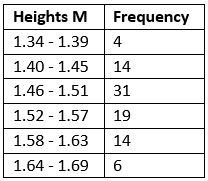
frequency table
counts for each category of data
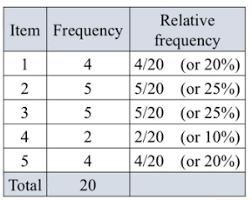
relative frequency table
a percent for each category of data
Name three ways to make a misleading graph
violating the area principle
vertical axis doesn’t start with zero
using pictures
marginal distributions
row and column totals (total of an individual category)
conditional distributions
relies on a condition
Data for categorical variables are displayed in a…
bar graph or pie chart
Data for quantitative variables are displayed in a…
dotplot, stemplot, or histogram
Bars in a bar graph…
DON’T touch
Bars in a histogram…
DO touch
In S.O.C.S., where do we use units?
Center, Spread, and Outliers
In S.O.C.S., where do we use comparison symbols?
Center and Spread
The mean is NOT a…
resistant measure of center
The MEDIAN is resistant to…
extreme data points
The mean and median will be close together…
if the distribution is roughly symmetrical
In a skewed distribution, the mean…
is pulled towards the long tail
What do we use for the CENTER if the distribution is ROUGHLY SYMMETRIC?
Mean
What do we use for the CENTER if the distribution is NON-SYMMETRIC?
Median
How can we identify outliers?
1.5 x IQR rule
lower bound outlier
Q1 - 1.5 x IQR
upper bound outlier
Q3 + 1.5 x IQR
What term do we use when interpreting the standard deviation?
“typically vary”
What do we use for the SPREAD if the distribution is ROUGHLY SYMMETRIC?
standard deviation
What do we use for the SPREAD if the distribution is NON-SYMMETRIC?
IQR