Textual Aids
1/10
There's no tags or description
Looks like no tags are added yet.
Name | Mastery | Learn | Test | Matching | Spaced | Call with Kai |
|---|
No analytics yet
Send a link to your students to track their progress
11 Terms
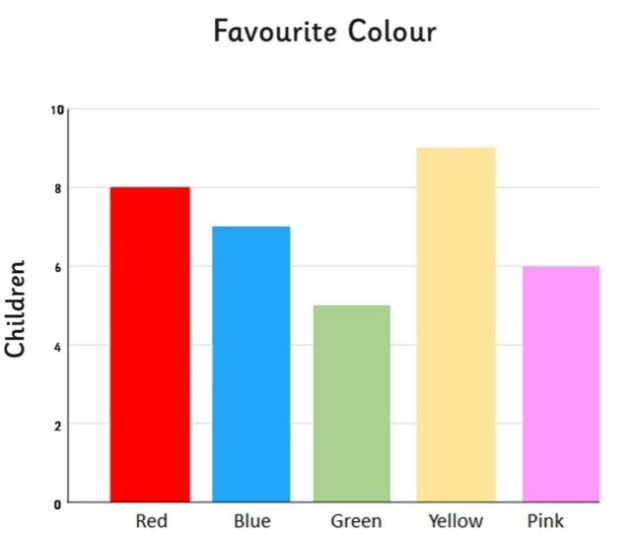
Bar Graph
uses rectangular bars to represent data
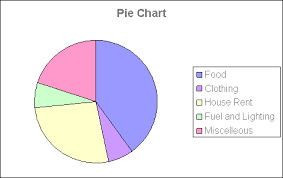
Pie chart
A circular chart divided into slices
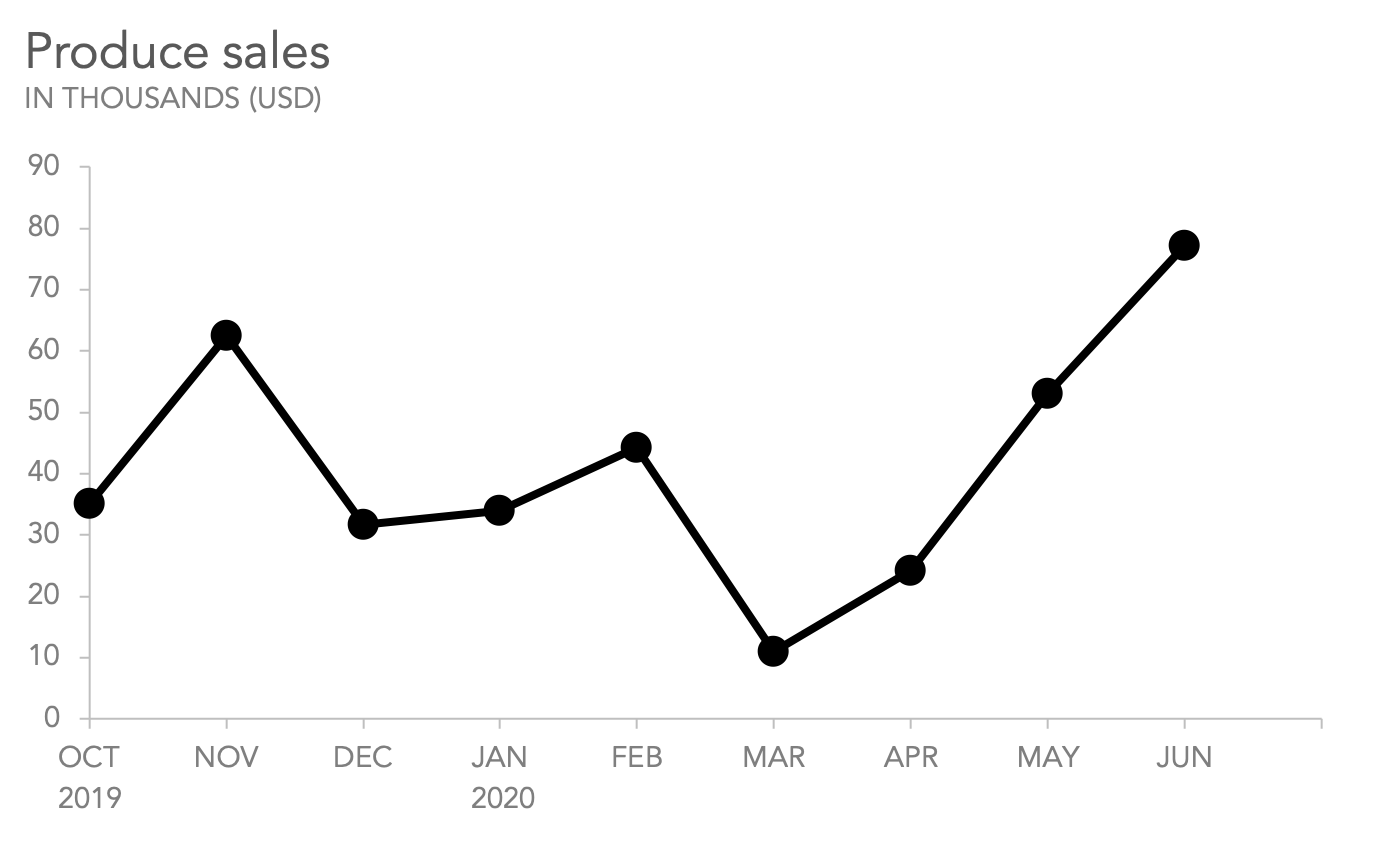
Line Graph
Commonly drawn to show information that changes over time.
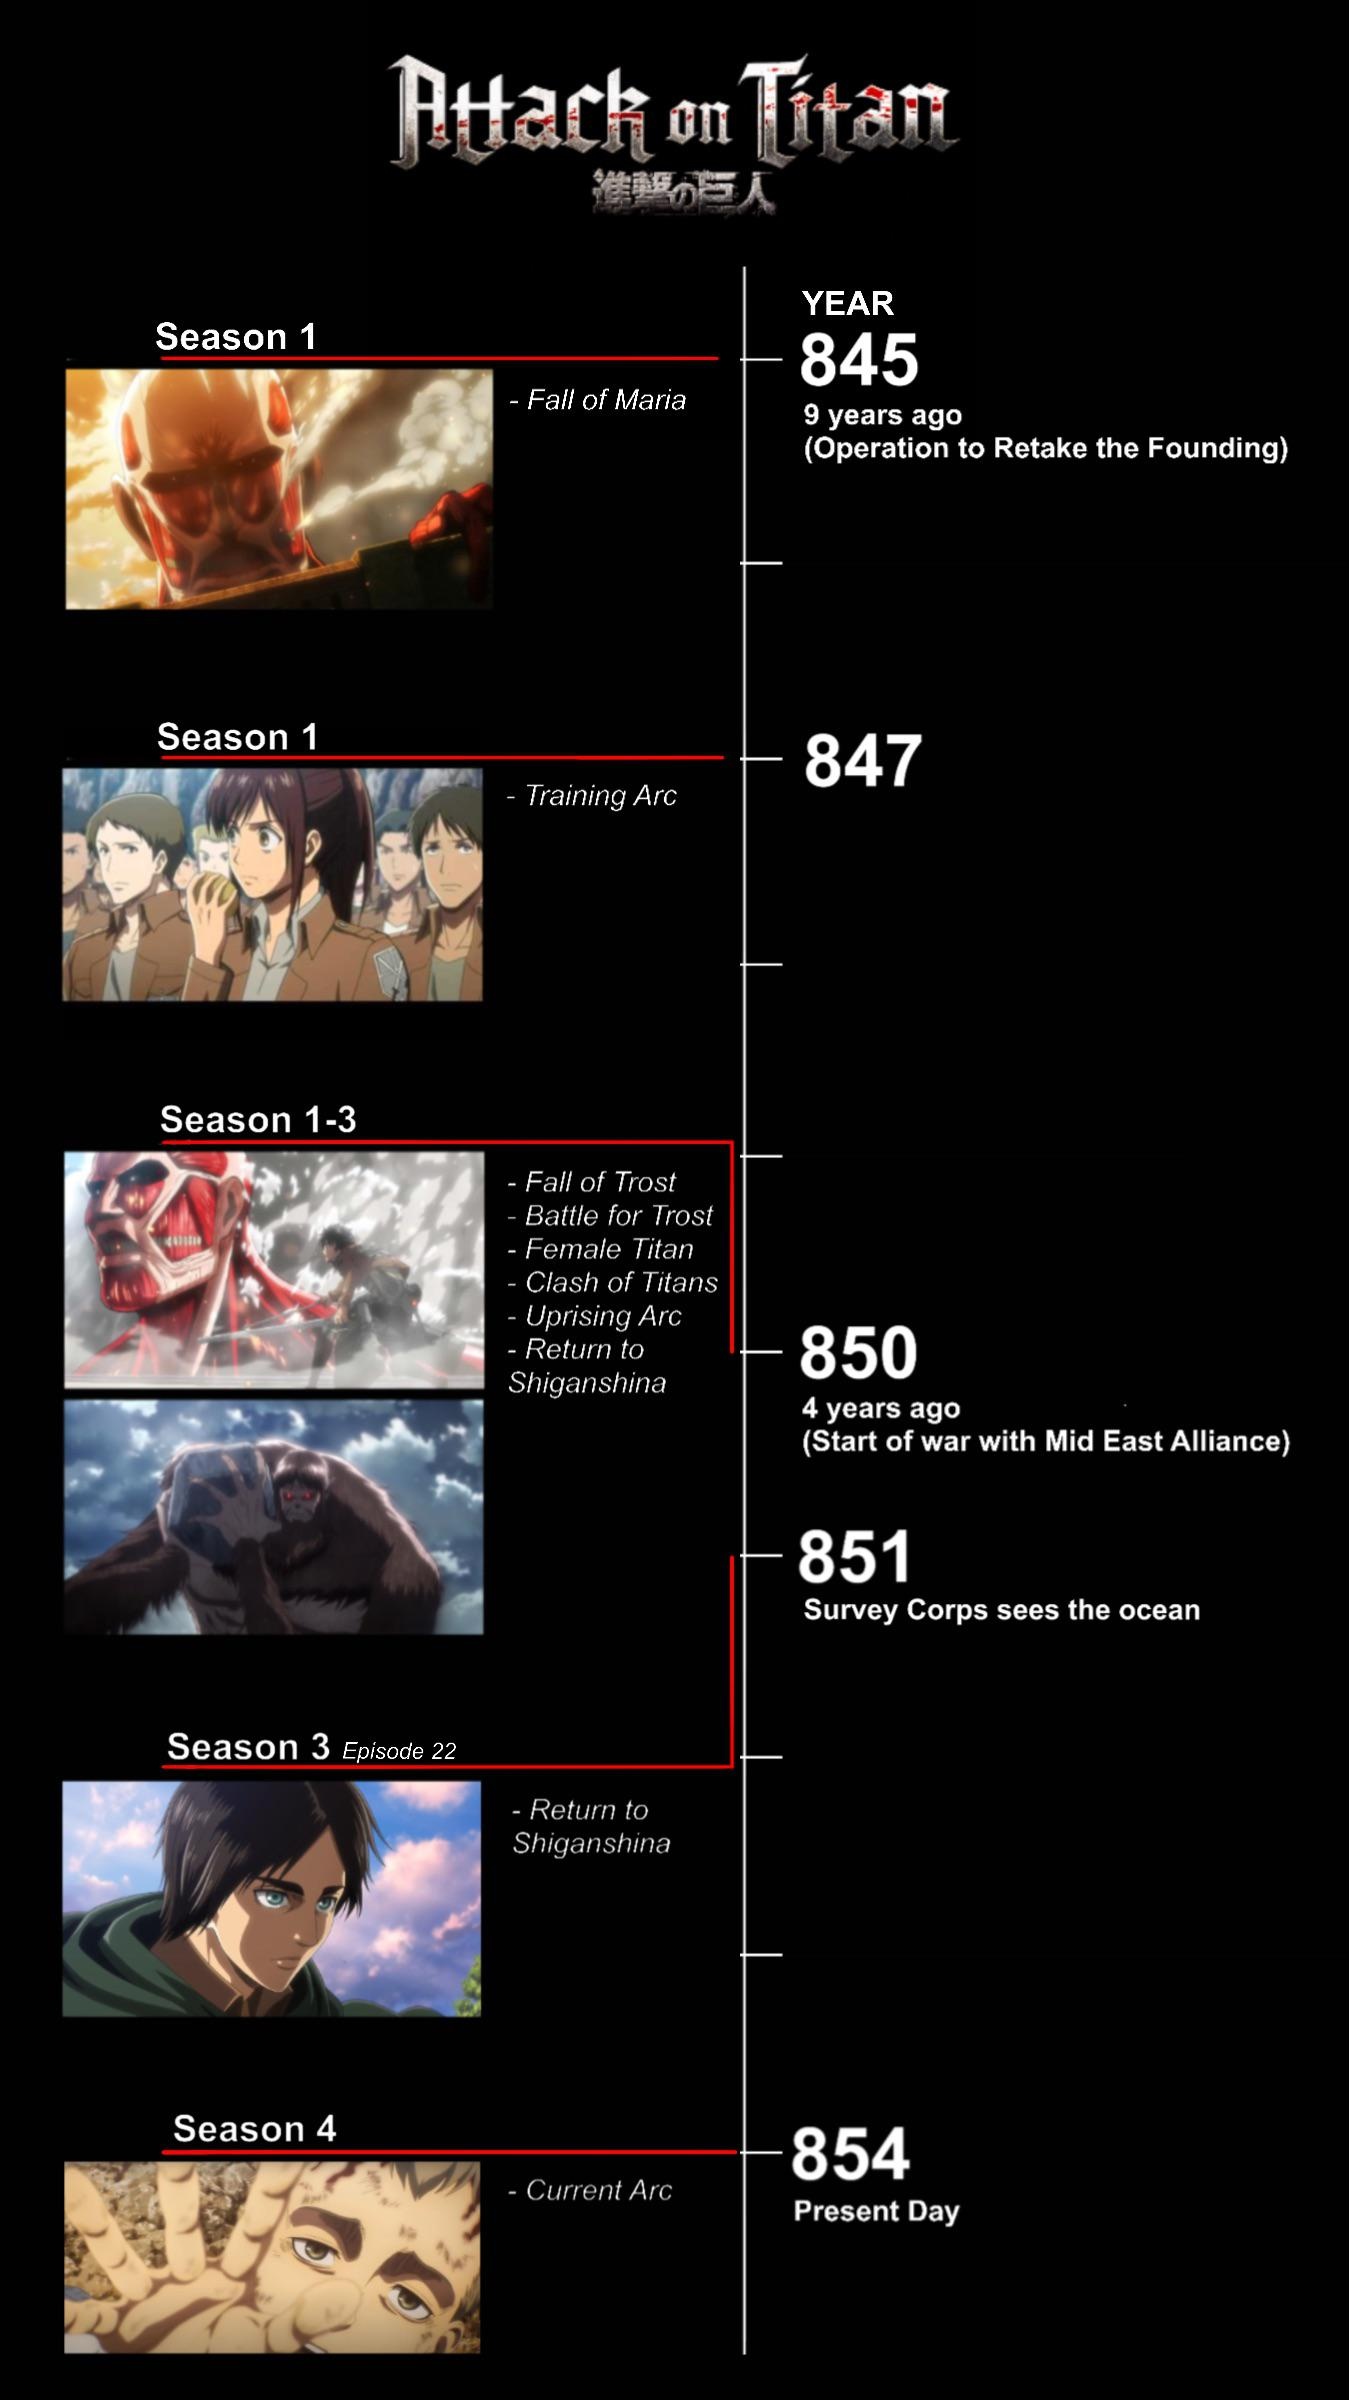
Time line
Graphical representation that displays events in chronological order from the earliest to the latest.
Table
a systematic arrangement of data in rows and columns, allowing for easy comparison and organization of information.
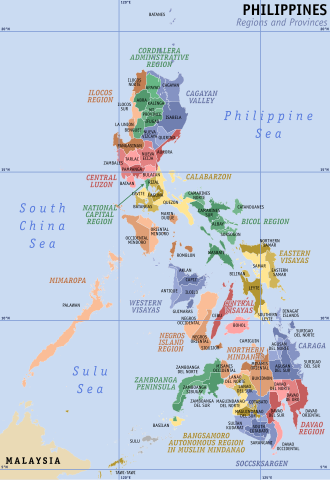
Map
Visual representation of an area,
showing geographic features, landmarks,
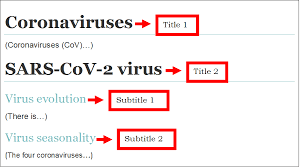
Title and Subtitles
Provide an overall summary, & break down the text into smaller, digestible parts
Illustrations
on-textual visual element, such as a picture, diagram, or photograph

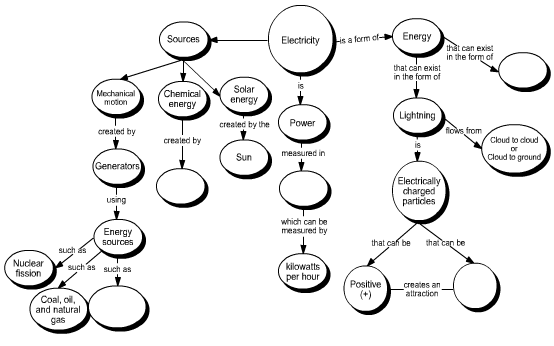
Concept map
visual representation that illustrates the relationships between different concepts, ideas, or information.
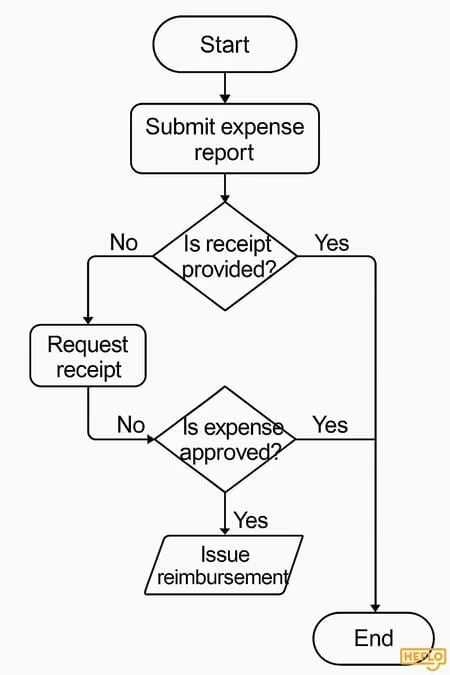
Flow chart
Visual representation that illustrates the relationships between different concepts, ideas, or information.
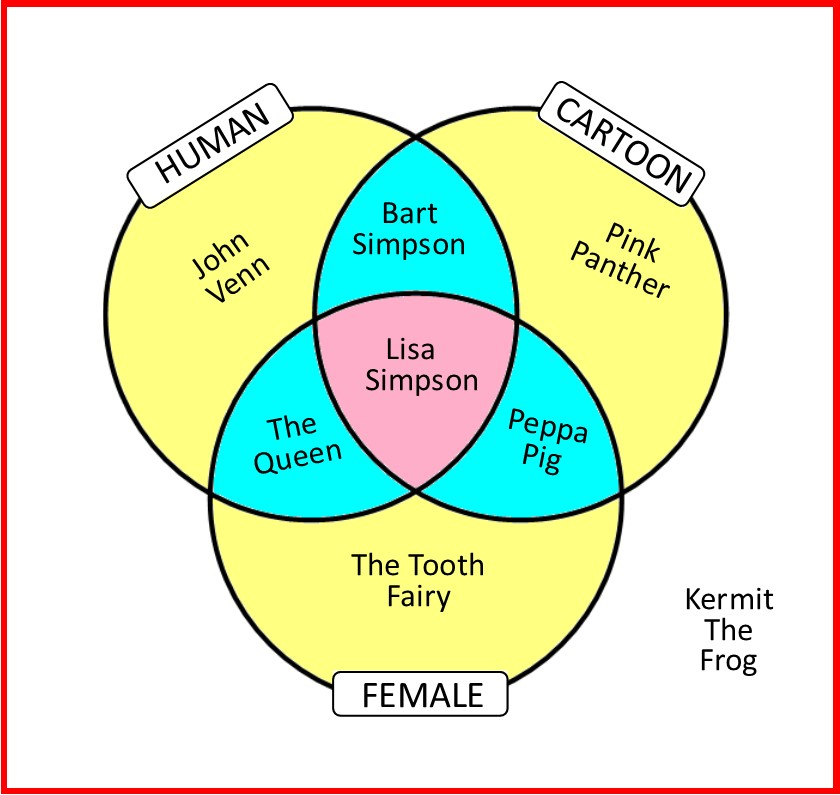
Venn Diagram
visual tool using overlapping circles to show the logical relationships between sets of data