statistics revision for the mock
1/17
Earn XP
Description and Tags
how to in r studios and what some topics are
Name | Mastery | Learn | Test | Matching | Spaced | Call with Kai |
|---|
No analytics yet
Send a link to your students to track their progress
18 Terms
how to take a peek at the data
glimpse (what its called)
what function is used to make a box plot and how
tukeyboxplot(y= …., x= ….)
how to make a scatterplot
scatterplot(x=……, y= …. , data = ….)
scatterplot( x = … ,
y= …..,
best_fit_line= TRUE,
data=….)
how do you know what is on the x axis and what is on the y
x= time, catagories and treatment groups. y = mesurements, counts and scores
what is univariate normality
iis each variable normally distributed
how to see wether each variable is normally distributed
is the skewness and kurtosis values between : -2 and +2. skew and kurtosis should be found for both variables
how to find the skew and kurosis
skew_..= …::skew(….),
kurt_…= …::kurtosi(….)
what function is needed for a liner regression model
lm.beta
what does this equation mean
(Y=a+bX). Y= outcome. A = intercept where the line of best fit intercepts the y axis . B= (the slop) The gradiant. positive value for b indicates as X increases the line goes up - negative the opposite x
what is multiple liner regression
when you have two or more predictor variables
what is liner regression
the outcome variable is continuous and mesured on interval or ratio scale
what is the coefficient of determination
R² is the proportion of variation the DEpendent variable that is predictable from the INdependent variable. it can be used to test the hypothesis or prediction of future outcome
what is R² of 0
The model does not explain any of the variation in the dependent variable
R² of 1
the model explains all of the varaition in dependent variable
what are unstandardised coeffients
the original output form the regression analysis. represent the change in the dependent variable for each unit increase in the independent variable
what are standardised coefficients
the underlying data have been standardized so that the variances of dependent and independent variables are equal to 1. Therefore, standardized coefficients are unitless and refer to how many standard deviations a dependent variable will change, per standard deviation increase in the predictor variable.t
what is mediation analysis
it helps to see the relationship between different variables
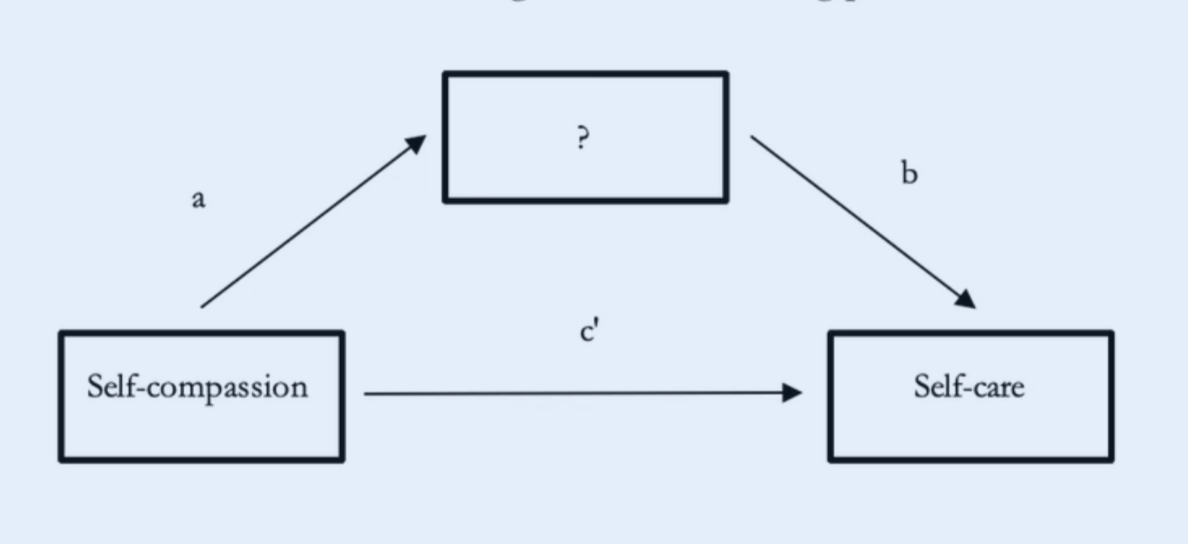
what are the paths or mediation analysis
a = relationship between predictor and mediator
b = mediator and outcome
c’= direct relationship between predictor and outcome after taking the mediator into account,
c path = total efffect the relationship between x and y while ignoring the mediator