CS Exam 3: Cell Arrays, Excel + Text Files, Plotting, Structure Arrays, Numerical Methods
1/12
There's no tags or description
Looks like no tags are added yet.
Name | Mastery | Learn | Test | Matching | Spaced | Call with Kai |
|---|
No analytics yet
Send a link to your students to track their progress
13 Terms
% Assume the following variables exist: ca1, ca2, ca3, ca4, ca5
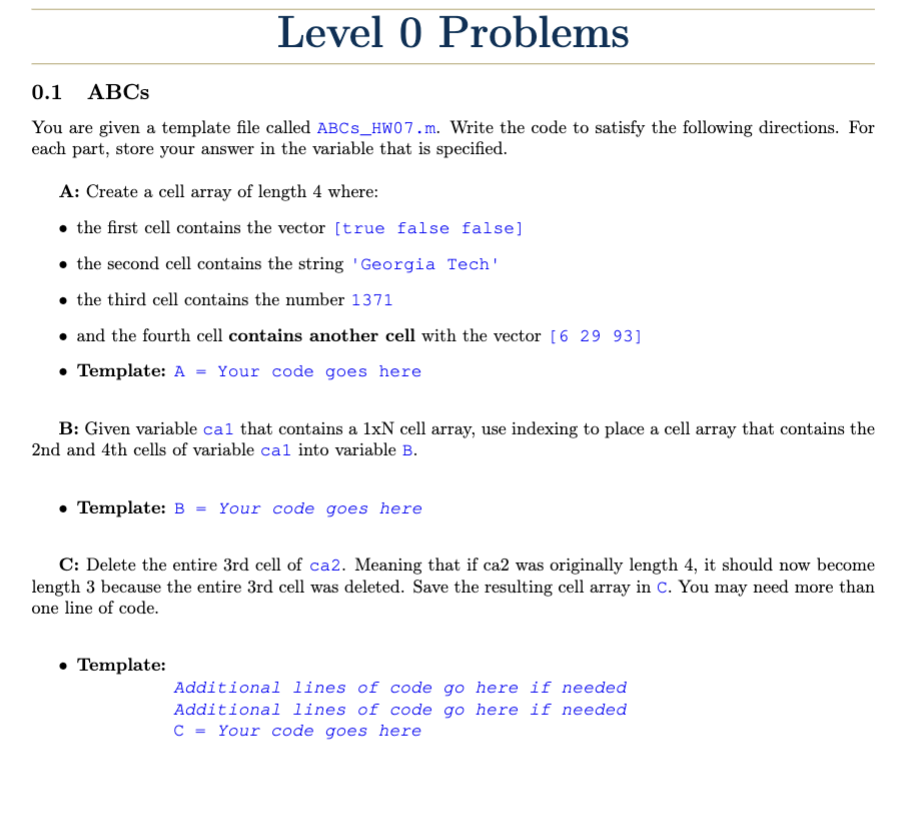
A = [{ [true false false], 'Georgia Tech', 1371, {[6 29 93]} }]
B = [{ca1{2}, ca1{4}}]
ca2(3) = []
C = [ca2]
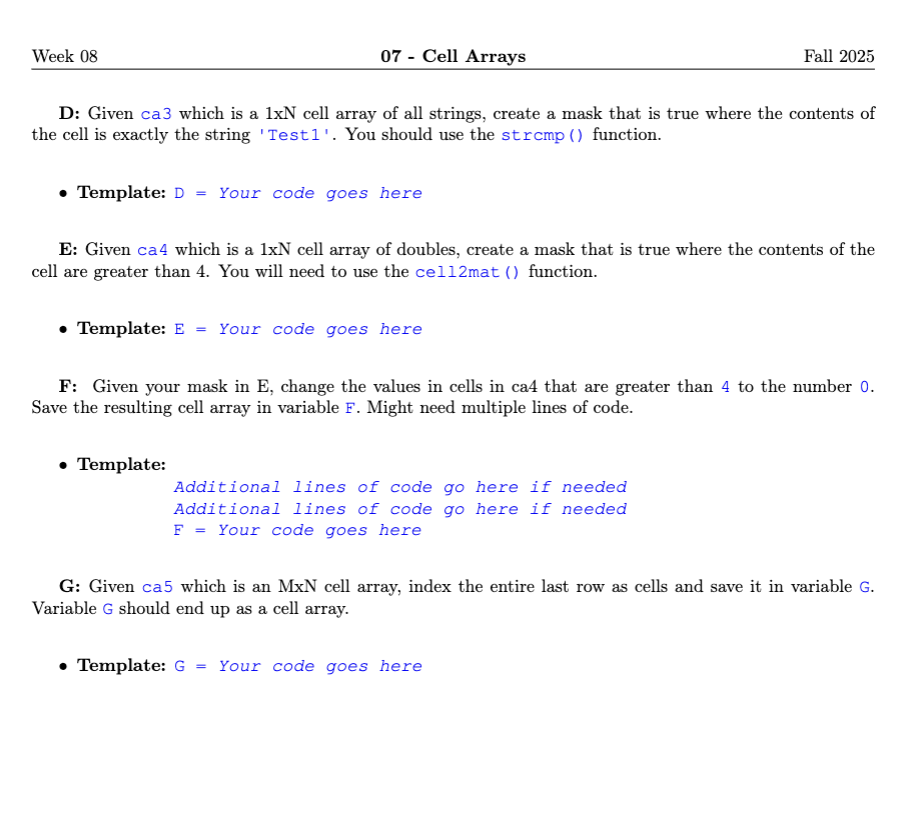
D = [strcmp(ca3, 'Test1')]
E = [cell2mat(ca4) > 4]
temp = cell2mat(ca4)
temp(E) = 0
F = [num2cell(temp)]
G = [ca5(end, :)]
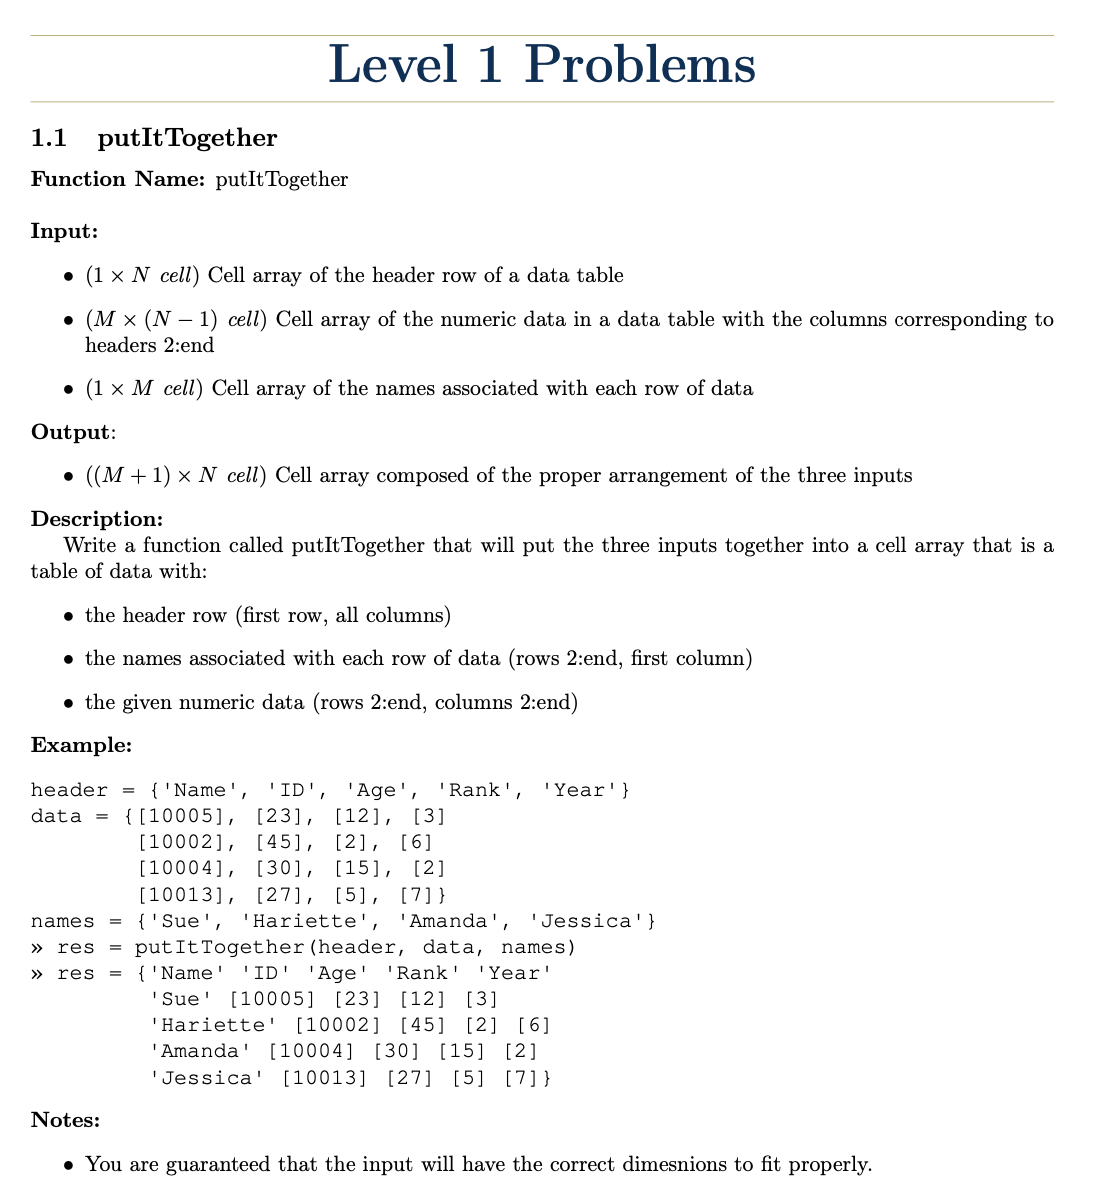
function res = putItTogether(header, data, names)
names = names(:);
res = [header; [names data]];
end
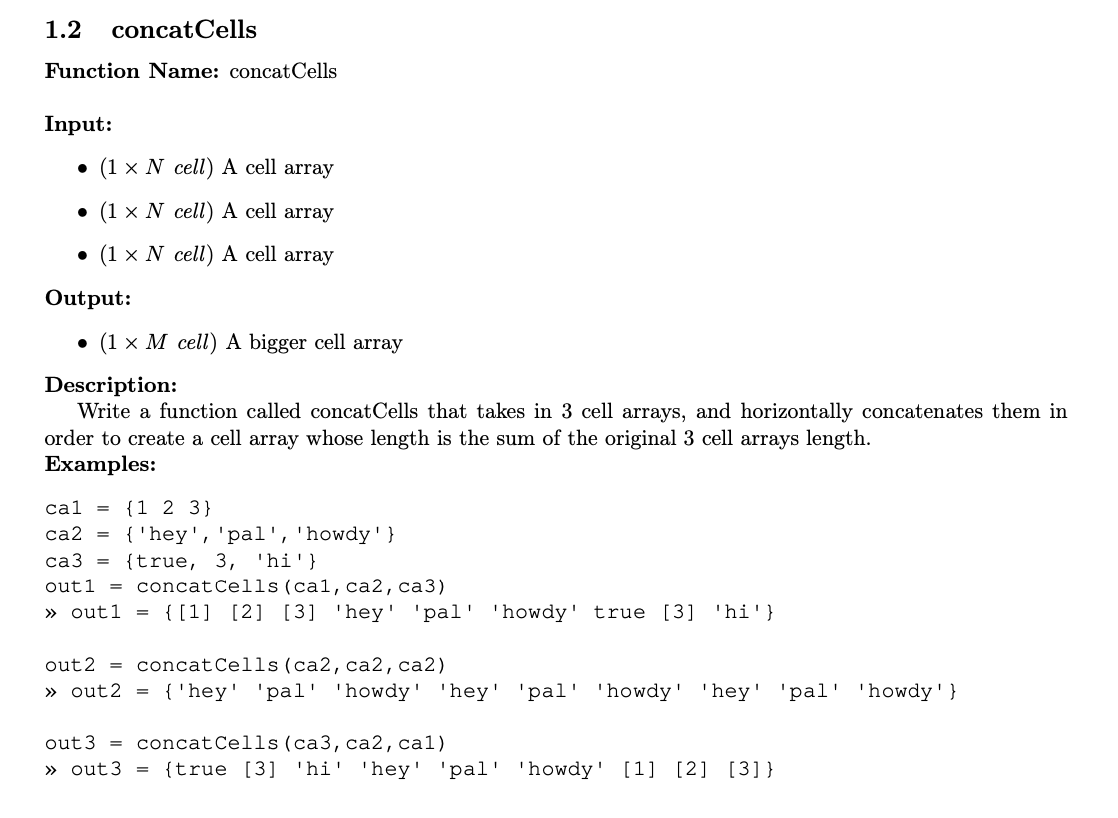
function out = concatCells(ca1, ca2, ca3)
out = [ca1 ca2 ca3];
end
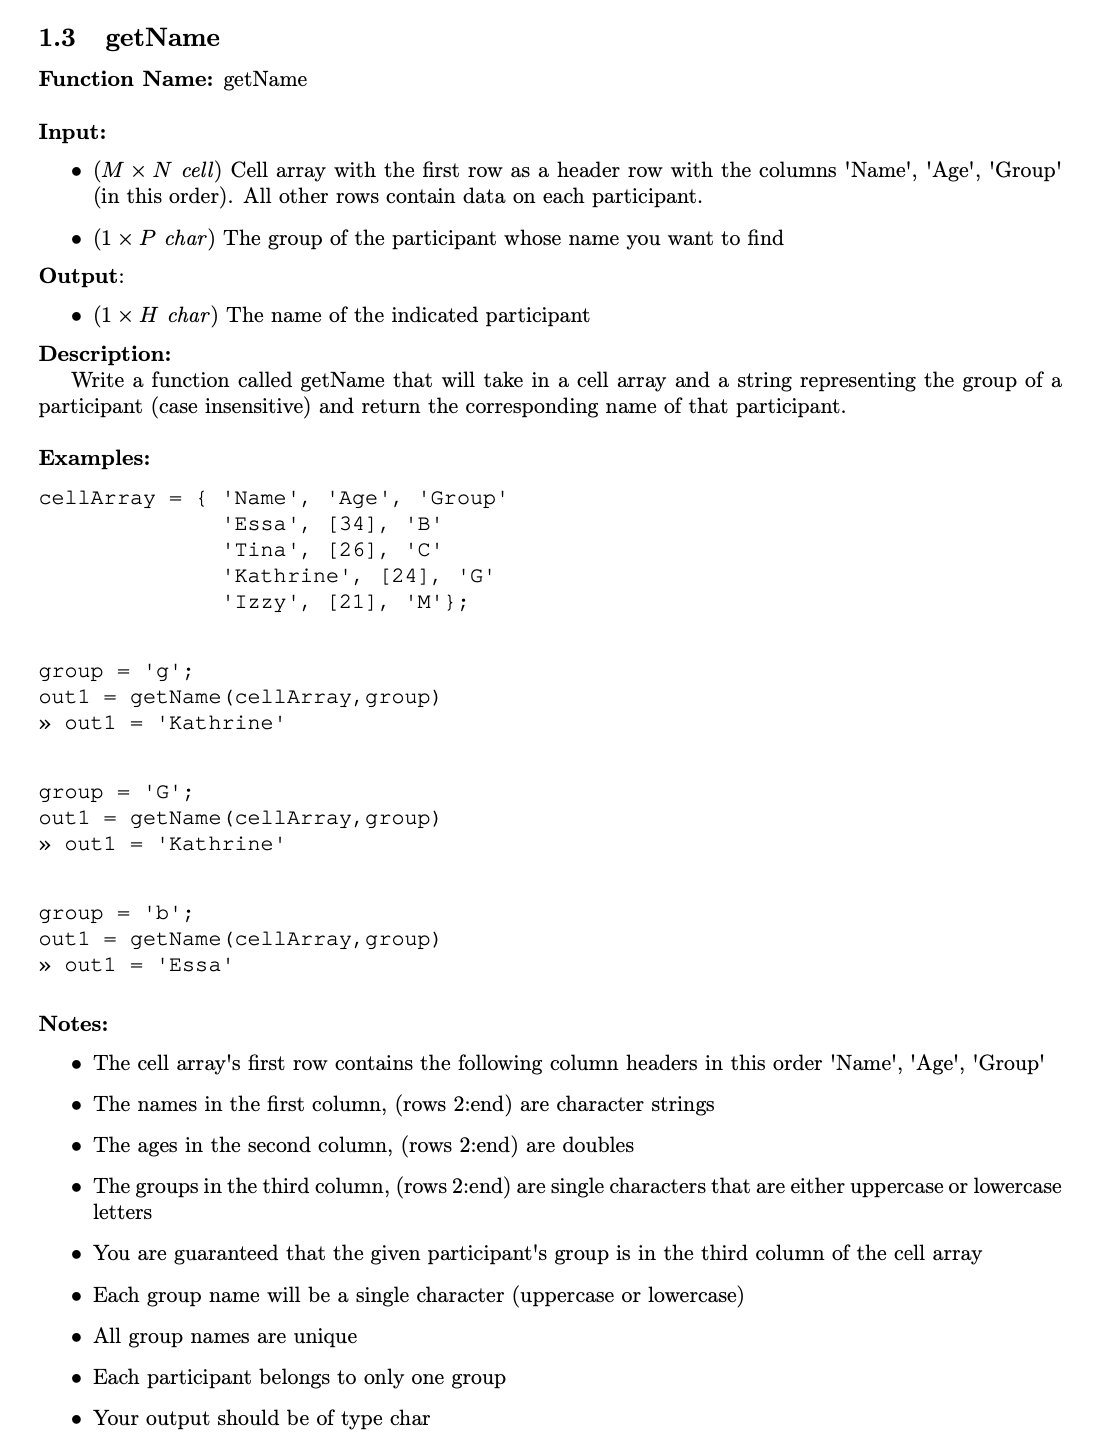
function name = getName(cellArray, group)
groups = cellArray(2:end, 3);
mask = strcmpi(groups, group);
names = cellArray(2:end, 1);
name = names{mask};
end
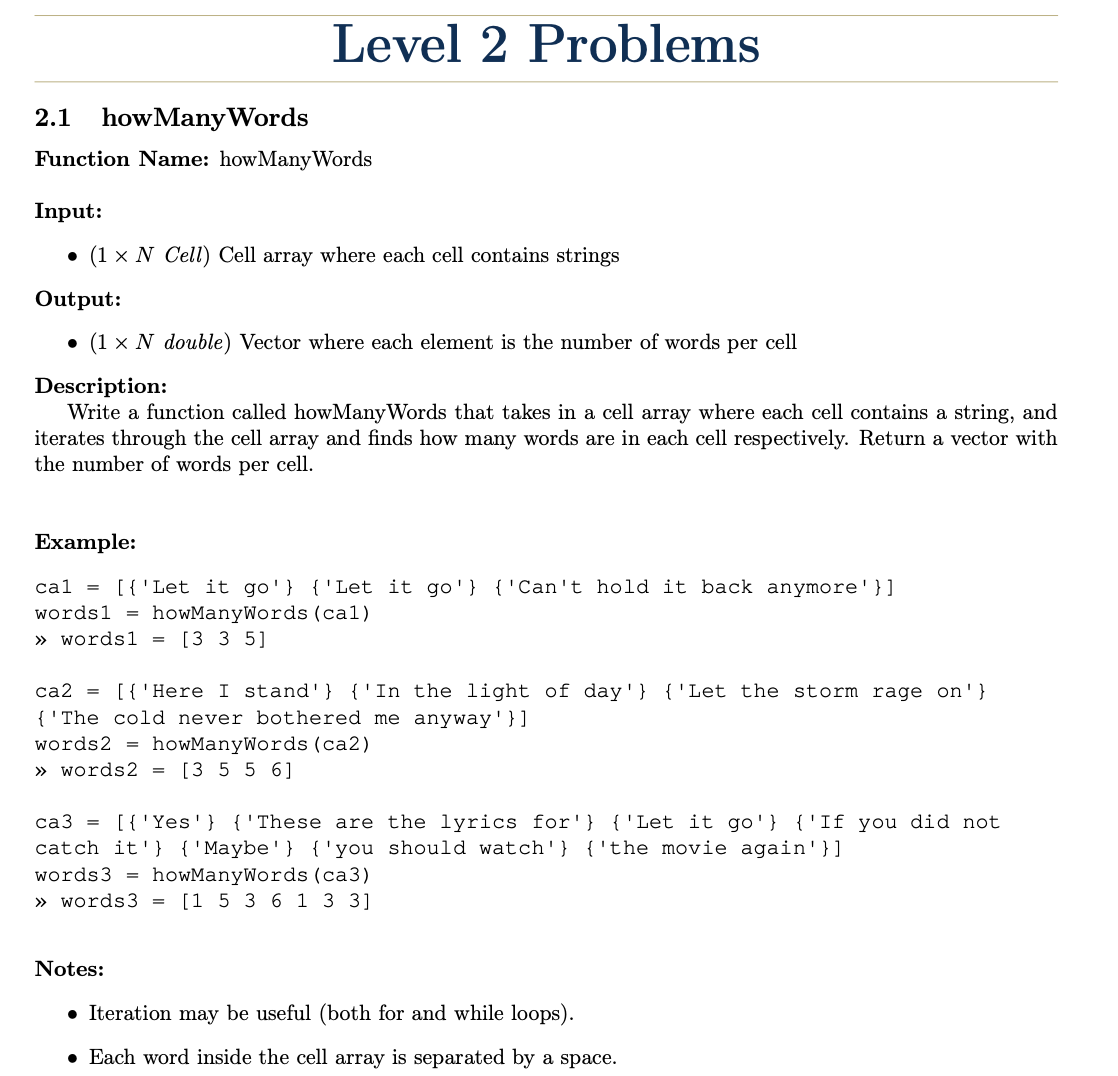
function words = howManyWords(ca)
n = length(ca);
words = zeros(1, n);
for i = 1:n
str = ca{i};
count = 0;
[token, rem] = strtok(str, ' ');
while ~isempty(token)
count = count + 1;
[token, rem] = strtok(rem, ' ');
end
words(i) = count;
end
end
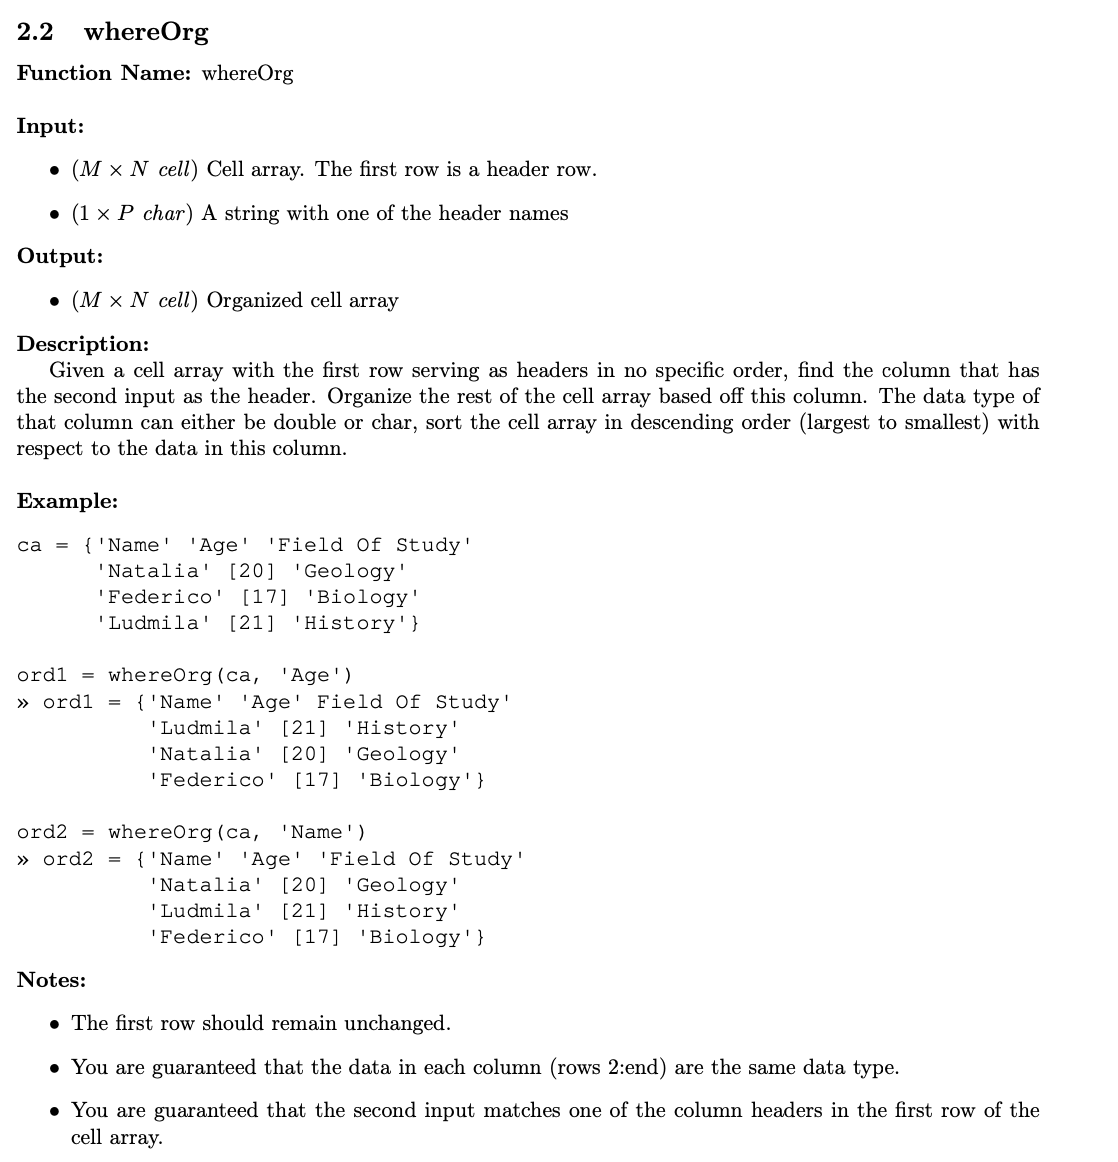
function org = whereOrg(ca, str)
header = ca(1,:);
data = ca(2:end,:);
mask = strcmp(header, str);
colData = data(:, mask);
if isnumeric(colData{1})
[~, ind] = sort(cell2mat(colData), 'descend');
else
[~, ind] = sort(colData);
ind = ind(end:-1:1);
end
data = data(ind,:);
org = [header; data];
end
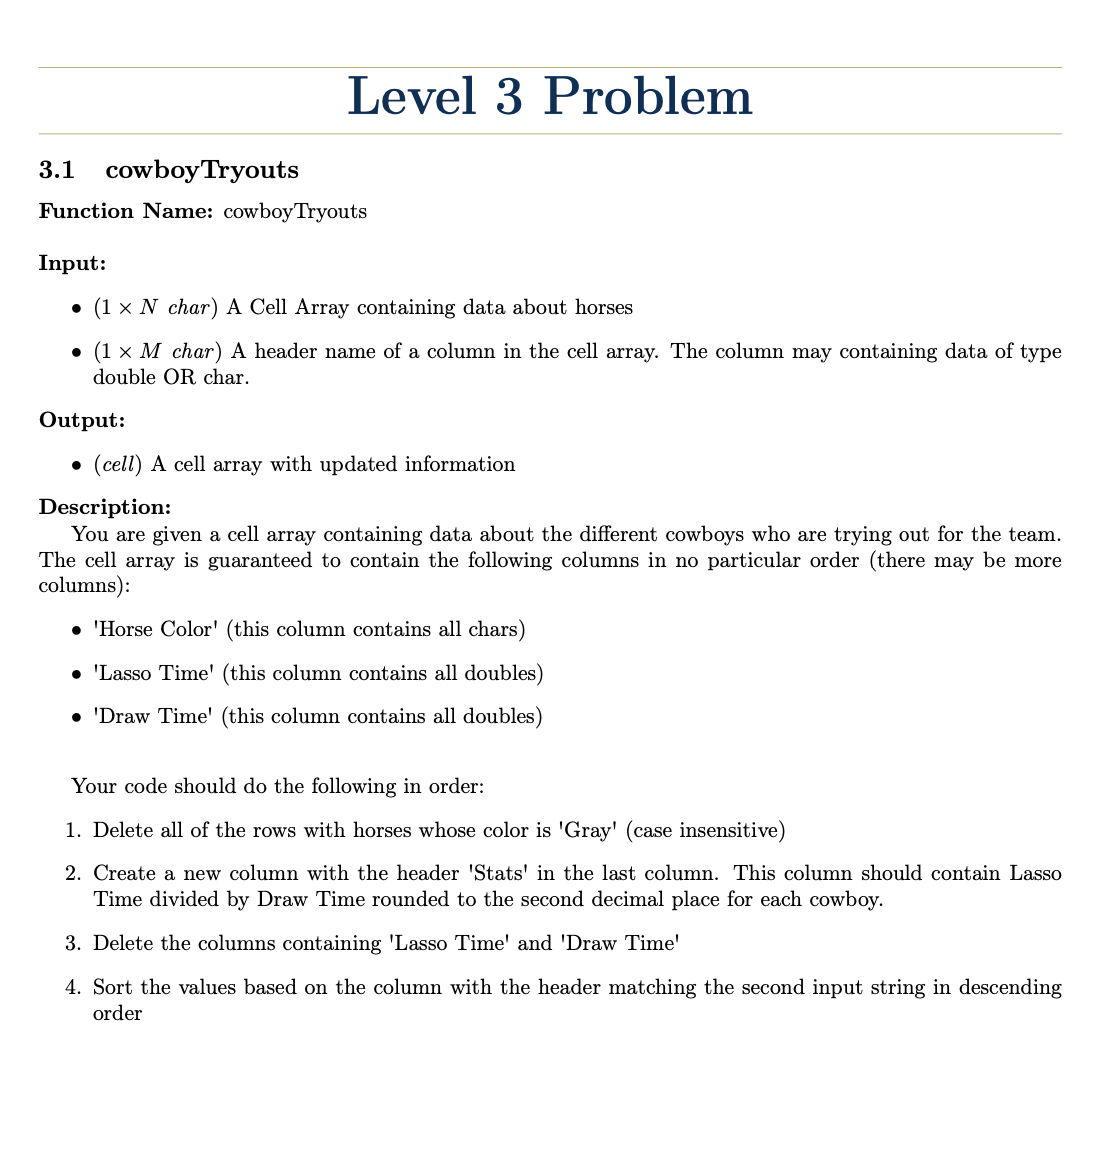
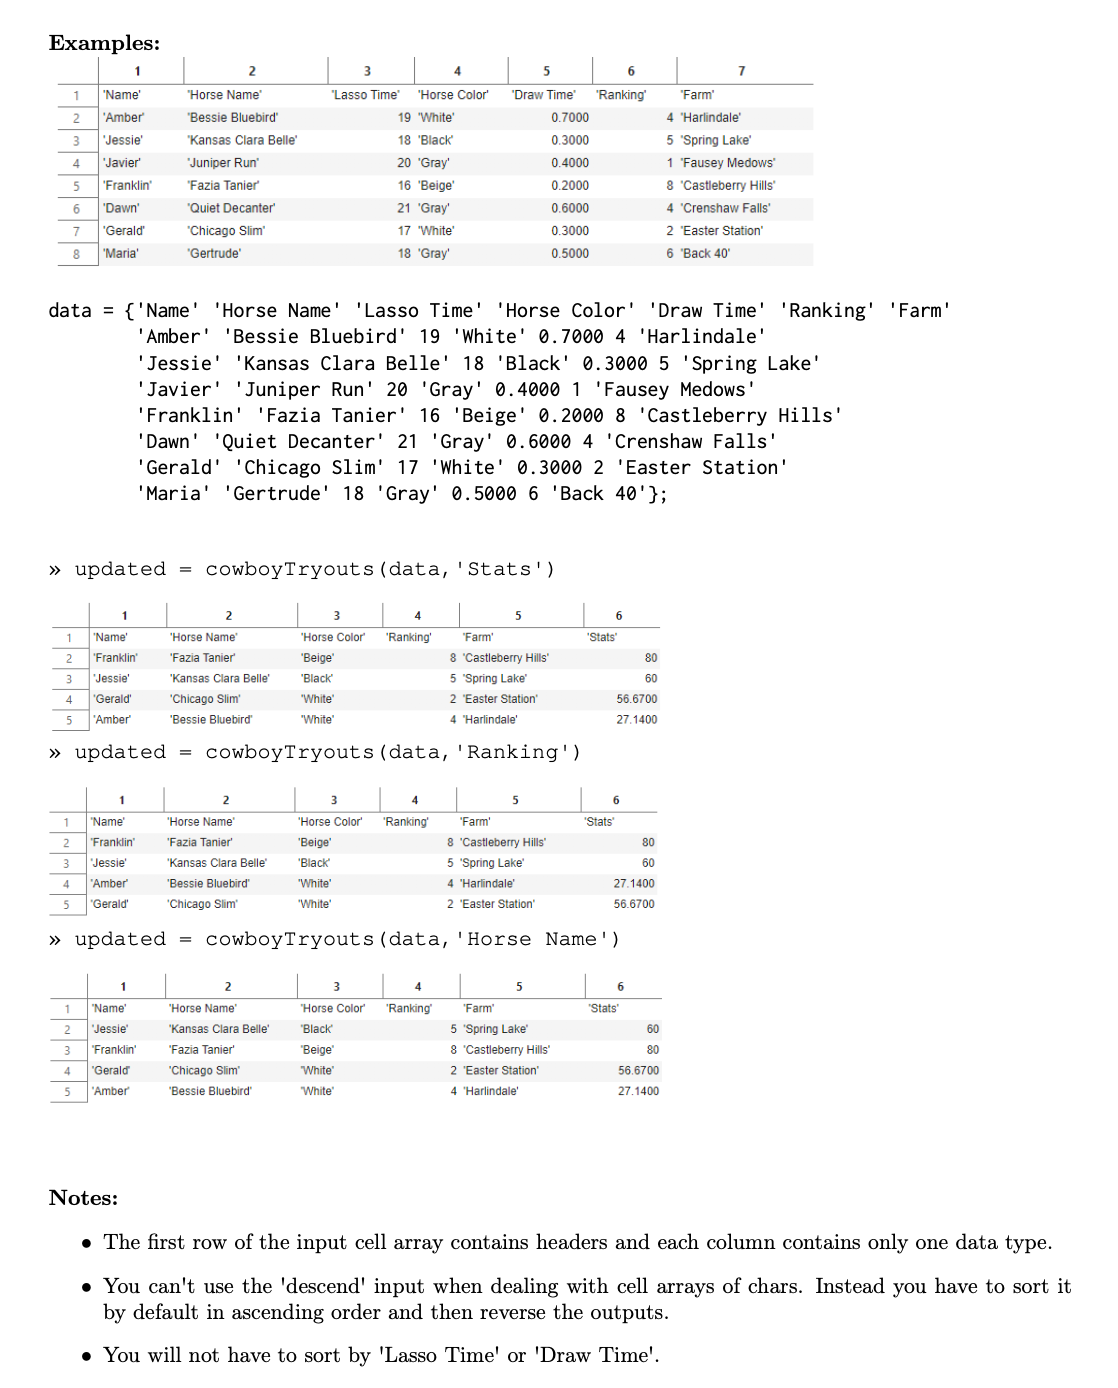
function out = cowboyTryouts(ca, sortBy)
header = ca(1,:);
data = ca(2:end,:);
colorMask = strcmpi(header, 'Horse Color');
colors = data(:, colorMask);
grayMask = strcmpi(colors, 'Gray');
data(grayMask,:) = [];
lassoMask = strcmpi(header, 'Lasso Time');
drawMask = strcmpi(header, 'Draw Time');
lassoVals = cell2mat(data(:, lassoMask));
drawVals = cell2mat(data(:, drawMask));
statsVals = round(lassoVals ./ drawVals, 2);
keepCols = ~(lassoMask | drawMask);
header = header(keepCols);
data = data(:, keepCols);
header = [header, {'Stats'}];
data = [data, num2cell(statsVals)];
sortMask = strcmpi(header, sortBy);
colData = data(:, sortMask);
if isnumeric(colData{1})
[~, ind] = sort(cell2mat(colData), 'descend');
else
[~, ind] = sort(colData);
ind = ind(end:-1:1);
end
data = data(ind,:);
out = [header; data];
end
%% Write your code in the blank space following each question.
% Assume the following variables are already defined: x1, y1, x2, y2, x3, y3, x4, y4.
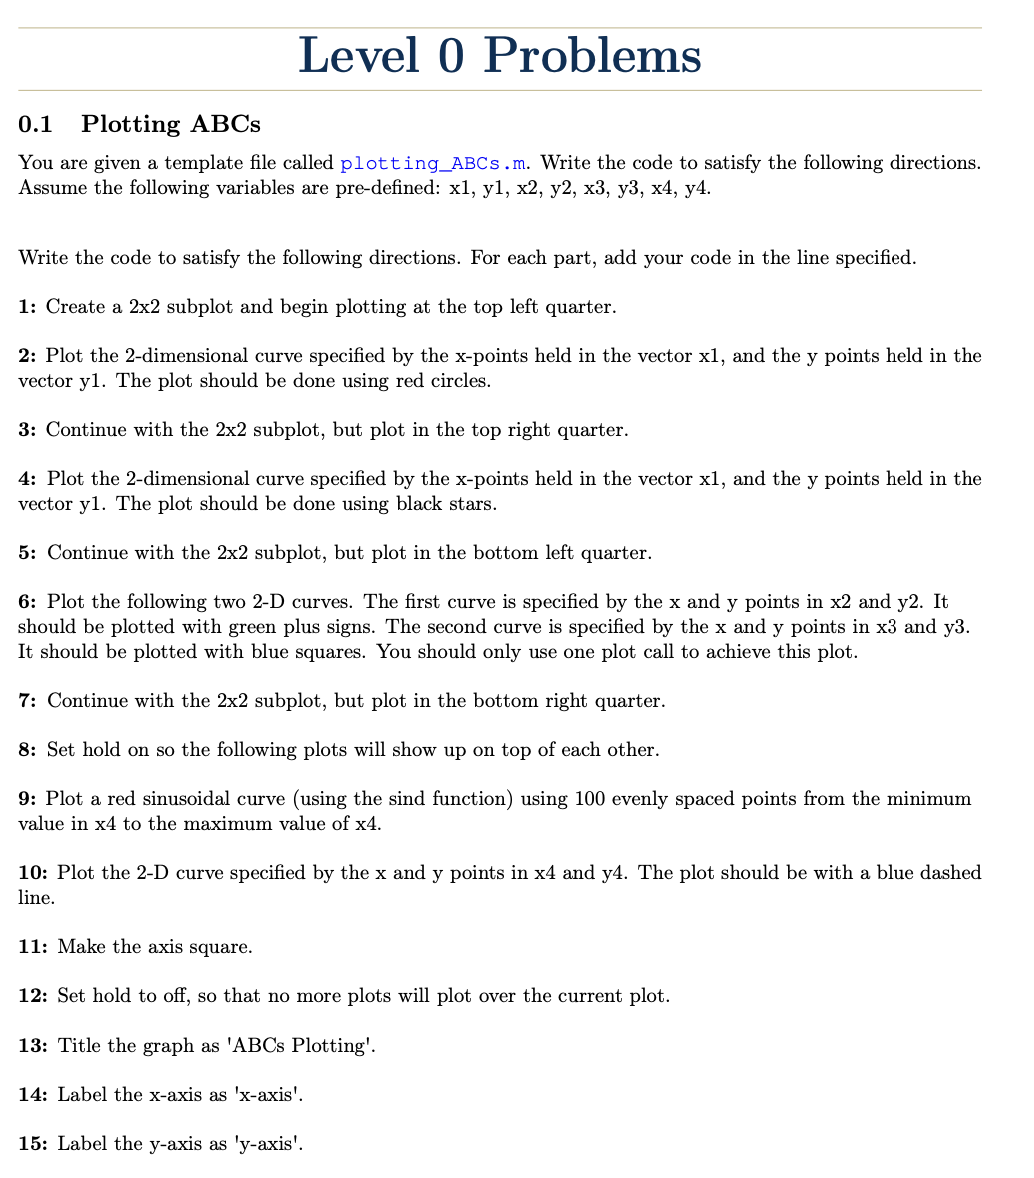
% 1. Create a 2x2 subplot and begin plotting at the top left quarter
subplot(2,2,1)
% 2. Plot the 2-dimensional curve specified by the x-points held in the
% vector x1, and the y points held in the vector y1. The plot should be
% done using red circles.
plot(x1, y1, 'ro')
% 3. Continue with the 2x2 subplot, but plot in the top right quarter.
subplot(2,2,2)
% 4. Plot the 2-dimensional curve specified by the x-points held in the
% vector x1, and the y points held in the vector y1. The plot should be
% done using black stars.
plot(x1, y1, 'k*')
% 5. Continue with the 2x2 subplot, but plot in the bottom left quarter.
subplot(2,2,3)
% 6. Plot the following two 2-D curves. The first curve is specified by the
% x and y points in x2 and y2. It should be plotted with green plus signs.
% The second curve is specified by the x and y points in x3 and y3. It
% should be plotted with blue squares. You should only use one plot call to
% achieve this plot.
plot(x2, y2, 'g+', x3, y3, 'bs')
% 7. Continue with the 2x2 subplot, but plot in the bottom right quarter.
subplot(2, 2, 4)
% 8. Set hold on so the following plots will show up on top of each
% other.
hold on
% 9. Plot a red sinusoidal curve (using the sind function) using 100 evenly
% spaced points from the minimum value in x4 to the maximum value of x4
x_sin = linspace(min(x4), max(x4), 100)
y_sin = sind(x_sin)
plot(x_sin, y_sin, 'r-')
% 10. Plot the 2-D curve specified by the x and y points in x4 and y4. The
% plot should be with a blue dashed line.
plot(x4, y4, 'b--')
% 11. Make the axis square.
axis square
% 12. Set hold to off, so that no more plots will plot over the current plot.
hold off
% 13. Title the graph as 'ABCs Plotting'. Exactly.
title('ABCs Plotting')
% 14. Label the x-axis as 'x-axis'. Exactly.
xlabel('x-axis')
% 15. Label the y-axis as 'y-axis'. Exactly.
ylabel('y-axis')
subplot(2,2,1)
plot(x1, y1, 'ro')
subplot(2,2,2)
plot(x1, y1, 'k*')
subplot(2,2,3)
plot(x2, y2, 'g+', x3, y3, 'bs')
subplot(2, 2, 4)
hold on
x_sin = linspace(min(x4), max(x4), 100)
y_sin = sind(x_sin)
plot(x_sin, y_sin, 'r-')
plot(x4, y4, 'b--')
axis square
hold off
title('ABCs Plotting')
xlabel('x-axis')
ylabel('y-axis')
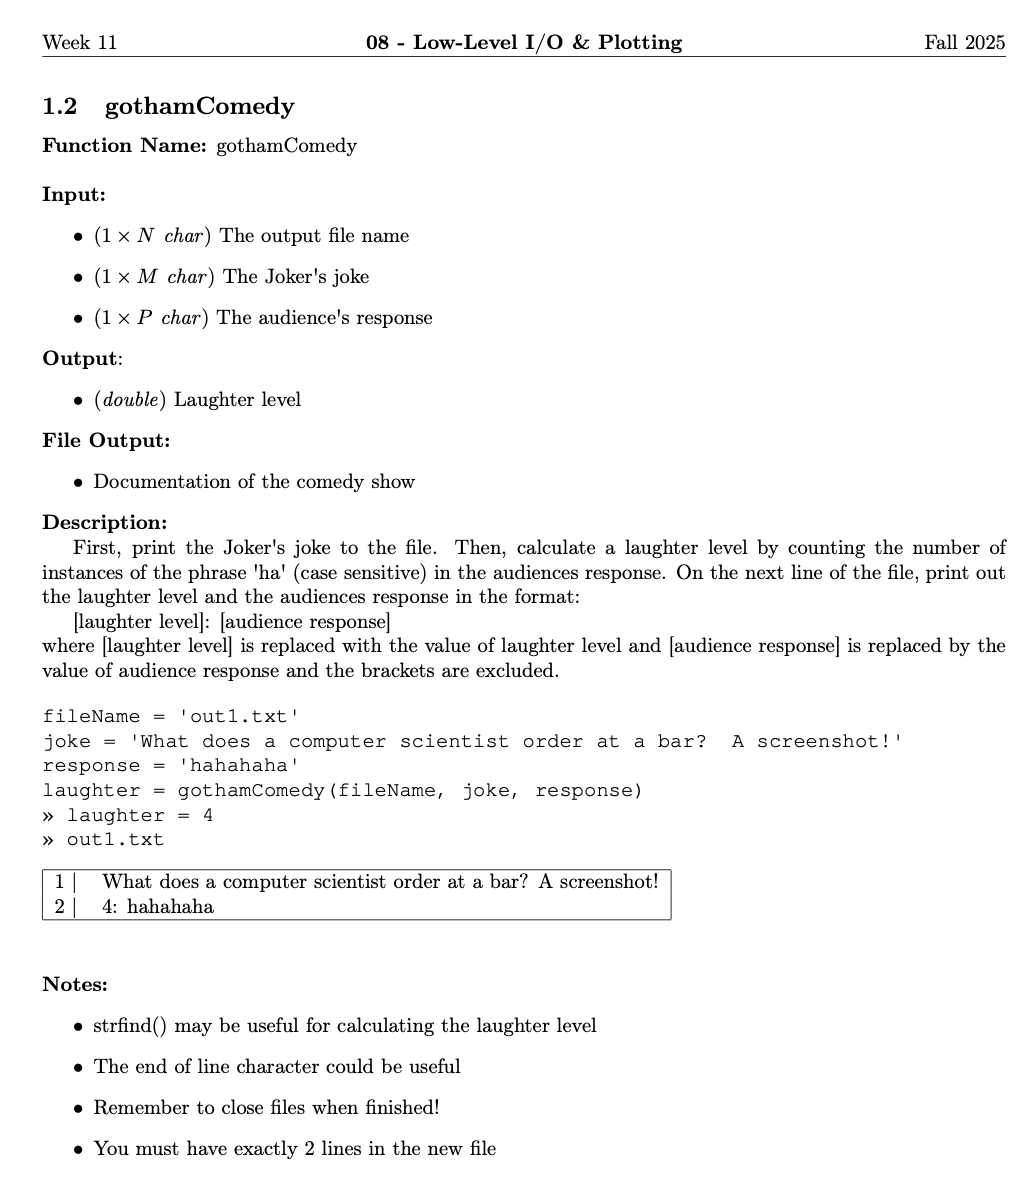
function laughter = gothamComedy(fileName, joke, response)
laughter = length(strfind(response, 'ha'));
fId = fopen(fileName, 'w');
fprintf(fId, '%s\n', joke);
fprintf(fId, '%d: %s', laughter, response);
fclose(fId);
end
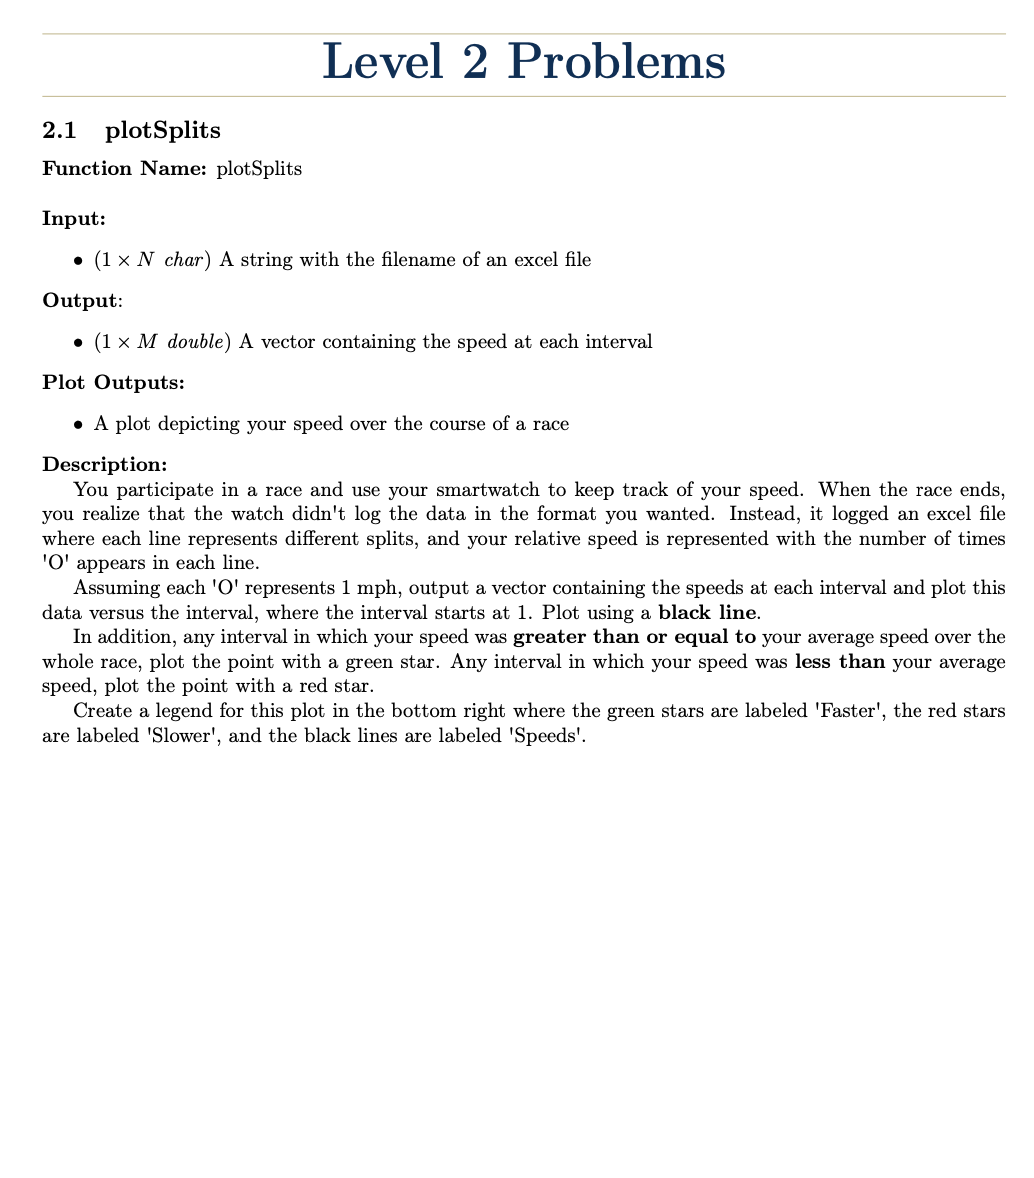
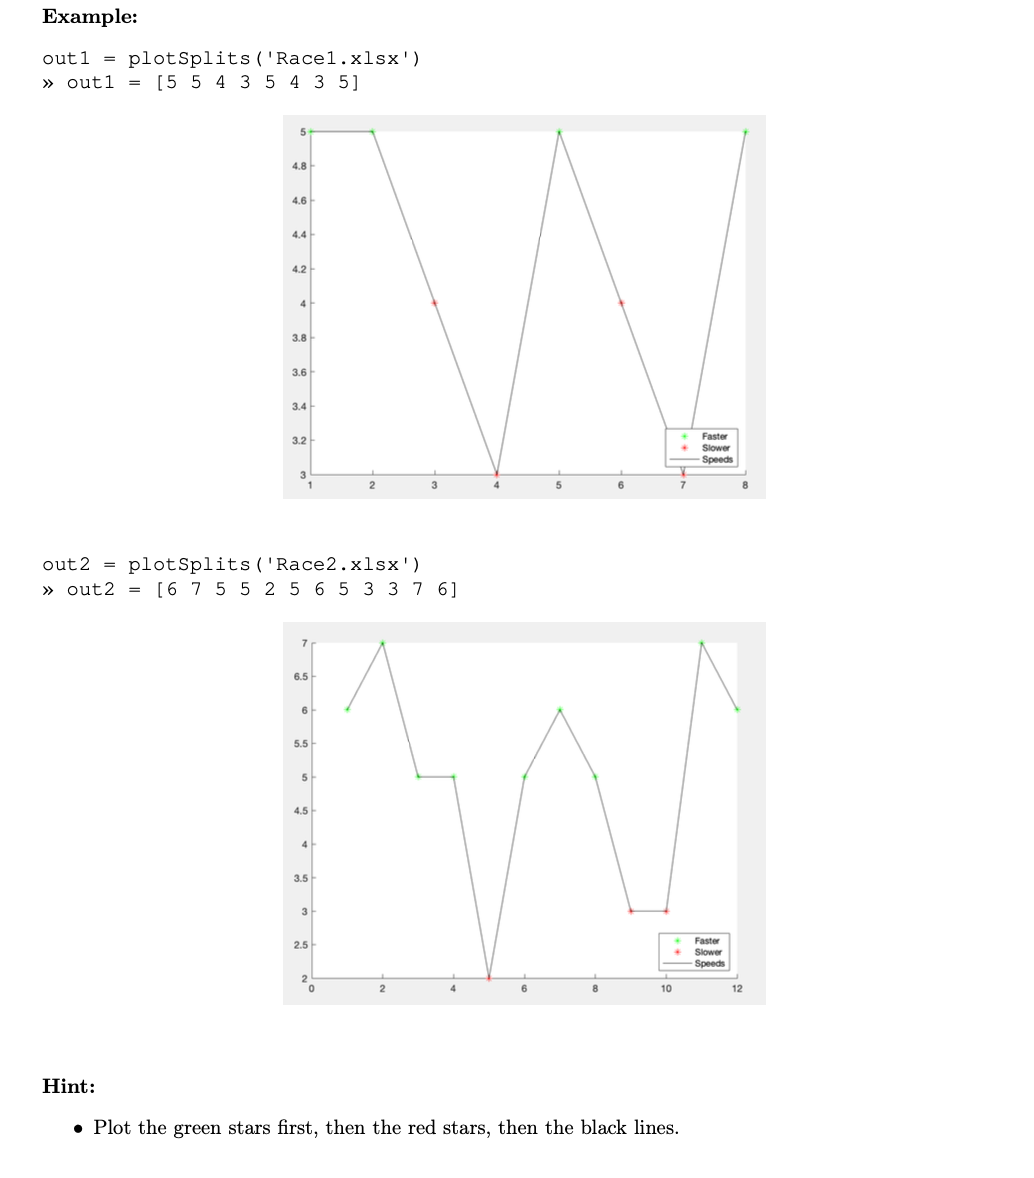
function speeds = plotSplits(fileName)
data = readcell(fileName);
[r, c] = size(data);
speeds = zeros(1, r);
for i = 1:r
line = '';
for j = 1:c
if ischar(data{i,j})
line = [line data{i,j}];
end
end
countO = 0;
for k = 1:length(line)
if line(k) == 'O'
countO = countO + 1;
end
end
speeds(i) = countO;
end
avg = sum(speeds) / length(speeds);
x = 1:length(speeds);
plot(x, speeds, 'k-', 'LineWidth', 1.5)
hold on
for i = 1:length(speeds)
if speeds(i) >= avg
plot(x(i), speeds(i), 'g*', 'MarkerSize', 8)
else
plot(x(i), speeds(i), 'r*', 'MarkerSize', 8)
end
end
legend('Speeds', 'Faster', 'Slower', 'Location', 'southoutside')
hold off
end
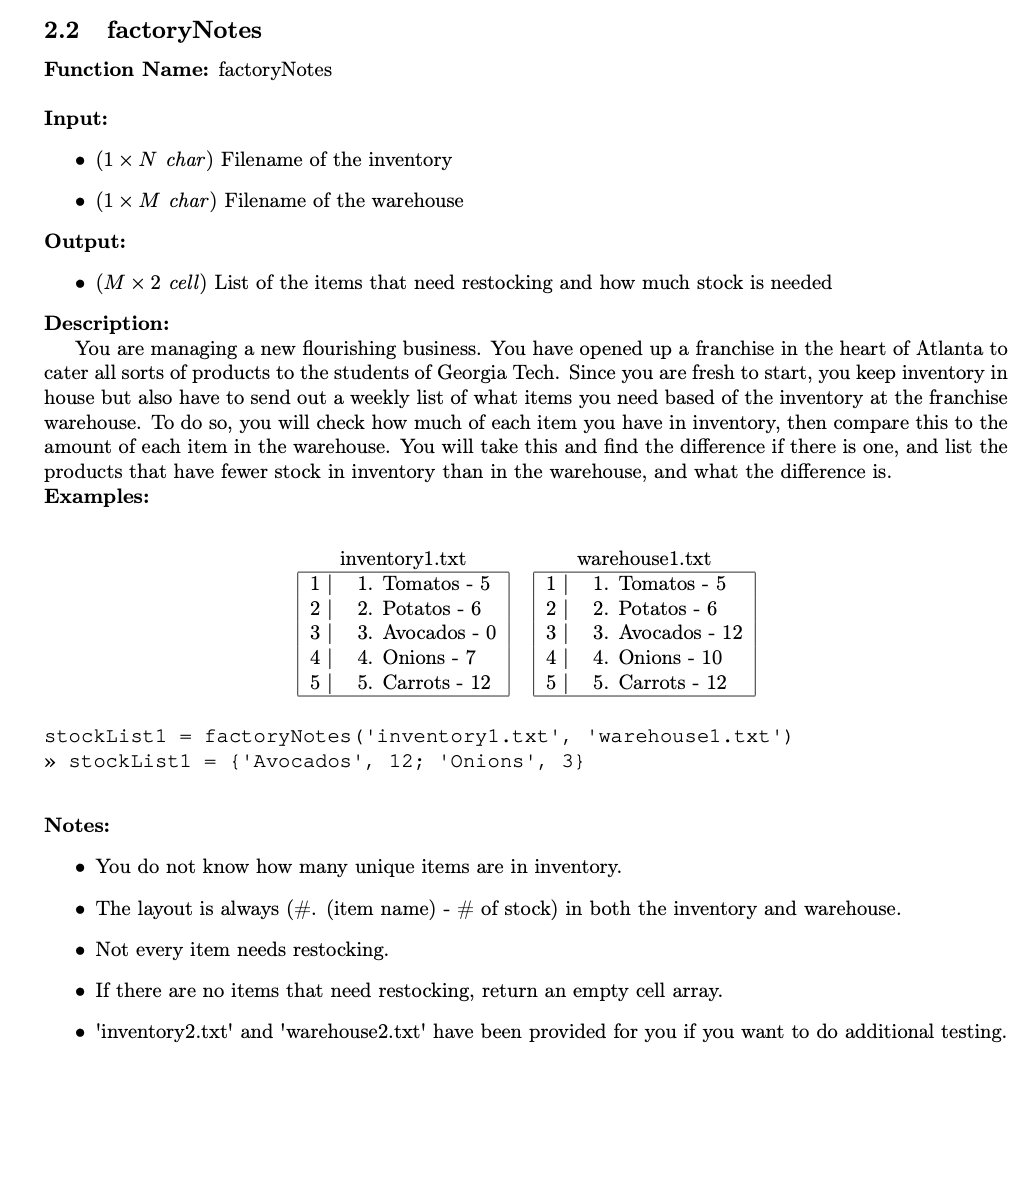
function stockList = factoryNotes(invFile, wareFile)
invData = readcell(invFile, 'Delimiter', '\n');
wareData = readcell(wareFile, 'Delimiter', '\n');
stockList = {};
for i = 1:length(invData)
invLine = invData{i};
wareLine = wareData{i};
dashIdxInv = strfind(invLine, '-');
dashIdxWare = strfind(wareLine, '-');
dotIdx = strfind(invLine, '.');
invItem = invLine(dotIdx+2:dashIdxInv-2);
invNumStr = invLine(dashIdxInv+2:end);
wareNumStr = wareLine(dashIdxWare+2:end);
invNum = 0;
for j = 1:length(invNumStr)
ch = invNumStr(j);
if ch >= '0' && ch <= '9'
invNum = invNum * 10 + (double(ch) - 48);
end
end
wareNum = 0;
for j = 1:length(wareNumStr)
ch = wareNumStr(j);
if ch >= '0' && ch <= '9'
wareNum = wareNum * 10 + (double(ch) - 48);
end
end
if invNum < wareNum
diff = wareNum - invNum;
stockList = [stockList; {invItem, diff}];
end
end
end
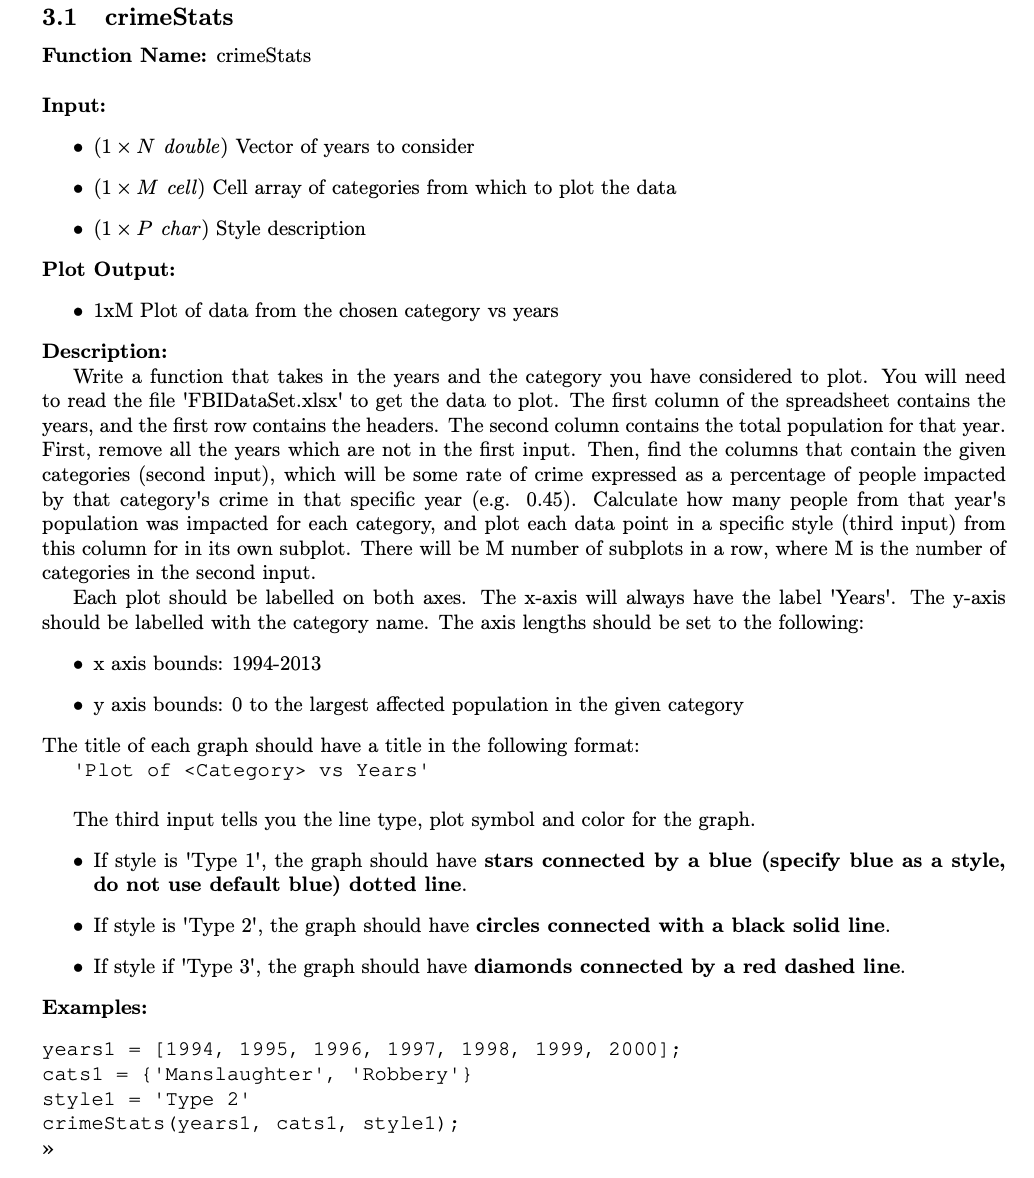
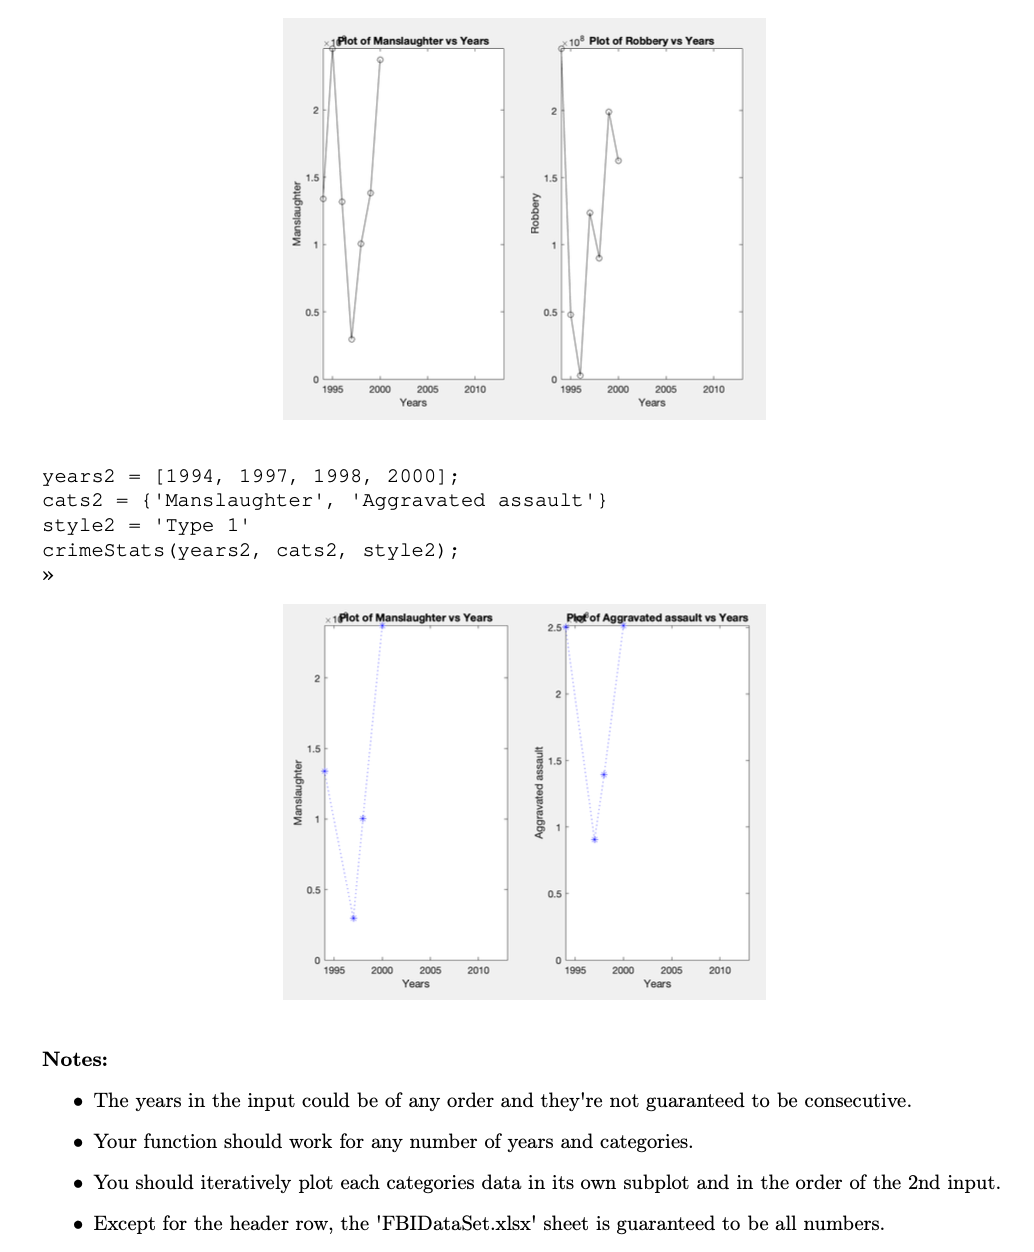
function crimeStats(years, cats, style)
data = readcell('FBIDataSet.xlsx');
headers = data(1,:);
data(1,:) = [];
yearsCol = cell2mat(data(:,1));
popCol = cell2mat(data(:,2));
idxYears = zeros(length(years),1);
for i = 1:length(years)
match = (yearsCol == years(i));
temp = (1:length(yearsCol)) .* match';
idxYears(i) = sum(temp);
end
idxYears = idxYears(idxYears ~= 0);
subData = data(idxYears,:);
pop = popCol(idxYears);
m = length(cats);
for i = 1:m
target = cats{i};
colNum = 0;
for j = 1:length(headers)
h = headers{j};
if length(h) == length(target)
if all(double(lower(h)) == double(lower(target)))
colNum = j;
end
end
end
catVals = cell2mat(subData(:,colNum));
affected = catVals .* pop;
if length(style) length('Type 1') && all(double(style) double('Type 1'))
plot(years, affected, 'b:*')
elseif length(style) length('Type 2') && all(double(style) double('Type 2'))
plot(years, affected, 'k-o')
else
plot(years, affected, 'r--d')
end
xlabel('Years')
ylabel(target)
title(['Plot of ' target ' vs Years'])
axis([1994 2013 0 max(affected)])
end
end