AP Human Geography: Key Concepts in Location, Maps, and Data Collection
1/62
There's no tags or description
Looks like no tags are added yet.
Name | Mastery | Learn | Test | Matching | Spaced | Call with Kai |
|---|
No analytics yet
Send a link to your students to track their progress
63 Terms
Location
Where something is on Earth.
Place
Physical & human characteristics (climate, culture, etc.).
Region
Areas grouped by common traits.
Movement
How people, goods, and ideas move.
Human-Environment Interaction
How humans adapt to and change the environment.
Latitude
Horizontal lines, north to south
Longitude
Vertical lines, east to west
Absolute Location
Exact coordinates.
Relative Location
Where something is compared to other places.
Site
Physical features of a place.
Situation
Location relative to surroundings.
Map
A 2D representation of Earth's surface.
Atlas
A collection of maps.
Thematic Maps
Show specific data (climate, population, etc.).
GIS (Geographic Information System)
Digital layers of geographic data.
GPS (Global Positioning System)
Satellites provide location.
Remote Sensing
Satellites collecting Earth data.
Online Mapping
Maps on the internet (Google Maps).
Fieldwork
Collecting data on-site.
U.S. Census
Population/economic data collection.
Aerial Photography
Plane/satellite images.
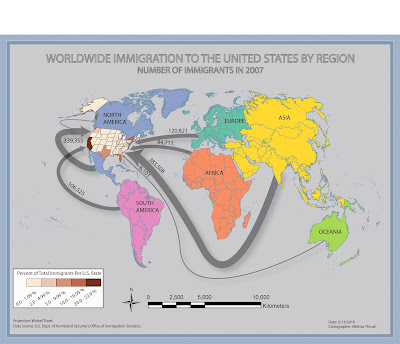
Flow Line Map
Uses lines of varying width and arrows to show quantity of movement of people or goods between various locations
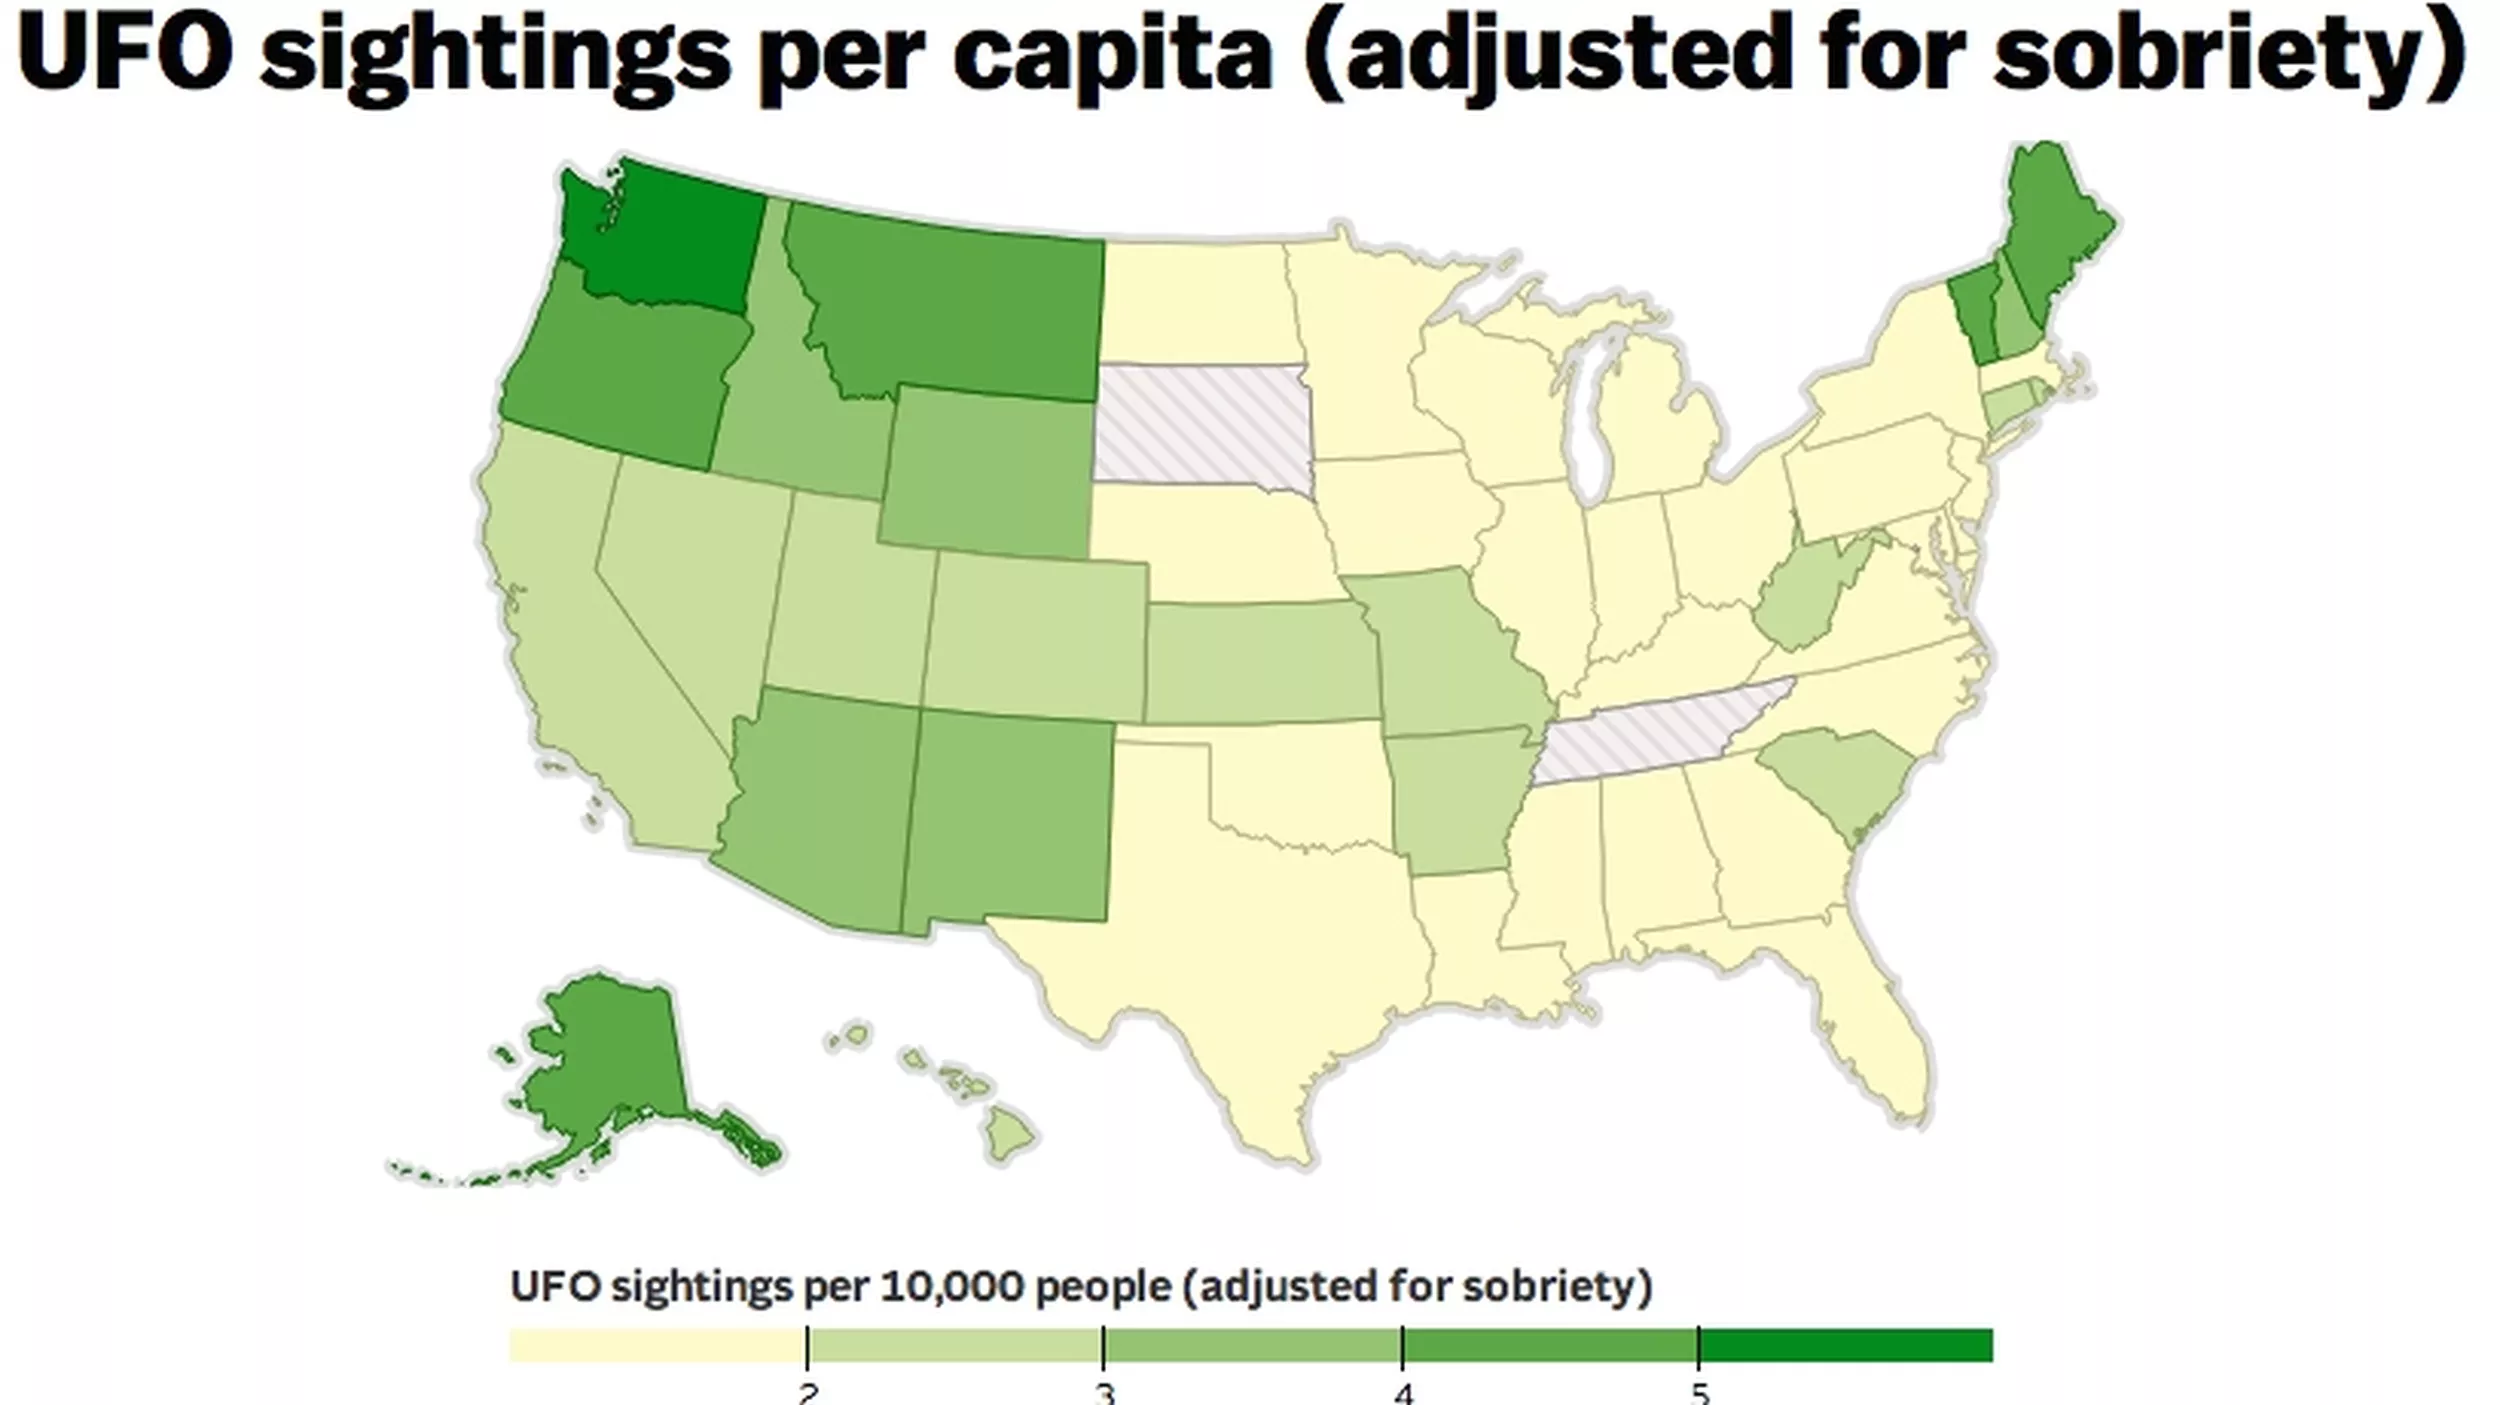
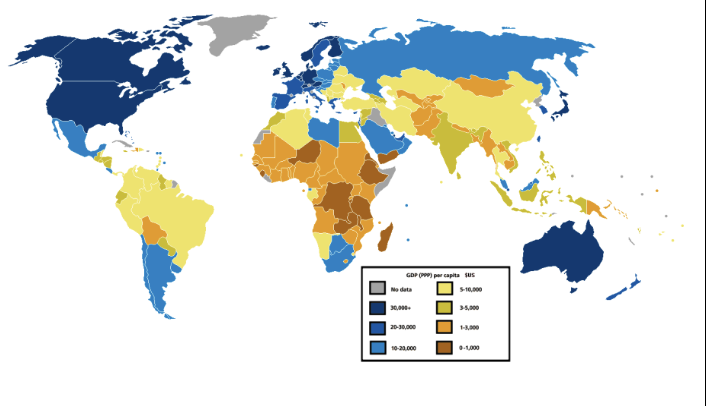
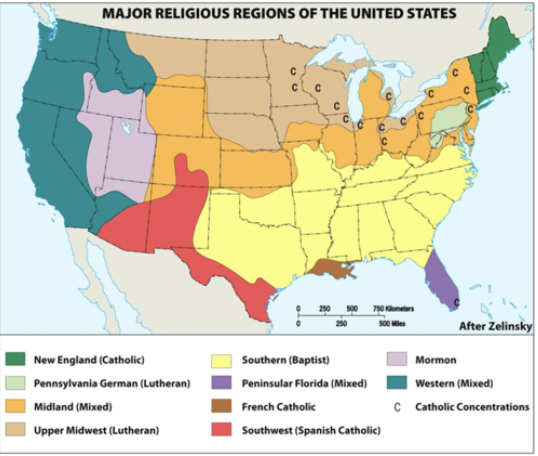
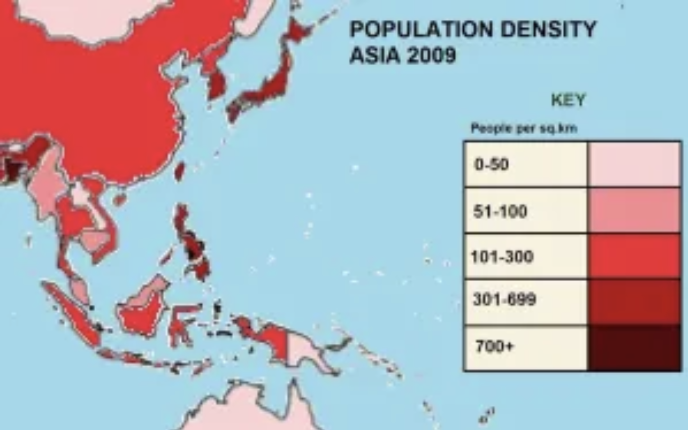
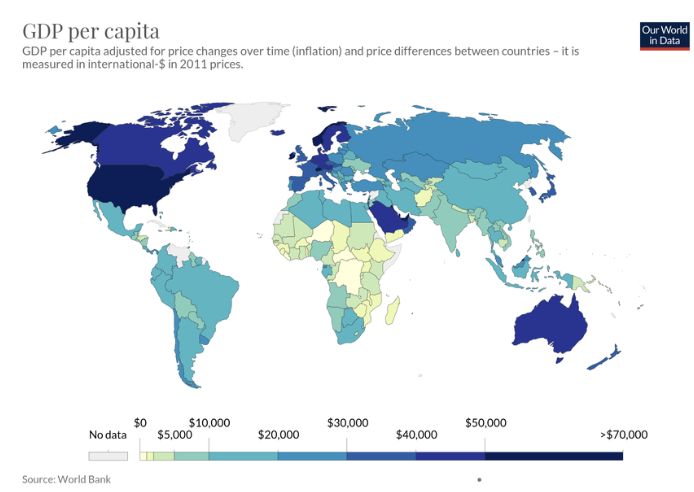
Choropleth Map
Putting features into classes and using intensity in shading to communicate information.
Proportional Symbol Map
Using a symbol the size of which it corresponds to the magnitude of the mapped feature
Isoline Map
using continuous lines to show the boundary of a particular value
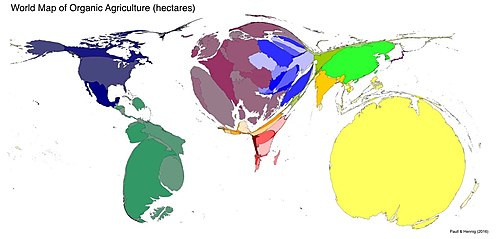
Catogram Map
Adjusting the size of the country so it corresponds to the magnitude of the mapped feature
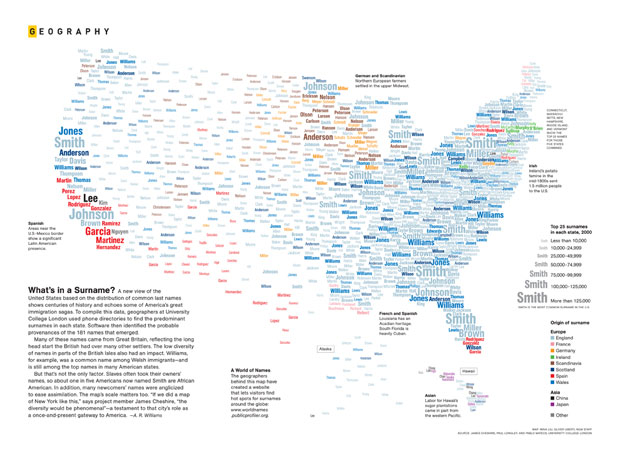
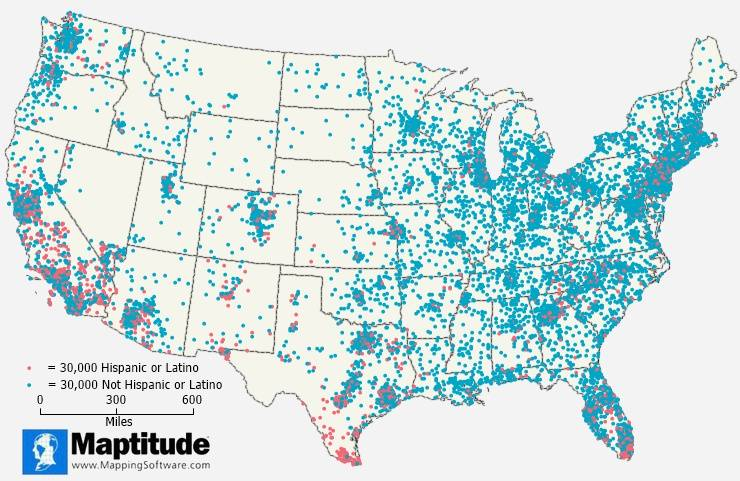
Dot Map
using dots in which each dot represents some frequency
Which map represents a flow line map?
Which map represents a Choropleth map?
Which map represents a proportional symbol?
Which map represents a isoline map?

Which map represents a catogram map?
Which map represents a dot map?
Large scale map
less area would be shown in greater detail (think “zoom in”)
Small Scale Map
more area would be shown in less detail (think “zoom out”)
Which map represents a global scale?
Which map represents a national scale?
Which map represents a regional scale?
Which map represents a sub-national scale?
Which map represents a local scale?
Which map represents a global scale of analysis?
Which map represents a regional scale of analysis?
Which map represents a national scale of analysis?
Which map represents a local scale of analysis?
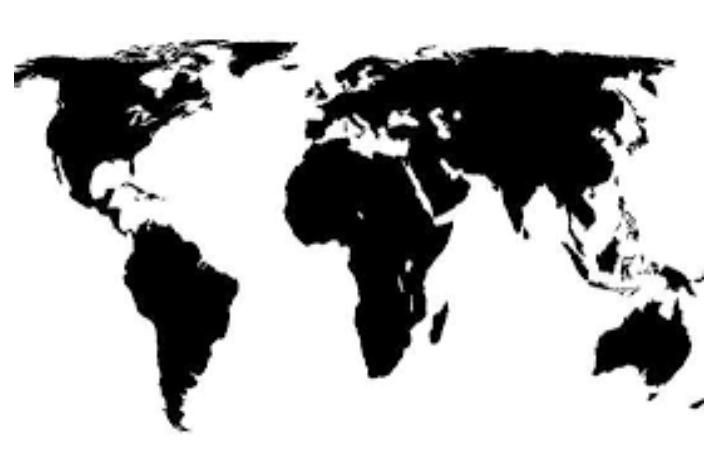
What does a global scale of analysis show?
the world at one level of data, no boundary lines on map
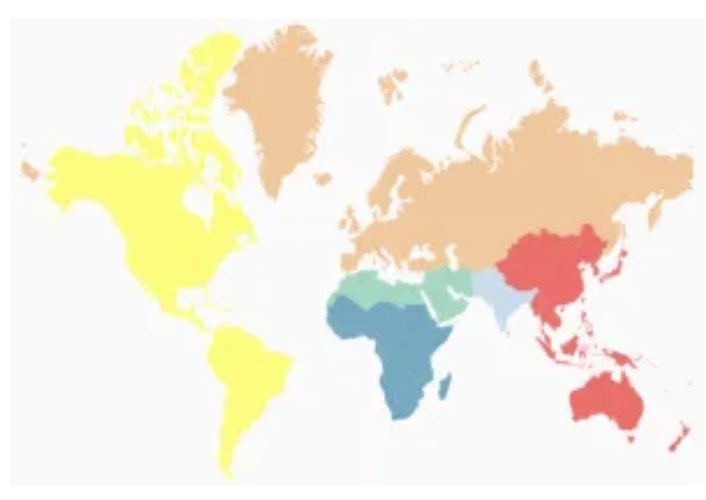
What does a regional scale of analysis show?
shows data by continents or world regions.
What does a national scale of analysis show?
National scale of analysis shows data for one or more countries
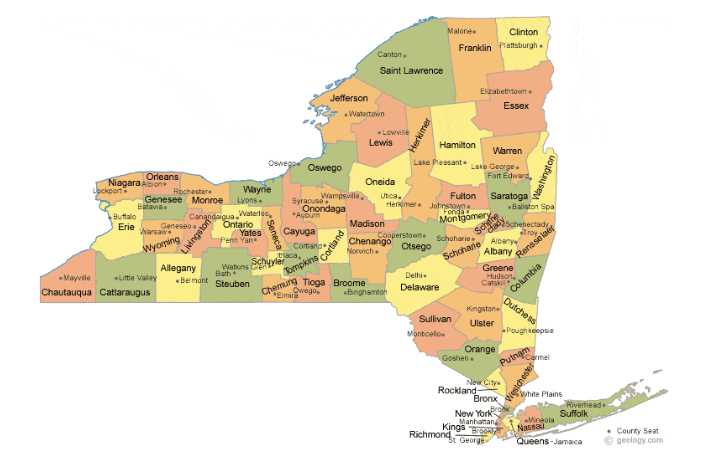
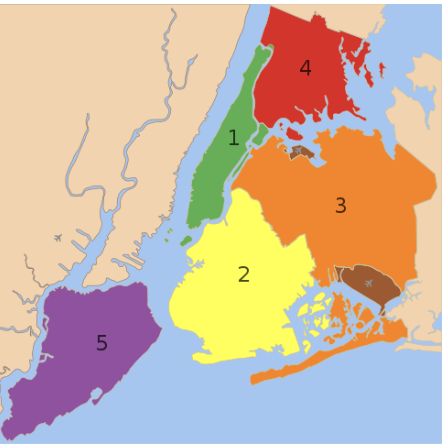
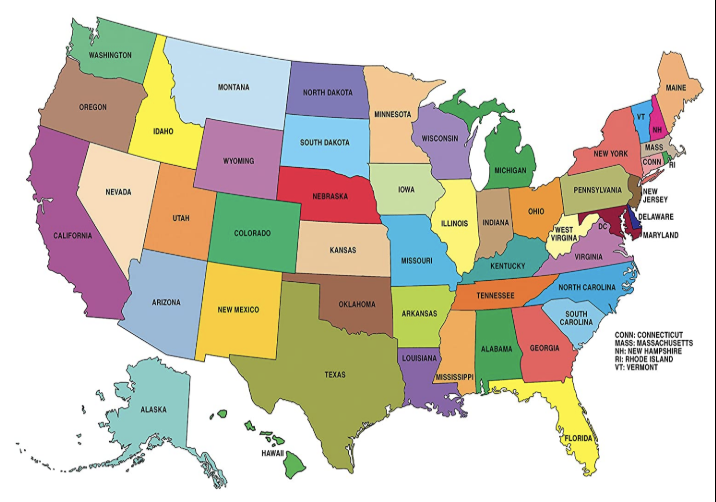
What does a local scale of analysis show?
shows data at a subnational level, states or counties
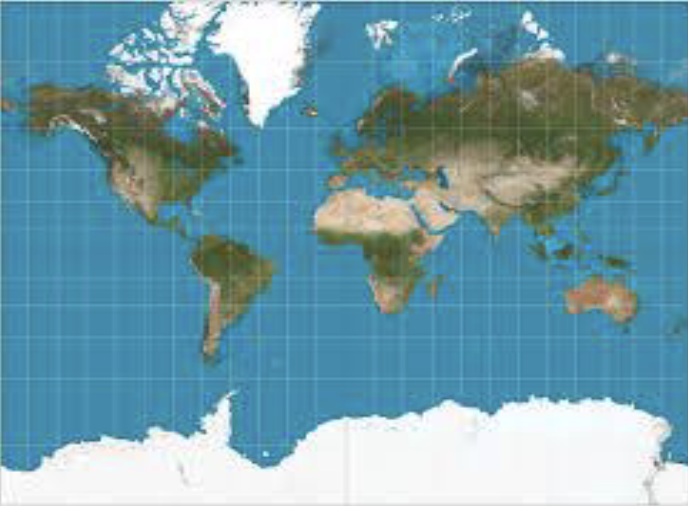
What does the Mercator projection show and distort?
lines of latitude and longitude run perpendicular and the size of land masses is distorted
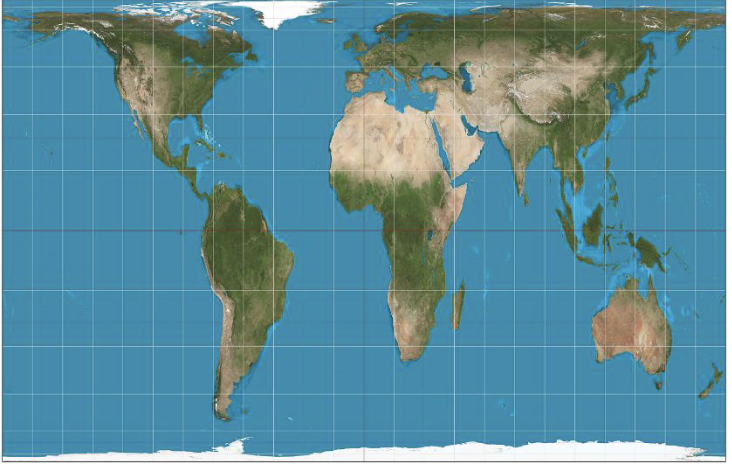
What does the Gall-Peters Projection show and distort?
Correctly represents the size of land masses , but
it distorts their shape
What does the McArthur's Upside Down Map show and distort?
Challenges the traditional North up orientation of
our maps
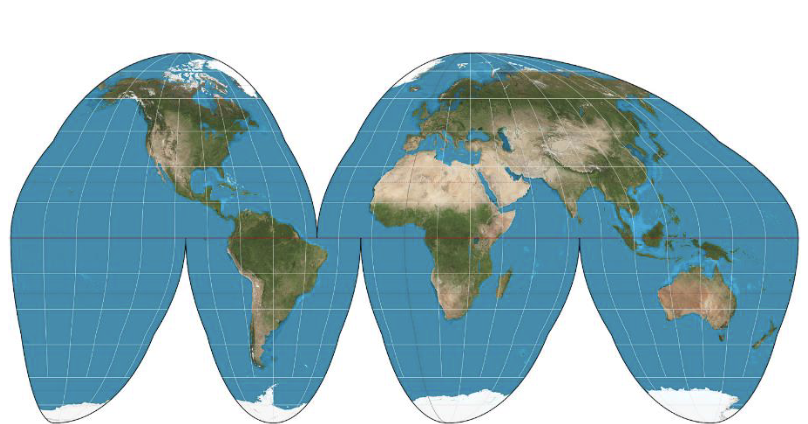
What does the Goode Homolosine Equal Area Projection Show?
Preserves the size and shape of landmasses
distance between land masses is distorted
What another name for the Goode Homolosine Equal Area Projection?
The interupted Map
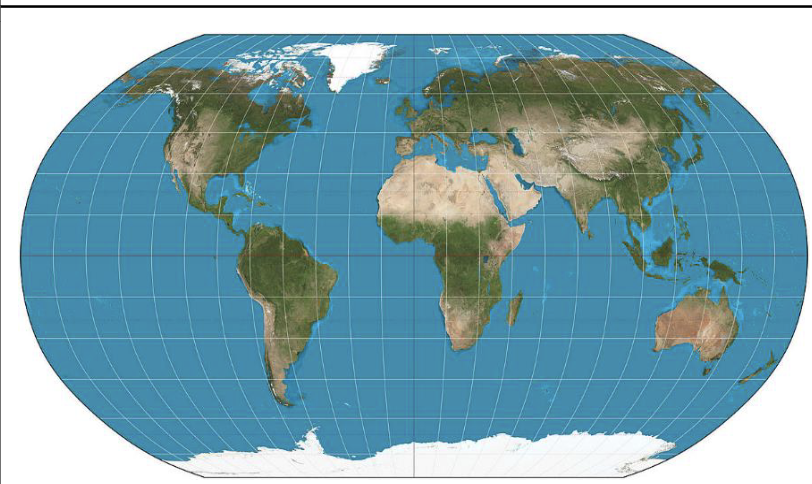
What does the Robinson Projection show and distort?
Good general purpose map that slightly
distorts the features of the globe
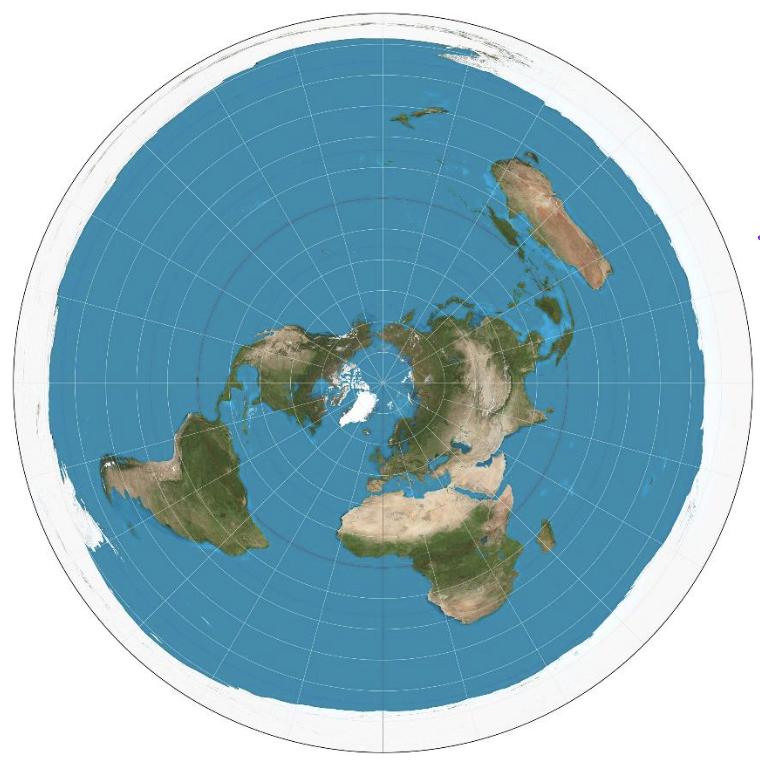
What does the Azimuthal / Polar Projection show and distort?
Map is oriented around a single point, shape
is distorted farthest from the center
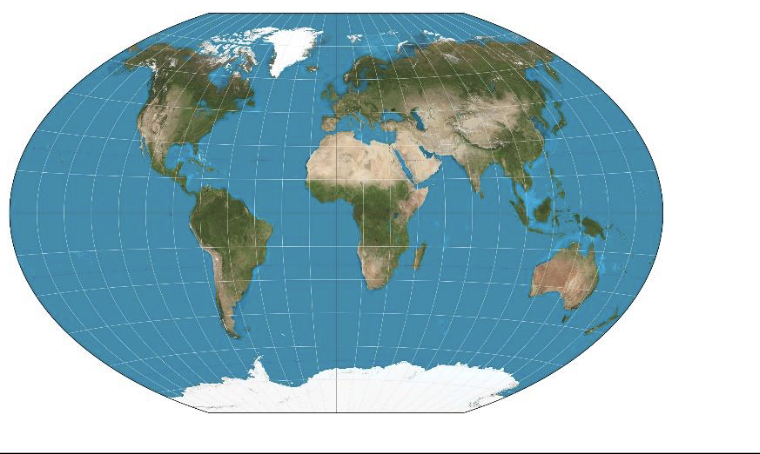
What does the Winkle Tripel Projection show?
General purpose map that very slightly distorts
the features of the globe
The four common characteristics of the globe that maps can distort
size, shape, direction, distance
Which map represents the Mercator Projection Map?
Which map represents the Gall-Peters Projection?
Which map represents the Goode Homolisine Equal Area Projection
Which map represents the Robinson Projection Map?
Which map represents the Azimuthal / Polar Projection Map?
Which map represents the winkle tripel projection map?