automated cell counters - WBC
1/50
There's no tags or description
Looks like no tags are added yet.
Name | Mastery | Learn | Test | Matching | Spaced |
|---|
No study sessions yet.
51 Terms
CBC
white blood cell count
red blood cell count
hemoglobin
hematocrit
red cell indices
WBC differential
platelet count and size - 150-450,000/uL
cells differ in quantity, size, and refractory qualities
WBC 3.6-10.6 x10³/L
WBCs contain cellular inclusions
RBC 4.0-6.0 x10⁶/L
Hemoglobin is contained in the red cells
Platelets 150-450 x103/L
Hemoglobin g/dl
Current technology
Electrical impedance
radiofrequency
optical scatter (flow cytometry)
WBC differential
3 part - lymphocytes, granulocytes, mononuclear cells
5 part - neutrophils, lymphocytes, monocytes, eosinophils, and basophils
6 part, 5 part + immature granulocytes
impedance counting
Impedance counting (Coulter Principle)
Cells are suspended in an isotonic diluent
An electric current is introduced
Dilution is passed through a small aperture
Cells are nonconductive and cause an electronic
pulse interruption as they pass through
Number of pulses created equals the number of
cells passing through the electrode system
The amplitude of the pulse is proportional to the
size of the cell (MCV)
electrical impedance
first introduced by Wallace Coulter
blood cells are poor conductor of electricity
2 chambers filled with a conductive buffered electrolyte solution
separated by a small aperture
DC current between two electrodes
counting chambers
most common chambers using impedance
RBC/platelet chamber
WBC chamber/hemoglobin
differential chamber
reticulocyte channel
RBC/platelet chamber
2-20 femtoliters (fL) - platelet
36-330 fL - RBC
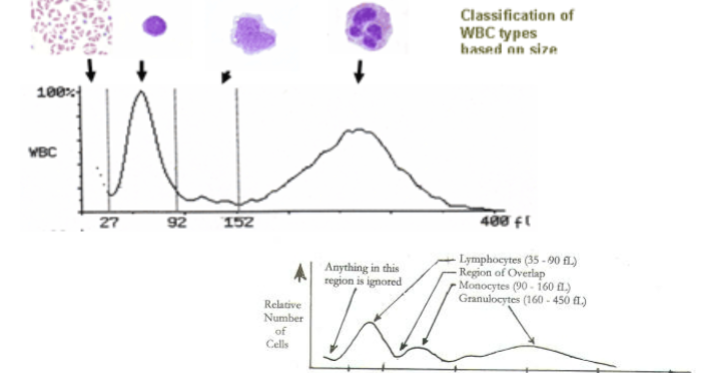
typical WBC impedance histogram
bimodal RBC histogram peaks, reticulocytosis, RDW
bimodal peak can be seen in situations such as -
reticulocytosis
colg agglutinins (cold antibodies IgM)
post-transfusion
post-treatment of IDA
laser based flow cytometry
due to patent of impedance method competitors developed laser light scatter technology
initially very limited test offerings
eventually surpassed impedance counting
flow cytometry method
measures cells or particles as they move through a sensing area
sensing may be optical or electronic
optical sensing is done with an intense light source, usually a laser
Tungsten-halogen lamp or a helium neon laser
emitting light with a narrow wavelength spectrum
instrument measures light scatter and or fluorescent signals generated as cells pass through a light beam
flow cytometry components
Five main components
Flow Cell Fluidics (cell transport system)
Liquid sheath fluid, carries and aligns the cells so that they
pass single file through the light beam for sensing
Laser Optical System
Most common mercury, xenon
High-power water-cooled lasers (argon, krypton, dye laser);
Low-power air-cooled lasers (argon (488nm), red-HeNe
(633nm), green-HeNe, HeCd (UV));
Diode lasers (blue, green, red, violet) resulting in light signals
Photodetectors for signal detection
Converts light energy into electrical energy
Generates FSC and SSC signals from light into electrical
signals
An Amplification System
Microprocessor /Computer data management system
process flow cytometry
Fluidics are regulated by pressure
Cells suspended in fluid are transported to a
special flow chamber
Chamber has small orifice at tip
Sample is injected into a stream of fast-
moving cell-free liquid (sheath fluid)
Hydrodynamically-focused stream of fluid
Sheath fluid and cell suspension move at
different rates and do not intermingle
Laminar Flow generates a single file alignment of
cells
A single wavelength of light is directed onto a
hydrodynamically-focused stream of fluid
A number of detectors are aimed at the point
where the stream passes through the light
beam:
One in line with the light beam (Forward Scatter or
FSC)
And several perpendicular to it (Side Scatter
(SSC)
Possibly one or more fluorescent detectors
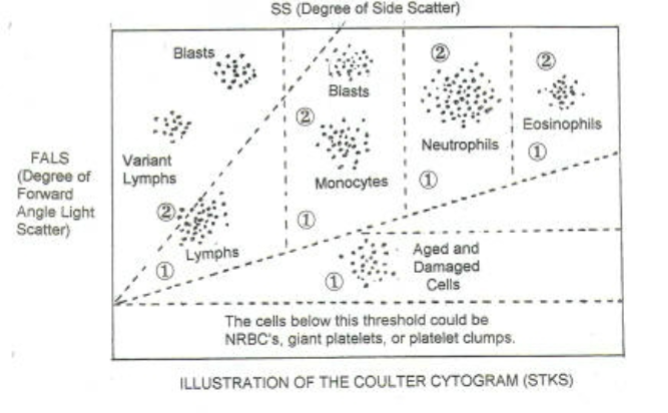
As the cell enters the laser beam in flow cytometry
Light is scattered through 360 degrees
This combination of forward scattered and Side Scattered
light picked up by the detectors
By analyzing fluctuations in brightness at each detector, it is
possible to derive various types of information about the Cell
size, nuclear complexity, and cytoplasmic granulation of
each individual cell
FSC correlates with cell volume or size
0-10 degrees
SCC correlates with the complexity of the cell
90 degrees
Shape of the nucleus, amount and type of cytoplasmic gra
Flow Cytometry Histogram
FSC and SCC histogram
analysis technologies
flow cytometry - white blood cell populations
impedance - red blood cells/platelets
spectrophotometry - hemoglobin, uses light emitted diode (LED)
Hgb concentration is proportional to the absorbance of light
analysis process
aspiration
separation
dilution
staging
measurement
data/analysis
analysis process
aspiration
closed mode - min volume 1.5 mL, aspirated 240 uL
open mode - aspirated 180 uL
separation
takes place in the shear valve
20 uL for the WBC dilution
1.67 uL for the RBC dilution
12 uL for the Hgb dilution
dilution
components - syringes, shear valve, mixing chambers
reagents added - diluent/sheath, cyanide-free HGB lyse. WBC lyse (nuclear determination)
diluent/sheath
acts as the diluting substance for RBC/PLT and for HGb
it is used to maintain the stable cell volume of the red cells and platelets during counting and sizing
provides acceptable background counts
rinsing agent for the fluidic system
serves as a sheath fluid during the laminar flow process in the optical flow cell
hemoglobin lyse
Hemoglobin is often determined by a colorimetric method
– Imidazole: Non-cyanide reagent with color change and
read at 540nm
– Abbott CELL-DYN Sapphire
– Sodium Lauryl Sulfate:Non-cyanide reagent with color
change and read spectrophotometrically
– Sysmex XT and XE
– Other Lysing agent: converts free hemoglobin to
cyanmethemoglobin and read spectrophotometrically at
540nm
• Advia 120
• Some Beckman Coulters
• Hemoglobin Lyse: Rapidly lyses RBCs
• Converts hemoglobin to stable chromogen complex
• Measured spectrophotometrically
WBC lyse
WBC Lyse reagent - strips the WBC cytoplasm, leaving
the nuclear membrane intact so that the white cell nuclei can be
enumerated
It maintains the light scattering properties of
the WBCs for the duration of the
measurement period
It provides sufficient wetting action to prevent
accumulation of air bubbles in the Optical
Flow Cell system
staging and measurement - analysis
Staging
Peristaltic Pump
WBC Mixing Chamber
RBC/PLT Mixing Chamber
Optical Flow Cell
Measurement
Optical Flow Cell
HGB Flow Cell
Sample Injection Syringe
what’s measured and what’s calculated
Measured parameters:
WBC
RBC
HGB
MCV
Platelets
Reticulocytes
All other parameters are calculated:
Hct = (RBC x MCV) ÷ 10
MCH = (Hgb/RBC) x 10
MCHC = (Hgb/Hct) x 100
RDW= mean distribution width
data anylisis and results
scatterplots, histogram, calculations
data accumulated can be analyzed using software
gating
the data generated by flow-cytometers can be plotted in a single dimension, to produce a histogram
two dimensional dot plots or even in three dimensions
the regions on these plots can be sequentially separated, ased on FSC, SSC and fluorescence intensity
creating a series of subset extractions, termed “gates”
linearity limits
defined by instrument manufacturer
range of test results where answers are considered accurate
when results are outside the linearity, alternate methods must be used
dilution
report as “greater than x”
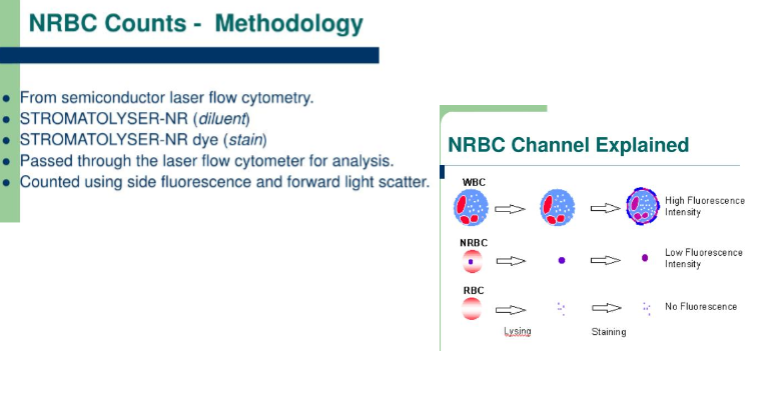
nucleated RBCS
> 10 nRBCs will falsely elevate Total WBC count
Because they are counted in WBC chamber
> 10 needs to be a corrected count
Corrected WBC = WBC x 100 / #nRBC + 100
Example: if WBC=5,000 and 10 nRBC were counted,
what is the Corrected WBC?
Corr. WBC = 5,000 x 100/(10 + 100) = 4545.5
Automated instruments have this ability
nucleated RBC overlap WBC
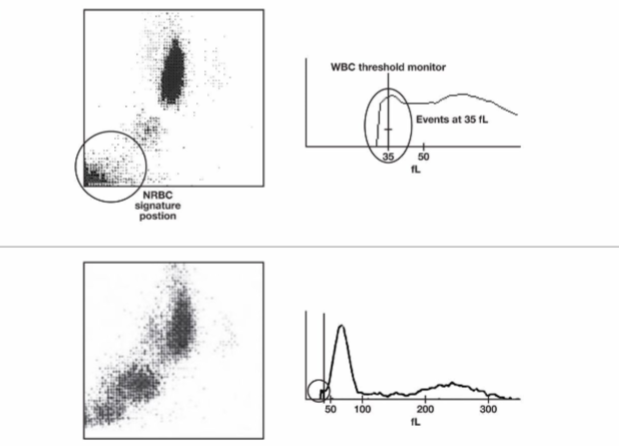
sysmex nRBC counts explained
total WBC count
the total WBC count is determined in whole blood in which red cells have been lysed
fully automated multichannel instruments perform WBC counting by either
impedance
light scattering
or both
total WBC count
3-part differential usually counts
Granulocytes or large cells
Lymphocytes or small cells
Monocytes(mononuclear cells) or (middle cells)
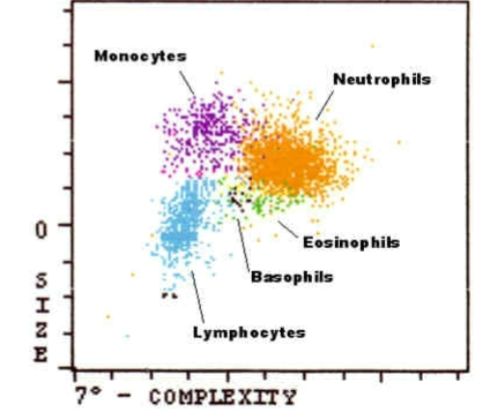
5-part differential classify cells to
Neutrophils
Eosinophils
Basophils
Lymphocytes
Monocytes
6-Part Diff: 5-Part + Immature Granulocytes
sysmex histogram
cold agglutinant can affect the patient results so that even tho the QC is within range, not all patient results will be correct
causes of erroneous results
Cold agglutinins
decreased RBC , MCV increase
Lipemic or hemolyzed sample
increased Hgb, MCH, MCHC erroneous
High WBC
RBC increased, HCT increased
Sample contaminated with IV fluid
MCV increased, cell counts increased
Incomplete aspiration of sample
Clotted sample
Platelet clumps may falsely increase the WBC
count, while falsely decreasing the PLT count
cold agglutinins
most common cause of MCHC > 37.0
causes a decreased RBC and increased MCV
what to do next?
warm the specimen in a 37C heat block
eliminated cold agglutination and resolves CBC interferences
could be HS
look for spherocytes too
lipemia
increases Hgb, MCH, MCHC
two methods to resolve
plasma replacement
measure and discard plasma
replace with equal part saline
mix and repeat CBC
RBC washing
wash aliquot of RBCs
perform a count on washed aliquot for indices
calculate Hgb from indices
IV fluid contamination
sample contaminated with IV fluid
MCV increased, cell counts decreased, Hgb decreased
look for delta check error
redraw sample
interferences
Cold Agglutinins
RBC too low, MCV too high
Agglutination Flag
Warming sample at 37o usually resolves
Lipemia
Hemoglobin, MCH, MCHC erroneous
Plasma Replacement with saline
Measure and discard plasma, replace with saline
High WBC
RBC too high, HCT too high
Perform a dilution
IV Contamination
MCV too high, RBC, Hb, HcT may be decreased
Look for delta error
Redraw Sample
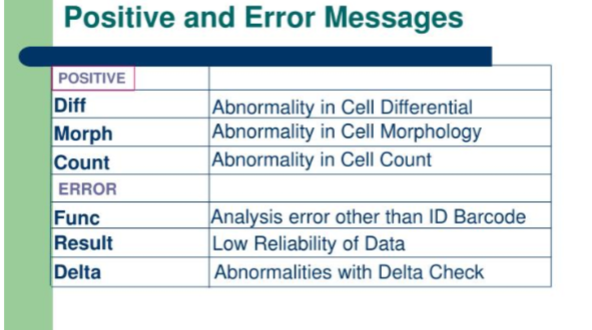
instrument flags
Instrument flags are generated when variations
from normal histograms and cytograms are
present.
Must be reviewed visually
Flags
Blasts, IG, band
RBC morphology
Platelet clumps
Linearity limits (WBC/RBC too Hi or too Low)
maintaining accuracy
Maintaining Accuracy
Controls
3 levels (alternate between high & low abnormal
control)
2 levels, every 8 hours
Background Count/Checks
Count using reagents only
High count indicates a problem with analyzer or
reagent
Calibration
Daily maintenance
Weekly maintenance
Maintaining Accuracy
preventive maintenance
regular helps to keep QC in range
shear valve
flow cells
aperture flush
dilution chambers rinse
zap
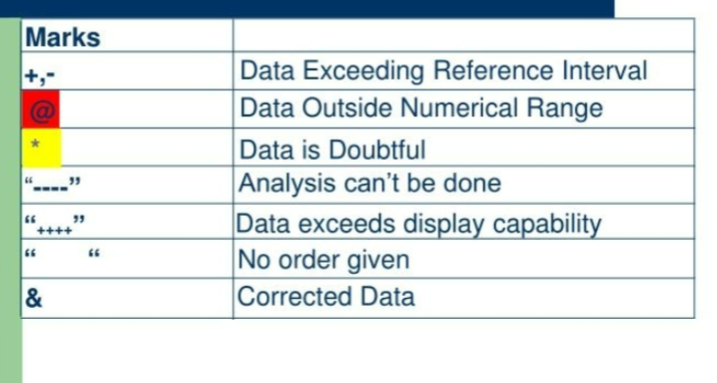
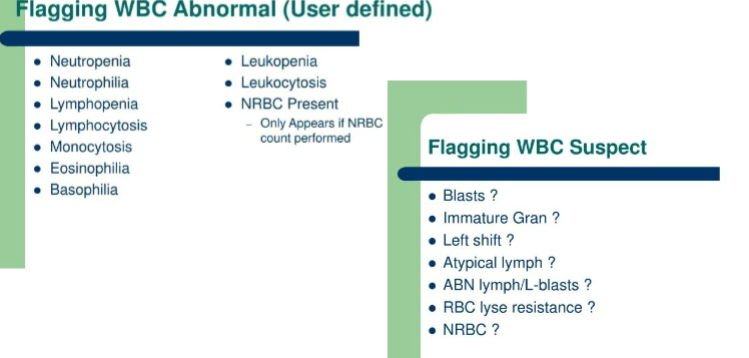
flagging
parameter marks
flagging WBC suspect and abnormal
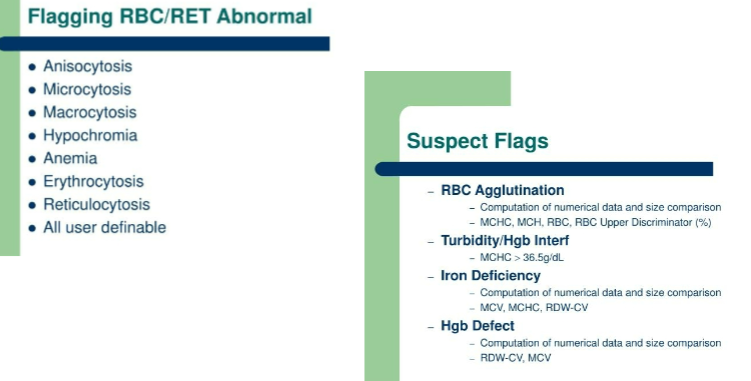
Flagging RBC/RET abnormal and suspect flags
manual WBC and platelet count
hemocytometer
WBC and platelet count
Prepare a 1:100 dilution of the sample in a
2% acetic acid or 1% (0.1N) HCl
The diluting fluid will hemolyze RBC's so that
WBC's and platelets are not obscured
Allow 10 minutes for the RBCs to lyse
Load both chambers of the hemocytometer
Allow 3 minutes for the cells to settle
Perform the counts
WBC calculation
Counts from each side of the chamber should match within
25%. Average the values for the duplicate determinations when
reporting results
# of Cells Counted X Dilution Factor = WBC per mm3
# of Squares Counted X Depth Factor
Example: If 45 WBC's were counted in 4 WBC squares.
45 X 100 X 10 / 4 = 5000 mm3
Alternate Calculation: Calculate the average
number of WBCs in 1 square and multiply by
1000
sources of error
apparatus - dirt, chipper cover slip, scratches on hemoctyomter
personal technique
inherent error
errors caused by personal technique
Not thoroughly mixing blood/inadequate
shaking
Failure to discard first 4 drops (Unopette)
Not loading chamber properly (overfilling,
trapped air bubbles)
Counting cells inaccurately (skipping cells,
counting cells twice, counting on wrong
borders)
Calculation error
Clerical error
inherent errors
Field Errors - relates to the random
distribution of cells on the counting
chamber
Statistical error - occurs when total
number of cells is too low to give
statistical confidence in result (this error
is reduced when larger numbers of cells
are counted)