INST104 Exam 2: Concept 2 - Design and Stories (Graphs, Journalism)
1/18
There's no tags or description
Looks like no tags are added yet.
Name | Mastery | Learn | Test | Matching | Spaced | Call with Kai |
|---|
No analytics yet
Send a link to your students to track their progress
19 Terms
What Do Charts Do
Charts are tools to present information visually. They data raw data and help us make sense of it in a processed and organized manner.
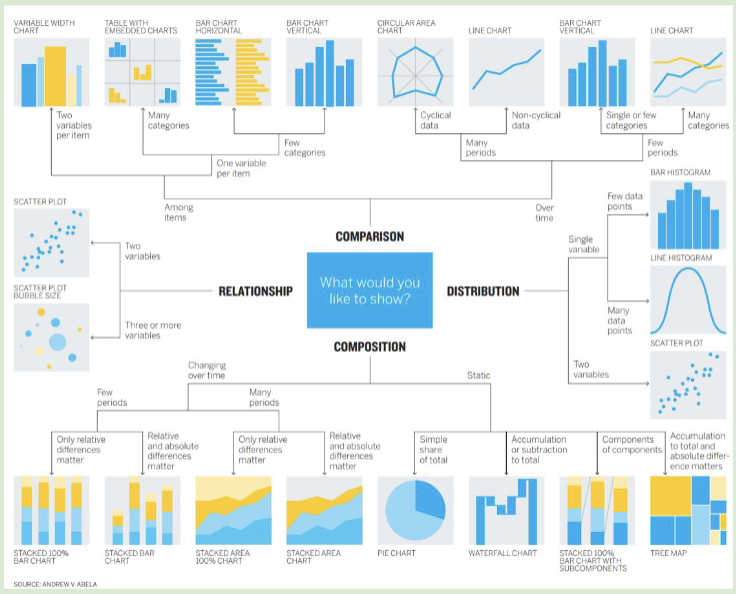
What Kinds of Charts are There?
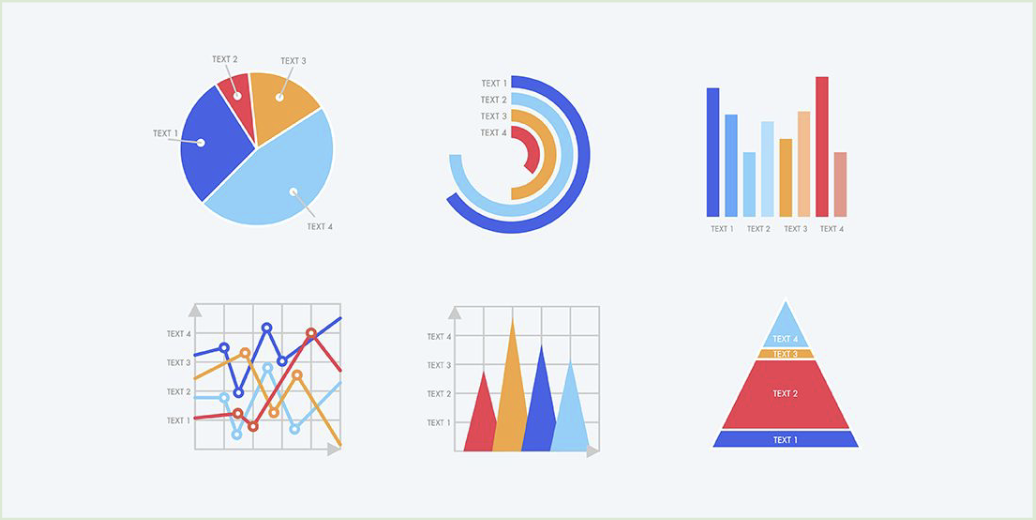
When Do I Use Which Chart?
Key Characteristics of Good Charts (2D-Static)
Just enough data, not too much
Present the right data, especially with geo maps
Use the right graph
Use the right colors
Charts Can Mislead
While charts can clarify information, they can also mislead (sometimes intentionally, sometimes through misunderstanding)
How Charts Work
“Any chart, no matter how well designed it might look, will mislead us if we don’t pay attention to it.” - Alberto Cairo
Charts can lie to us, pay attention and learn to read them cautiously. Charts/visualizations, are also based on a vocabulary of symbols + conventions that need to be known.
Designers and Journalists
Designers and journalist must visualize data transparently and responsibly
Audiences must learn to question and verify information.
Visual literacy is a civic skill, essential in an era of misinformation and polarized media.
If we learn to read harts well, we can make better decisions, demand better information, and resist manipulation.
How to Make a Good Chart
Start with the story, not the chart
What chart fits the data, not the other way around
Be clear on what you are trying to present from the beginning
Keep it simple with all non-essentials removed
Label everything
Remember that Clarity Beats Cleverness (go for a simple boring charts rather than a beautiful one that confuses people)
Action is at the heart of Interaction
Both storytelling + design have action at the heart of their processes
We are telling stories through our designs.
Examples:
What can this product or service do for people?
What can people do with it?
What actions does a product enable?
Stories Ask Questions and Delay Answers
Finding the answer yields a satisfying ending
No different from bridging the Gulf of Execution (what can I do?) and the Gulf of Evolution (what just happened?)
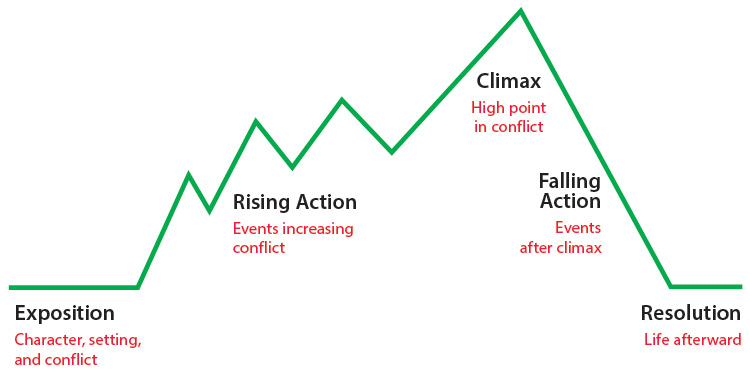
Narrative Arc
Created by Gustav Freytag, a German playwright and novelist.
Divided into five parts
Exposition
Rising Action
Climax
Falling Action
Conclusion
Designers can use the rising and falling to emphasize large and small actions.
Web Designer - Apple’s Product Pages (narrative arc)
Exposition: The page opens with clean visuals and a simple, bold statement.
Rising Action: As you scroll, dynamic animations introduce the technical details, chip performance, battery life, display, each building excitement.
Climax: The story peaks with cinematic visuals or videos showing the product in action.
Falling Action and Resolution: The bottom of the page returns to calm, specs, purchase options, and subdued tones that provide closure.
Architecture - Daniel Libeskind’s Jewish Museum, Berlin (narrative arc)
Exposition: Visitors enter through an ordinary-looking building,
representing pre-war normalcy.
Rising action: As visitors descend into the zigzagging underground
corridors, the architecture becomes disorienting; slanted walls, dead
ends, and voids evoke fragmentation and loss.
Climax: The “Holocaust Tower,” a tall, dark, unheated void lit only by
a slit of light, represents the emotional peak.
Falling action and resolution: Visitors ascend back into daylight,
emerging into galleries that reflect survival and continuity.
Spaceship Designer - SpaceX’s Dragon Capsule (narrative arc)
Exposition: Boarding begins in calm white interiors, minimalist lighting. A
prelude to flight.
Rising action: During liftoff, the lighting and screen interfaces subtly shift;
vibration and acceleration heighten tension.
Climax: During orbit, the displays transition to a serene earth-view
interface, signifying success.
Falling action/resolution: After docking, lighting softens, systems quiet
down moving from adrenaline to tranquility.
The Hero’s Journey Origin
Created by Joseph Campbell, an American mythology professor.
A universal pattern in myths and stories across various cultures and time periods
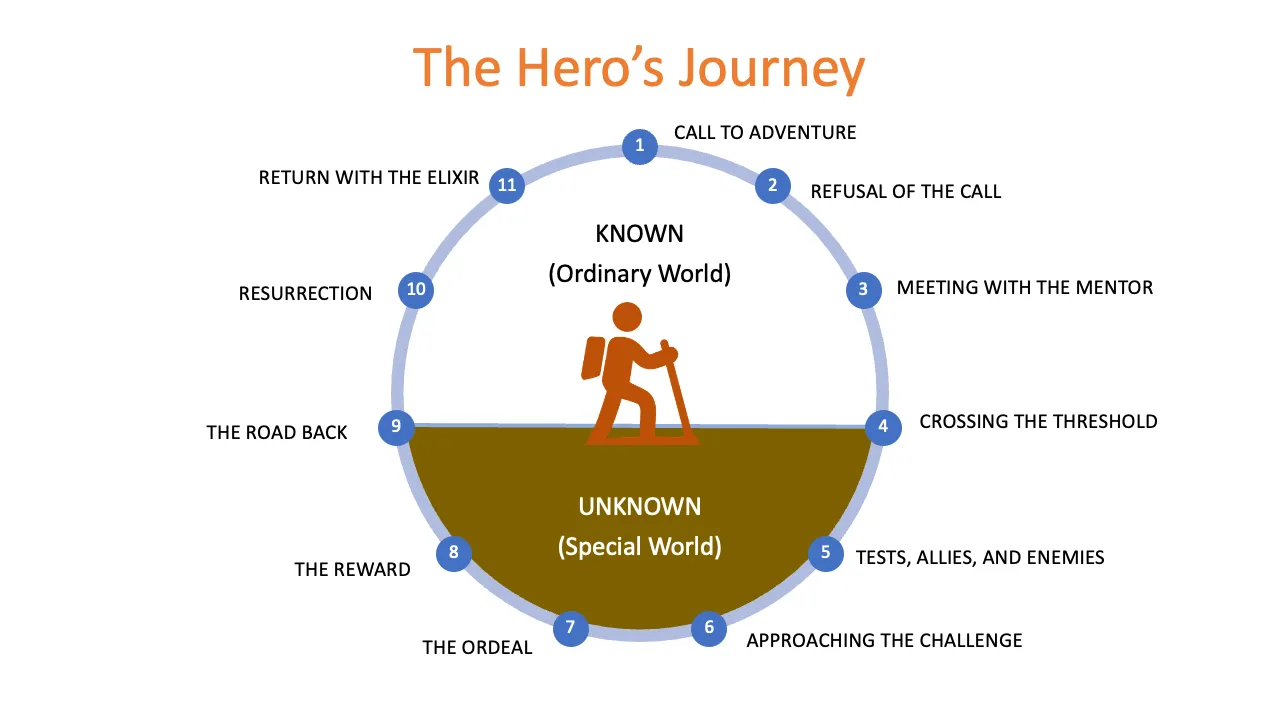
The Hero’s Journey Tool
The main premise is that a hero is taken away from the ordinary life into an adventure.
We can translate this design in which any product or service has a plot
Designers ask themselves:
What is the desire action?
How does the user complete the action?
Steps of Hero’s Journey
Ordinary World
Call to Adventure
Crossing the Threshold
Approach to the Inmost Cave
Ordeal
Reward
The Road Back (Boon)
Resurrection
The Hero's Journey (IKEA edition)
Ordinary World - Regular life, parking lot
Call to Adventure - Moving + need new furniture, hungry
Crossing the Threshold - Escalator
Approach to the Inmost Cave - Models
Ordeal - Maze, shopping
Reward - Candy
The Road Back (Boon) - Checkout
Resurrection - Hotdog, meatballs
A hero who embarks on a journey to create a better living space, maybe a
quest for a desk chai, facing challenges in home furnishing. They must endure a gauntlet of living room vignettes and kitchen scenarios before finding the office section receiving guidance from IKEA's products and services, and ultimately achieving a transformed home environment.
Storyboarding Tool
Designers use storyboards to communicate their ideas to
clients and even collaborators.
Designers aim to explain action with a concise series of pictures, a storyboard.
How does the story begin and end/ What is the setting?
Where are the story’s points of greatest intensity?
Used to think through a problem.
Great for planning the transformative action of a story.
Make simple drawings.sketches just to get the whole story down.