Chapter 14: Behind the Supply Curve
1/40
There's no tags or description
Looks like no tags are added yet.
Name | Mastery | Learn | Test | Matching | Spaced | Call with Kai |
|---|
No analytics yet
Send a link to your students to track their progress
41 Terms
Production
process of turning inputs into outputs
The cost structure of a firm depends on the nature of the
production process
Production Function
relationship between the quantity of inputs a firm uses and the quantity of output it produces
Fixed input
input where quantity is fixed for a period and cannot be verified
Variable input
input whose quantity the firm can vary at any time
Long run
period in which all inputs can be varied
Short run
period in which at least one input is fixed
Total product curve
shows how the quantity of output depends on the quantity of the variable input for a given quantity of a fixed input
Marginal Product (of labor)
is the change in output resulting from a one-unit increase in the amount of labor input
Marginal product initially _____ as more workers are hired; then it _____
rises ; declines
the relationship between inputs and outputs is
positive but not constant
Marginal product
additional quantity of output that is produced by using one more unit of that input
MPL =
ΔQ / ΔL
Fixed cost
cost that does not depend on the quantity of output produced
Variable cost
cost that depends on the quantity of output produced
Total cost of producing a given quantity of output
sum of the fixed cost and the variable cost of producing that quantity of output
TC =
FC + VC
Total cost curve becomes _____ as more output is produced, a result of diminishing returns
steeper
Marginal cost
change in total cost generated by one additional unit of output
MC =
ΔTC / ΔQ
Why is the Marginal cost curve upward sloping?
Because there are diminishing returns to inputs. As output increases, marginal product of the variable input declines
Average total cost =
TC / Q
Average Fixed Cost =
FC / Q
Average variable cost =
variable cost per unit of output produced
Spreading effect
the larger the output, the more output over which fixed cost is spread, leading to lower average fixed cost
Diminishing returns effect
The longer the output, the more variable input required to produce additional units, which leads to higher average variable cost
A marginal cost is upward sloping because of
diminish returns
Average variable cost is _____ sloping but ______ than marginal cost curve
upward ; flatter
Average fixed cost is ________ sloping because of the spreading effect
downward
Marginal cost curve intersect the _____ curve from below, crossing it at its _____ point
average total cost ; lowest
All inputs are variable in the _______
long run
Diminishing returns to a factor
short run
Decreasing returns to scale, constant returns to scale, increasing returns to scale
Long run
There are increasing returns to scale (economics of scale) when
long-run average total cost declines as output increases
There are decreasing returns to scale (diseconomics of scale) when
long-run average total cost increases as output increases
There are constant returns to scale when
long-run average total cost is constant as output increases
When the marginal product of labor is increasing, marginal cost is:
decreasing

A curve represents …
Marginal cost curve

B curve represents…
Average total cost curve
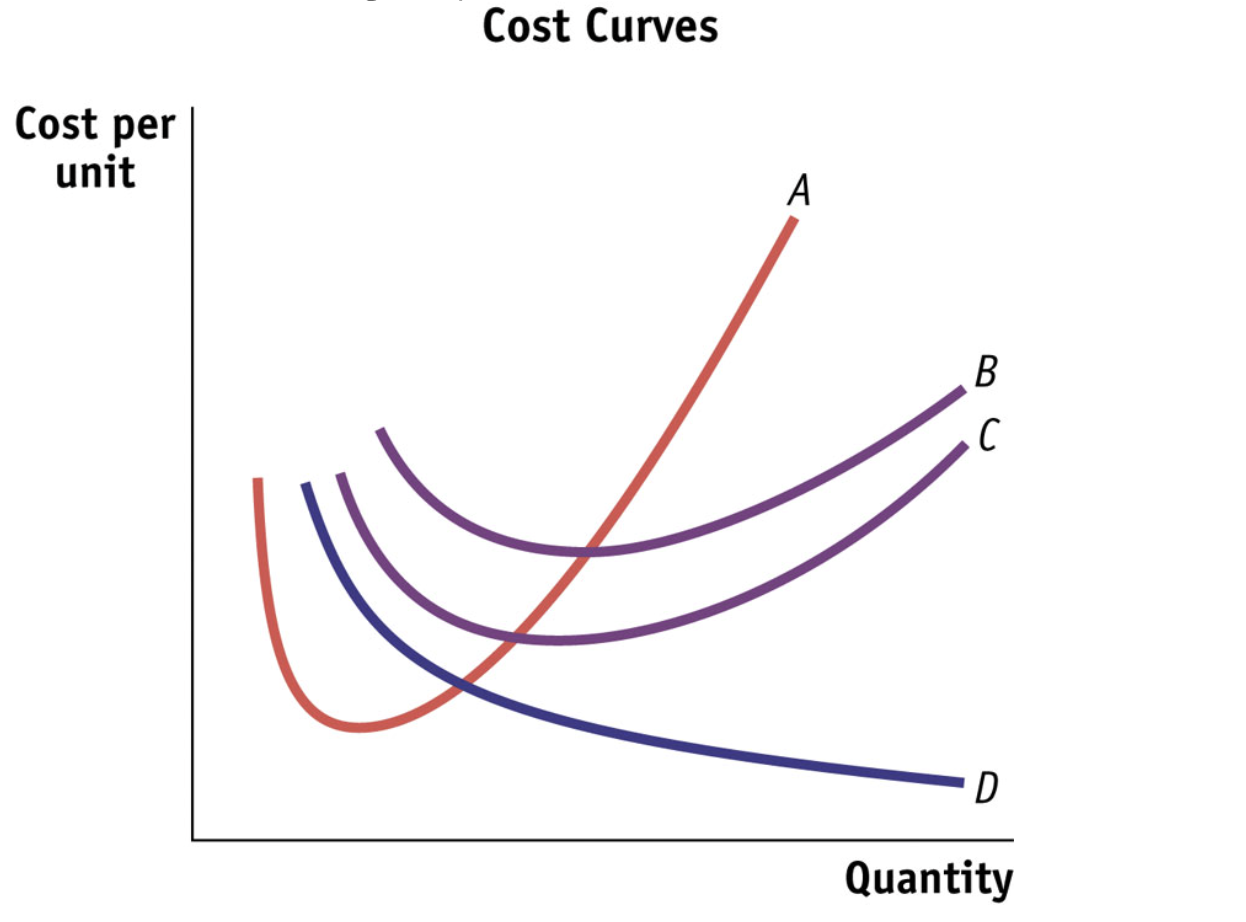
C curve represents…
Average variable cost curve

D curve represents…
Average fixed cost curve