Chapter 7: Potential GDP, Economic Growth, and Business Cycles
1/19
There's no tags or description
Looks like no tags are added yet.
Name | Mastery | Learn | Test | Matching | Spaced |
|---|
No study sessions yet.
20 Terms
Potential GDP
real GDP when all inputs are fully employed — labour, capital, land/resources, entrepreneurship
short-run goal for economic performance
outcome if invisible hand works perfectly
the reference point for a well-functioning, fully employed, economy
Potential GDP Per Person
potential GDP divided by the population
best represents the highest material standard of living an economy can produce if all existing inputs are fully employed
a better measure of maximum living standards
Business Cycles
The fluctuation of real GDP per person around potential GDP per person
Economic Growth
Expansion of economy’s capacity to produce products and services
The increase of potential GDP per person over time
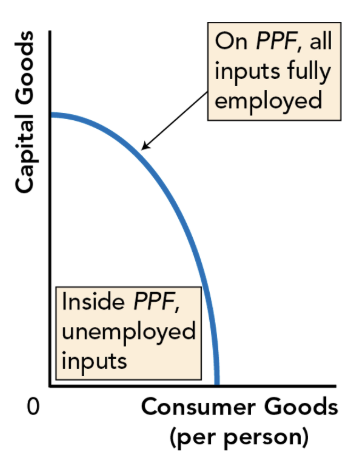
Macro Production Possibilities Frontier (PPF)
Shows maximum combinations of products/services a country can produce when all inputs fully employed
On macro PPF: all inputs fully employed — producing at potential GDP
Inside macro PPF: some inputs unemployed — producing below potential GDP
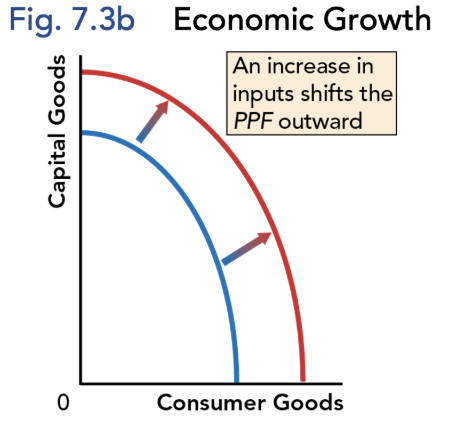
Economic Growth Increases…
Potential GDP per person
Caused by increases in the quantity and/or quality of a country’s inputs, including technological change
Shifts macro PPF outward
Contributions to economic growth and potential GDP increase
Increase in Labour
Increase in Capital
Increase in Land and Resources
Increase in Entrepreneurship
Increase in Labour
Quantity: population growth, immigration, labour force participation rate
Quality: increases in human capital — increased earning from work experience, on the job training, education
Increases in Capital
Quantity: more factories and equipment
Quality: technological change — improvements in quality of capital through innovation, research, development
Increases in Land and Resources
Quantity: bringing unconnected land/resource into the circular flow
Quality: increase in capital used with land
Increase in Entrepreneurship
Quantity and quality interrelated
Better management techniques, organization, worker/management relations
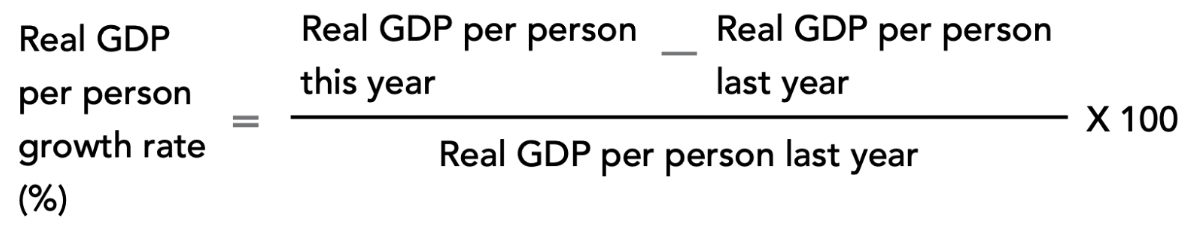
Economic Growth Rate
Annual percentage change in real GDP per person
Rule of 70
Number of years it takes for initial amount to double = 70 divided by annual percentage growth rate
Because of compounding, small differences in annual growth rates have large consequences over time
Productivity
Quantity of real GDP produced by an hour of labour
Increases in productivity can increase living standards
More can be produced and reduced amount of work time required to buy products and services
The most important source of increases in our material standard of living
Creative Destruction
Competitive business innovations generate profits for winners, improving living standards, but destroy less productive or less desirable products and production methods
Imporves living standards
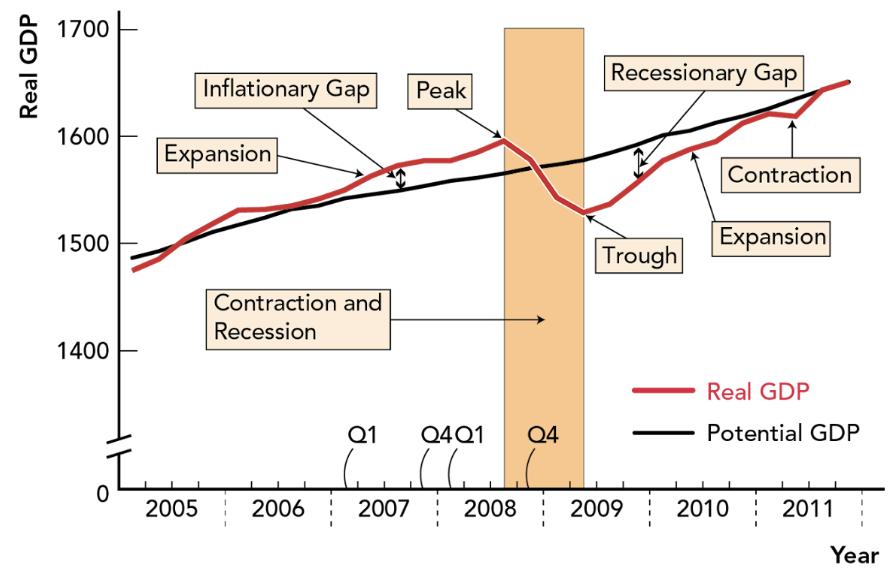
Language of Business Cycles
Up and down fluctuations of real GDP
Expansion: period during with real GDP increases — business activity increases
Peak: highest point of an expansion
Contraction: period during which real GDP decreases — business activity decreases
Trough: lowest point during contraction
Recession: 2+ successive quarters (of a year) of contraction of real GDP
Output Gap: real GDP - potential GDP
Inflationary Gap: real GDP is above potential GDP — gap is a positive number
Recessionary Gap: real GDP below potential GDP — gap is a negative number
Shocks
Unexpected events that affect an economy
External shocks
New technologies
New resource discoveries
Changing world prices for resources like oil
Natural Disasters
Pandemics
Wars
Changes in government fiscal or monetary policies
Internal Shocks
Changing expectations (by consumers, businesses, or investors)
Disruptions in financial markets (money and banks)
Connection failures between input and output markets
Positive shocks
Lead to expansion
Introduction of new technologies
Government fiscal or monetary policies
Negative shocks
Leads to recession
Financial crises
Natural disasters
Pandemics
Wars
Affects of government fiscal or monetary policies