2.5.2 output gaps
1/17
There's no tags or description
Looks like no tags are added yet.
Name | Mastery | Learn | Test | Matching | Spaced | Call with Kai |
|---|
No analytics yet
Send a link to your students to track their progress
18 Terms
Actual growth rate
Annual percentage increase in real GDP
→ Reflects economy’s short-term performance - influenced by demand + supply shocks, fiscal + monetary policies + other cyclical factors
Calculated by change in GDP
Long-term trend growth rate
The average rate at which an economy can grow over a sustained period without generating inflationary pressures
→ Determined by factors like tech, labour force growth, capital accumulation + productivity improvements - shown by shifts of LRAS
Key differences between actual growth + trend growth
Actual growth rates fluctuate more due to short-term factors, whilst trend growth rates indicate long-term sustainable growth
Actual growth rates can be highly volatile, whereas trend growth rates are relatively stable
Synonyms for actual growth
Short run economic growth
Growth in national income
GDP growth
Synonyms for trend rate growth
Long run economic growth
Potential growth
Long run trend rate growth
When does an output gap occur?
When actual + potential GDP are different
Positive output gap
Occurs when actual GDP > potential GDP
→ Indicates economy is producing above its sustainable capacity, often leading to inflationary pressures
E.g. during economic booms, such as the late 1990s dot-com bubble, the USA experienced a positive output gap
*temporary e.g. time of war
Negative output gap
Occurs when actual GDP < potential GDP
→ Indicates underutilisation of resources, high unemployment, + deflationary pressures
E.g. during the 2008 financial crisis, many economies faced negative output gaps due to reduced demand + high unemployment
Difficulties of measurement
Estimation of potential GDP: not directly observable + must be estimated, leading to potential inaccuracies (hard to quantity the FoP)
Data revisions: economic data is often revised, which can change the assessment of output gaps
Structural changes: changes in the economy’s structure, such as technological advances/demographic shifts can affect potential GDP estimates
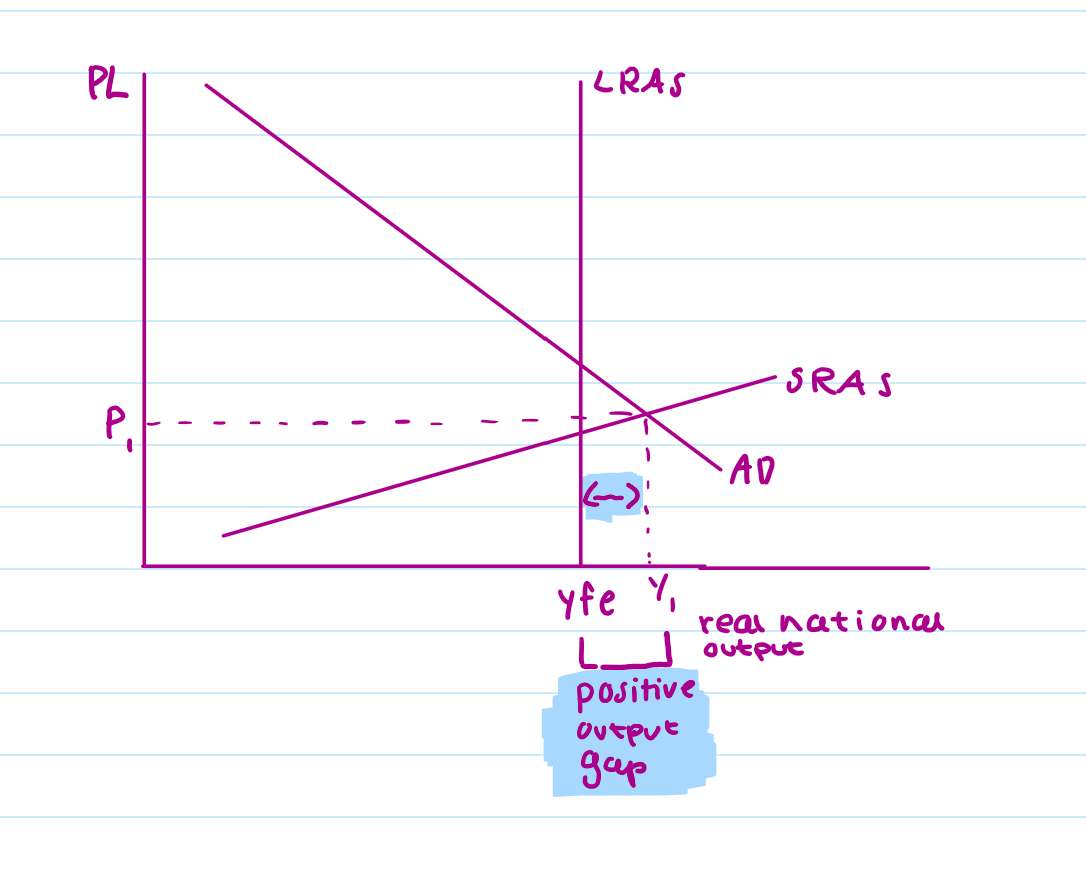
What does a positive output gap look like on a diagram?
Only 1 way
Vertical LRAS: Shows full unemployment output (Yfe) - economy’s productive capacity in long run, vertical line means output cannot increase in long run without effects of inflation
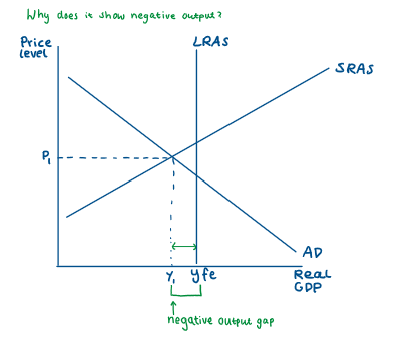
What does a negative output gap look like on a neo-classical diagram?
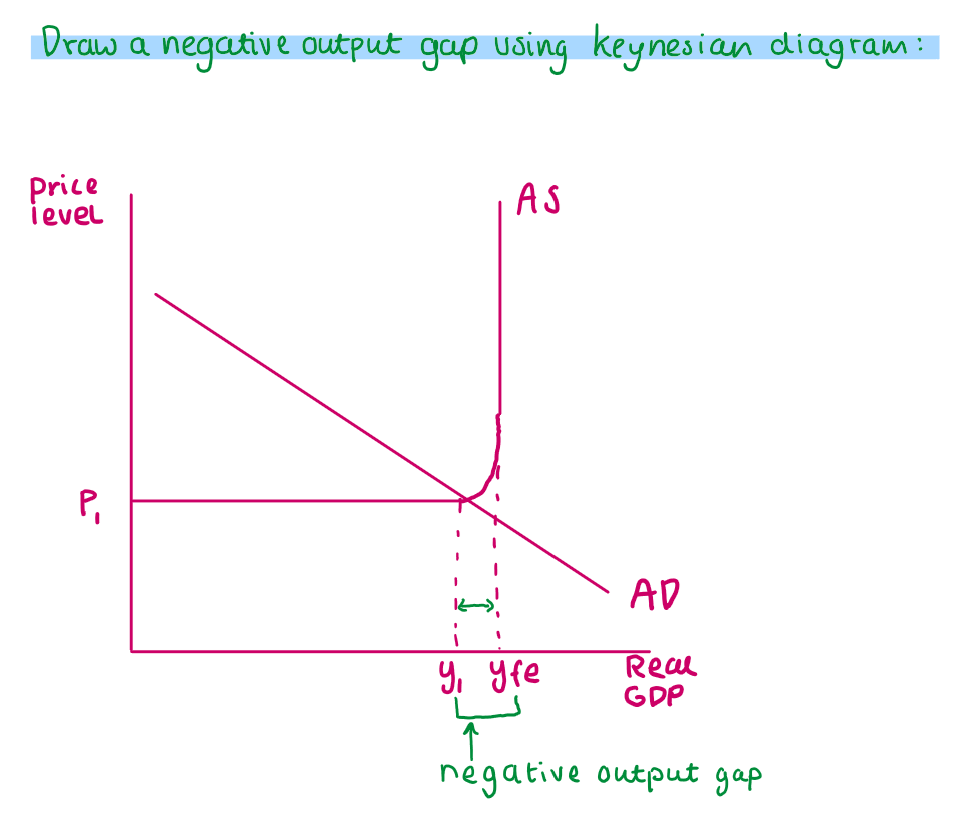
What does a negative output gap look like on a Keynesian diagram?
Real-world example of a negative output gap
During the 2008 financial crisis, the negative output gap was evident as many economies operated below their potential output due to reduced consumer and business spending.
Real-world example of a positive output gap
In the late 1990s, the U.S. economy experienced a positive output gap as high demand and technological optimism drove growth beyond sustainable levels.
What do Neo-Classical economists believe about negative output gaps?
Believe they will correct themselves in the long run
→ As labour + other resources get cheaper, firms will expand production back to LRAS
What do Keynesian economists believe about negative output gaps?
Believe that they might not correct themselves
→ If confidence is very low in economy, it might be that only gov stimulus can help economy
Likely situation during a negative output gap?
Economic growth is relatively low
Unemployment is relatively high (in comparison to maximum possible output)
Inflation is relatively low
Likely situation during a positive output gap?
Economic growth is relatively high/record high
Unemployment is relatively low/zero unemployment
Inflation is relatively high/record high