Unit 4 Stats Categorical Data
1/9
There's no tags or description
Looks like no tags are added yet.
Name | Mastery | Learn | Test | Matching | Spaced | Call with Kai |
|---|
No analytics yet
Send a link to your students to track their progress
10 Terms
Variables
Characteristics of data that is recorded
Categorical
Names, categories, count # of occurrences
(Y/n, t/f, fav color)
Quantitative
Find an average
(Height weight ACT Score)
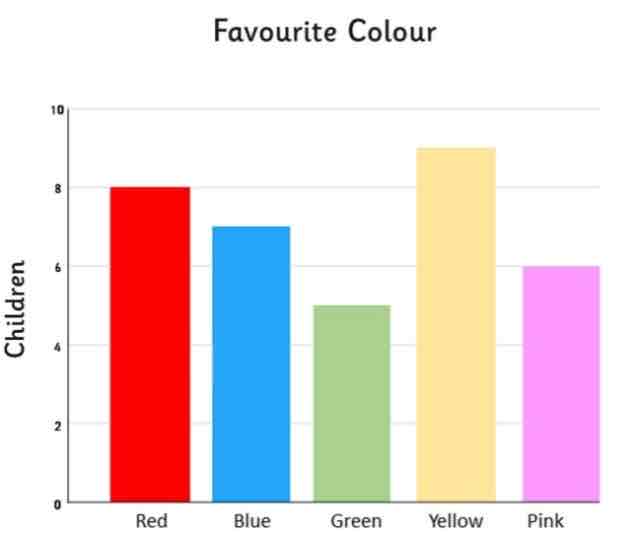
Bar graph
Shows actual count= Frequency
Or % (relative frequenc)
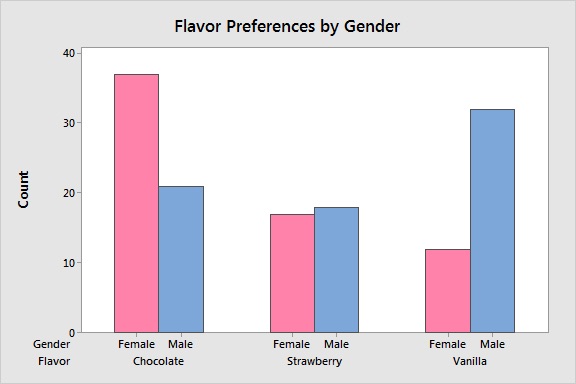
Side by side bar graph (sbs)
Comparing different groups
must use %
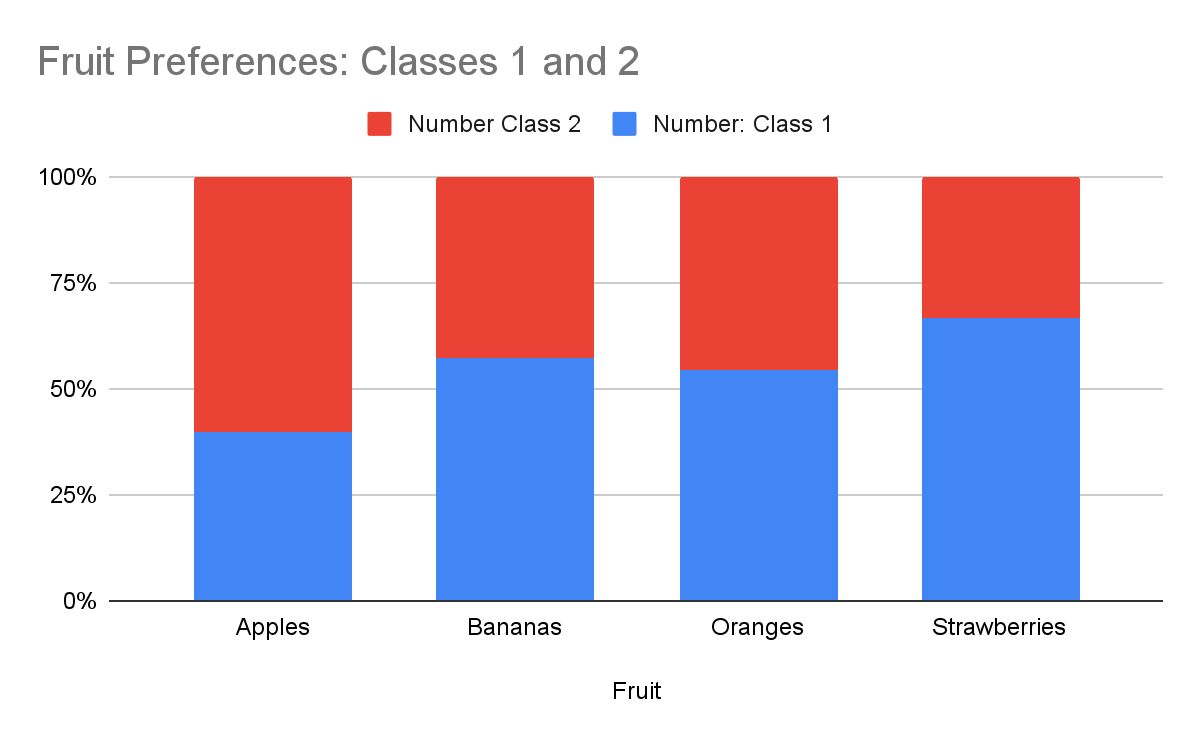
Segmented bar graph
Stacked sbs graph
-must use %
* if bars look exactly the same
“No association”
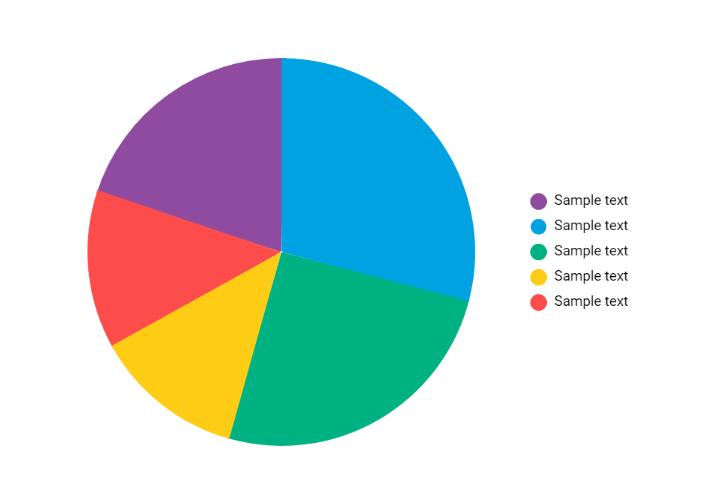
Bar graph
Use %
Adds to 100%
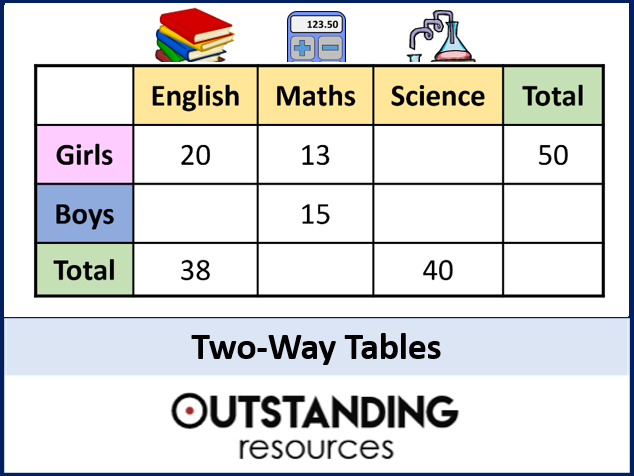
Two way table
shows data for 2 categorical variables
*marginal distribution+anything from the totals
*dnominator changes
for all categorical data
things can ONLY go in ONE category
conditional distribution
distribution only look @ one row/column