topic 7 - rates of reaction and energy changes
1/24
Earn XP
Description and Tags
Name | Mastery | Learn | Test | Matching | Spaced |
|---|
No study sessions yet.
25 Terms
state the METHOD to investigate the effects of changing the conditions of a reaction on the rates of chemical reactions (GAS)
support a gas syringe with a stand, boss and clamp
using a measuring cylinder, add 50cm³ of dilute hydrochloric acid to a conical flask
add 0.4g of calcium carbonate to the flask
immediately connect the gas syringe and start the stop clock
record the time for every 10cm³ of gas produced for 5 minutes
when the reaction is complete, clean the apparatus
repeat the experiment for different concentrations, recording time and concentration in a table
state the ANALYSIS of the investigation the effects of changing the conditions of a reaction on the rates of chemical reactions (GAS)
for each concentration of hydrochloric acid, plot a graph on the same set of axes to show:
volume of gas (cm³) on the y-axis
time on the x-axis
a curve of best fit
for each concentration of acid, plot a graph to show:
mean rate of reaction = total volume of gas produced / reaction time
state the METHOD to investigate the effects of changing the conditions of a reaction on the rates of chemical reactions (VISIBILITY CHANGE)
using a measuring cylinder, add 50 cm³ of dilute sodium thiosulfate solution to a conical flask
place the conical flask on a spotting tile with a black cross drawn on it
using a different measuring cylinder, add 10cm³ of dilute hydrochloric acid to the conical flask
immediately swirl the flask to mix its contents and start a stop clock
measure and record the temperature of the reaction mixture
look down through the reaction mixture. When the cross is no longer visible, record the time on the stop clock
measure and record the temperature of the reaction mixture and clean the apparatus
repeat the experiment with different starting temperatures of sodium thiosulfate solution
state the ANALYSIS to investigate the effects of changing the conditions of a reaction on the rates of chemical reactions (COLOUR CHANGE)
calculate 1000/time for each temperature (this value is proportional to the rate of reaction)
plot a graph to show
reaction rate on the y-axis
temperature on the x-axis
a curve of best fit
explain collision theory
when reactants come together with kinetic energy, their particles will collide
some of these collisions will result in chemical bonds being broken and some new bonds being formed
increasing the frequency of successful collisions means that a greater proportion of reactant particles collide to form product molecules
not all collisions result in a chemical reaction
unsuccessful collisions happen when the colliding species do not have enough energy to break the necessary bonds
if they do not have sufficient energy, the collision will not result in a chemical reaction
explain how the concentration of a solution affects the rate of reaction
increasing concentration of solution will increase the rate of reaction
as there will be more reactant particles in a given volume, allowing more frequent and successful collisions per second
the number of collisions is proportional to the number of particles present
explain how the concentration of a solution affects the rate of reaction
increasing temperature increasing the rate of reaction
because the increase in temperature increases the kinetic energy of the particles
meaning there will be more frequent and successful collision per second
effect of temperature on collisions is not linear; small increase in temperature causes a large increase in rate
explain how the surface area of a solid affects the rate of reaction
increasing surface area of a solid reactant increases rate of reaction
because larger surface area of the particles means more of it will be exposed to the other reactant
producing a higher number of collisions per second
surface area of solid and rate of reaction is proportional
catalyst definition
substance that speeds up the rate of a reaction
without altering the products of the reaction
and itself being unchanged chemically and in mass
at the end of the reaction
explain how the addition of a catalyst increases the rate of reaction
catalysts provide an alternate route for the reaction to occur
this happens by lowering the activation energy required
thus providing a reaction pathway requiring less energy
state why catalysis is important in chemistry
increases rate of reaction/production rate
reduces energy costs
recall what enzymes are
biological catalysts
state what industry enzymes are used in
production of alcohol drinks
state when changes in heat energy occur
salts dissolving in water
neutralisation reactions
displacement reactions
precipitation reactions
state what needs to be measured when changes in heat energy occur in a solution
temperature changes
using a thermometer
to reflect the heat changes
exothermic reaction/change definition
change/reaction
in which heat energy
is given out
endothermic reaction/change definition
change/reaction
in which heat energy
is taken in
state what type of reaction breaking of bonds is
endothermic
state what type of reaction making of bonds is
exothermic
state when a heat change is exothermic
if more heat energy is released
in forming bonds in the products
than is required in breaking bonds
in the reactants
state when a heat change is endothermic
if less heat energy is released
in forming bonds in the products
than is required in breaking the bonds
in the reactants
explain how calculate the energy change in a reaction (given the energies of bonds)
energy change = energy taken in - energy given out
measured in kJ/mol
explain the term activation energy
minimum energy needed
for successful collisions
where atoms within the reactants
rearrange to form products
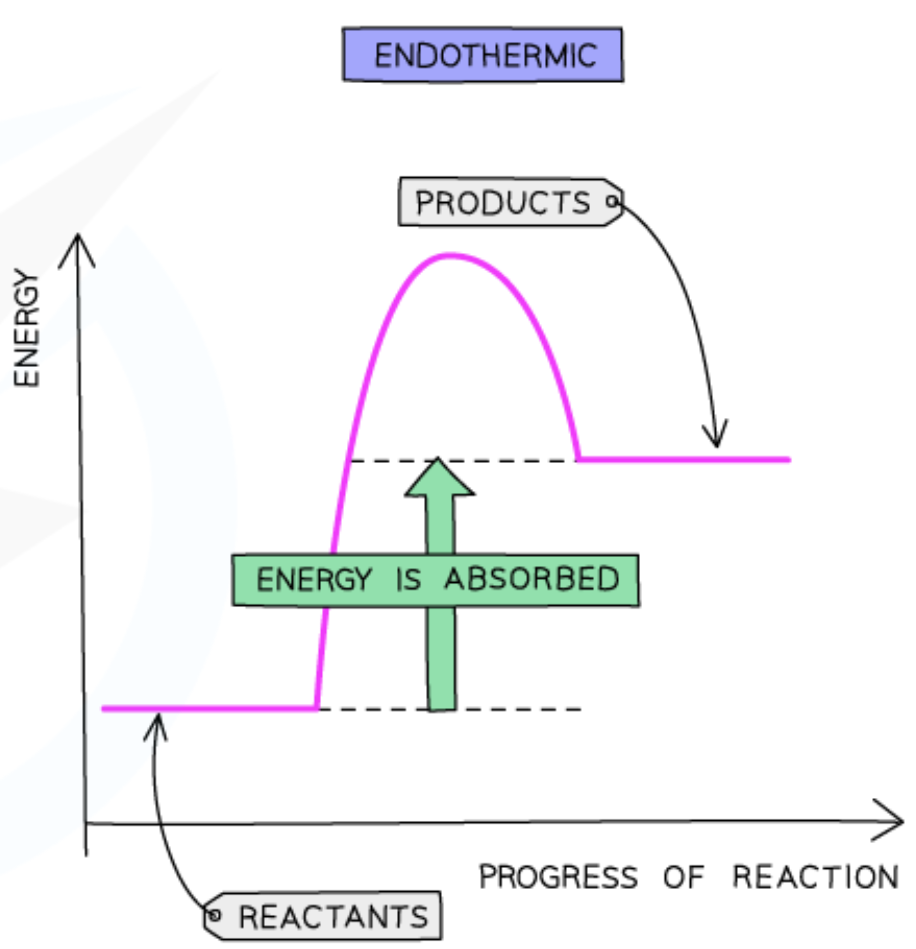
explain how to draw a reaction profile for endothermic reactions
energy is taken in endothermic reactions
energy of the products will be higher than the energy of the reactants
so the change in energy is positive
this is represented on the reaction profile with an upwards arrow
horizontal line to the left of the positive curve is the reactants
horizontal line to the right of the positive curve is the products
activation energy is the maximum value of the curve
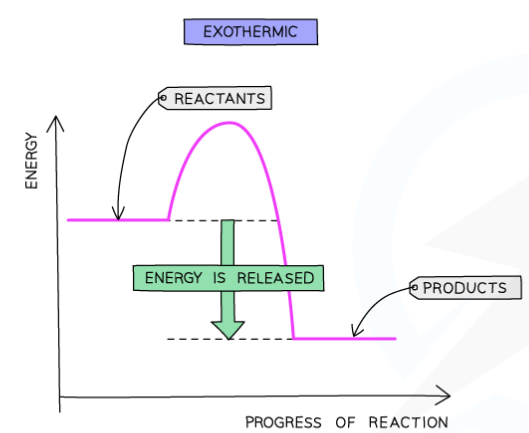
explain how to draw a reaction profile for exothermic reactions
energy is given out in exothermic reactions
the energy of the products will be lower than the energy of the reactants
so the change in energy is negative
this is represented on the reaction profile with a downwards arrow
horizontal line to the left of the negative curve is the reactants
horizontal line to the right of the negative curve is the products
activation energy is the maximum value of the curve