business analytics midterms
1/58
There's no tags or description
Looks like no tags are added yet.
Name | Mastery | Learn | Test | Matching | Spaced |
|---|
No study sessions yet.
59 Terms
STATISTICS
- the science of designing studies, gathering data, and then classifying, summarizing, interpreting, and presenting of the data.
POPULATION
: The complete collection of measurements, objects, or individuals under study.
SAMPLE
: A portion or subset taken from the population.
PARAMETER
: A number that describes a population characteristic.
STATISTIC
: A number that describes a sample characteristic.
DESCRIPTIVE STATISTICS
- includes the procedures for collecting, classifying, summarizing, and presenting data.
- Charts, tables, and summary measures such as averages are used to describe the basic structure of the study subject.
INFERENTIAL STATISTICS
INFERENTIAL STATISTICS
- Process of arriving at a conclusion about a population parameter (known as unknown quantity) on the basis of information obtained from a sample statistic (known as value)
DATA COLLECTION
1. Quantitative Data
2. Qualitative Data
QUANTITATIVE
- Numbers, breadth, generalizability
QUALITATIVE
- Words, depth, specific
QUANTITATIVE
Survey questionnaires
Test
Existing databases
QUALITATIVE
Unstructured interviews
Focus groups
Unstructured observations
SOURCES OF DATA
1. Primary
2. Secondary
PRIMARY
- Data is collected by the researcher
- Data is gathered through the use of questionnaire, interviews, observations
QUALITY CRITERIA:
FEASIBILITY
Are your sources and methods practical and efficient?
QUALITY CRITERIA
PROPRIETY
Are your methods respectful, legal, ethical, and appropriate?
SECONDARY
- Data collected, compiled or written by other researcherse.g., books, journals, newspapers, records, budgets
ADVANTAGES OF USING SECONDARY DATA
1. Low cost
2. Comparative or longitudinal data may be available
ISSUES IN USING EXISTING DATA
1. Missing or incomplete data
2. Confidentiality issues
3. Unknown, different, or changing definitions of data make comparison difficult
4. May not match what you need in terms of geographic location, same time period, or population – may be too aggregated
PRIMARY DATA COLLECTION METHODS
1. Focus Groups
2. Observation
3. Interviews
4. Survey
5. Questionnaires
6. Pre-test
7. Rating Scales
FOCUS GROUPS
- Structured small group interviews
- “Focused” in two ways:
o Persons being interviewed are similar in some way.
o Information on a particular topic is guided by a set of focused questions.
True
Focus Groups are used
- To solicit perceptions, views, and a range of opinions (not consensus)
- When you wish to probe an issue or theme in depth
- How many participants in Focus Group Discussions?
- When do you stop the conduct of focus group discussions?
OBSERVATION
- Is watching people, programs, events, communities, etc.
- Involves all 5 senses: sight, hearing, smell, touch, and taste. Observation includes more than just “seeing”
True
WHEN IS OBSERVATION USEFUL?
- When you want direct information
- When you are trying to understand an ongoing behavior, process, unfolding situation, or event
- When there is physical evidence, products, or outcomes that can be readily seen
- When written or other data collection methods seem inappropriate
OBSERVATION LIMITATIONS
1. Potential for bias
a. Effect of culture on what you observe and interpret
2. Reliability
a. Ease of categorization
INTERVIEWS
- Verbally asking participant’s point of view in his or her own words. Interviews can be either structured or unstructured, in person or over the telephone.
- Done face-to-face or over the phone
- Individual
INTERVIEWS ARE USEFUL
- When the subject is sensitive
- When people are likely to be inhibited in speaking about the topic in front of others
- When people have a low reading ability
TYPES OF INTERVIEWING
1. Structured
2. Guided
3. Conversational
STRUCTURED
- Uses script and questionnaire
- No flexibility in wording or order of questions
GUIDED
- Outline of topics or issues to cover
- May vary wording or order of questions
- Fairly conversational and informal
CONVERSATIONAL
- May not know that an interview is taking place
- Spontaneous
- Questions emerge from the situation and what is said
- Topics or questions are not predetermined
- Individualized and relevant to situation
INTERVIEWING TIPS
- Avoid long questions
- Create comfort
- Establish time frame for interview
- Avoid leading questions
- Sequence topics
- Be respectful
- Listen carefully
SURVEY
- A structured way to collect information using questionnaires.
True
SURVEYS ARE USED
- To collect standardized information from large numbers of individuals
- When face-to-face meetings are inadvisable
- When privacy is important or independent opinions and responses are needed
QUESTIONNAIRES
- Data collection instruments used to collect standardized information that can be expressed numerically or through short answers
- Basic instruments of surveys and structured interviews
DEVELOPING QUESTIONNAIRE
Write clear, complete directions.
- Review to see if it is user-friendly; consider the respondent.
- Make the questionnaire attractive.
- Work as a team.
- Plan on writing several draft questionnaires.
PRE-TEST
- Always with people as similar to respondents as possible
o Do they understand the questions? The instructions?
o Do questions mean same thing to all?
o Do questions elicit the information you want?
o How long does it take?
- Revise as necessary
Types of questions:
OPEN-ENDED QUESTIONS
a. allow respondents to provide their own answers
Types of questions:
CLOSED-ENDED QUESTIONS
CLOSED-ENDED QUESTIONS
a. List answers and respondents select either one or multiple responses
True
OPEN-ENDED QUESTIONS
PROS:
- Can get unintended or unanticipated results
- Wide variety of answers
- Answers in participants’ “voices”
CONS:
- More difficult to answer
- May be harder to categorize for interpretation
- More difficult for people who don’t write much
True
CLOSED-ENDED QUESTIONS
PROS:
- Easy to analyze responses
- Stimulates recall
CONS:
- Chance of none of the choices being appropriate
- Biases response to what you’re looking for
- Misses unintended outcomes
RATING SCALES
- Ordered options to gauge difference of opinion.
- Keep the order of choices the same throughout the form.
- Odd number of options allows people to select a middle option.
- Even number forces respondents to take sides.
- Simpler is better.
TYPES OF RATING SCALES
1. Category Scales
2. Numeric Scales
MEAN
- the sum of the scores divided by the number of items.
MEDIAN
- the middle of the value of the array; after the numbers have been ordered from lowest to highest or highest to lowest
MODE
- the most frequent value in the distribution.
RANGE
- the difference between the highest value and the lowest value in the array. (max - min)
HISTOGRAM
- a bar can be used to represent each category. The height of the bar indicates its size.
MEASURES OF SHAPE
• Describes the shape of the distribution of population or samples
- Skewness
- Kurtosis
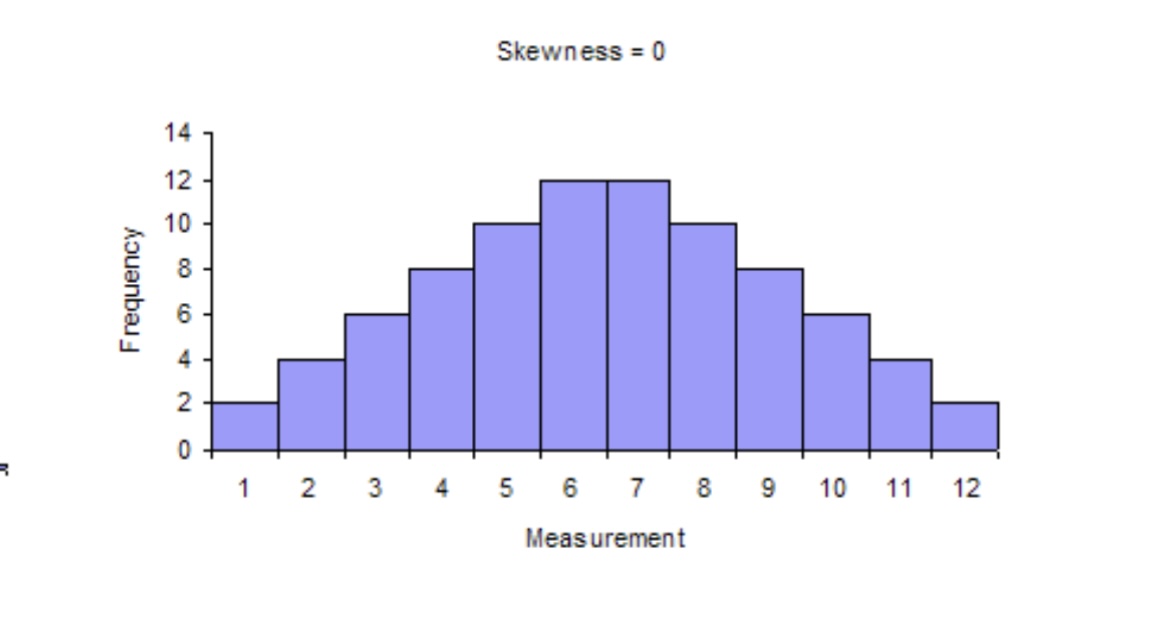
SKEWNESS
- A measure of symmetry or asymmetry
- Zero indicates perfect symmetry; the normal distribution has a skewness of zero
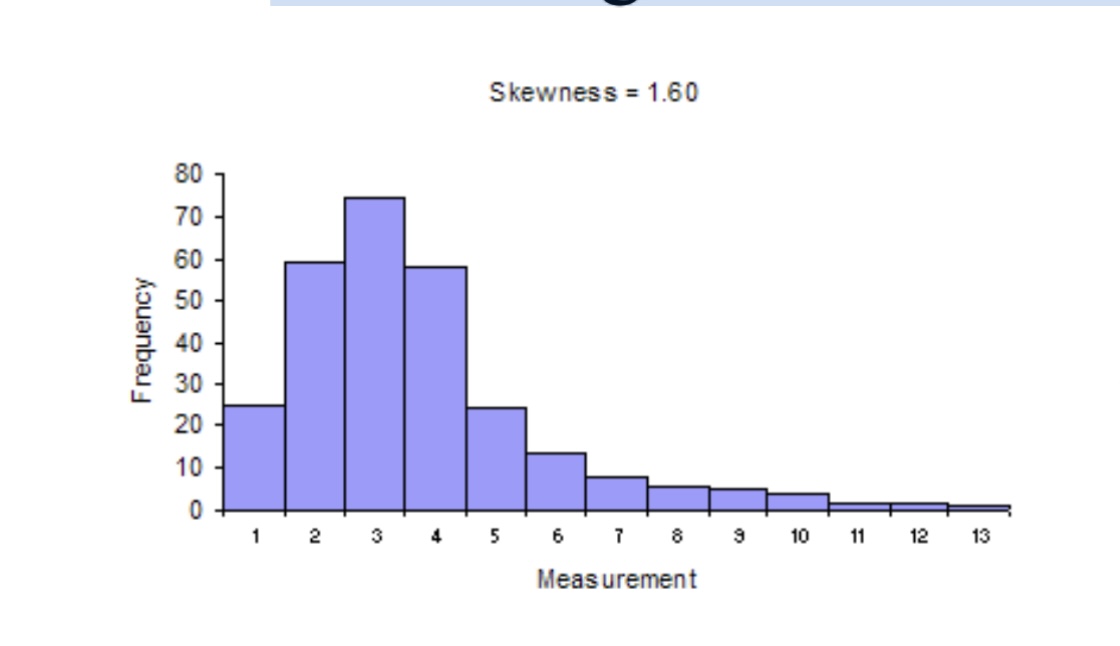
- Positive skewness indicates that the "tail" of the distribution is more stretched on the side above the mean. Positive skewness, the curve is on the left side.
- Negative skewness indicates that the tail of the distribution is more stretched on the side below the mean. Negative skewness, the curve is on the right side.
Skewness 0
Asa gitna mataas
Skewness -
Sa rightside mataas (mode)

Skewness +
Sa leftside mataas (mean)
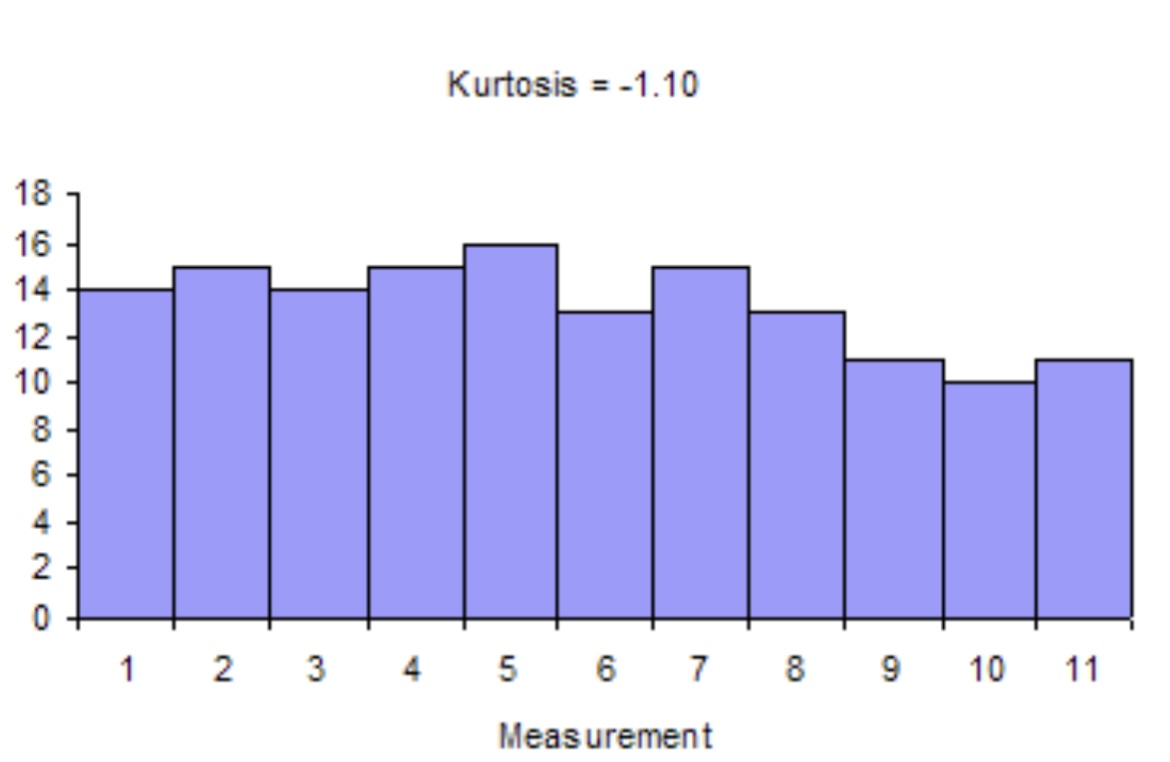
KURTOSIS
- Kurtosis is a measure of flatness of the distribution
- Heavier tailed distributions have larger kurtosis measures
- The normal distribution has a kurtosis of 3
- Positive kurtosis indicates a relatively peaked distribution
- Negative kurtosis indicated a relatively flat distribution
Kurtosis +
Mas tumatarik means mas bumababa si tail

Kurtosis -
Halos same height lahat
Leptokurtic
Fat tailed (wide/pahaba)
Pinaka mataas/tarik
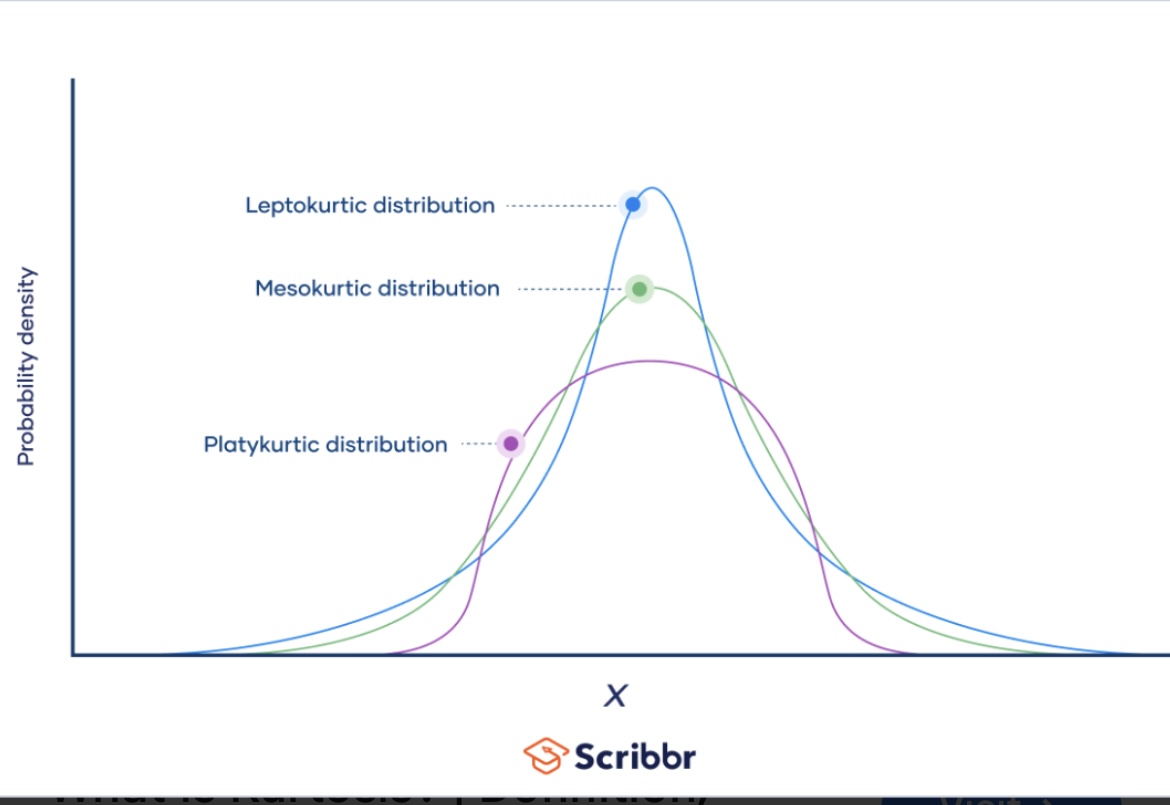
Platykurtic
Thin tailed (maigsi)
Pinakamababa

Mesokurtic
Medium tailed (middle wide/pahaba)
Gitnang taas
