1.7 Ecological relationships and energy flow 🚜
1/101
Earn XP
Description and Tags
GCSE CCEA Specification GCSE Biology Double Award Science, Triple Award Science Unit 1: Cells, Living Processes & Biodiversity
Name | Mastery | Learn | Test | Matching | Spaced | Call with Kai | Chat |
|---|
No analytics yet
Send a link to your students to track their progress
102 Terms
Sampling
dividing larger area into small sections as its too difficult to count all organisms
Effective sampling
reliable, a large sample size is needed – 20 to 30 quadrats counted
representative of habitat being investigated, placed randomly to produce valid results and avoid bias
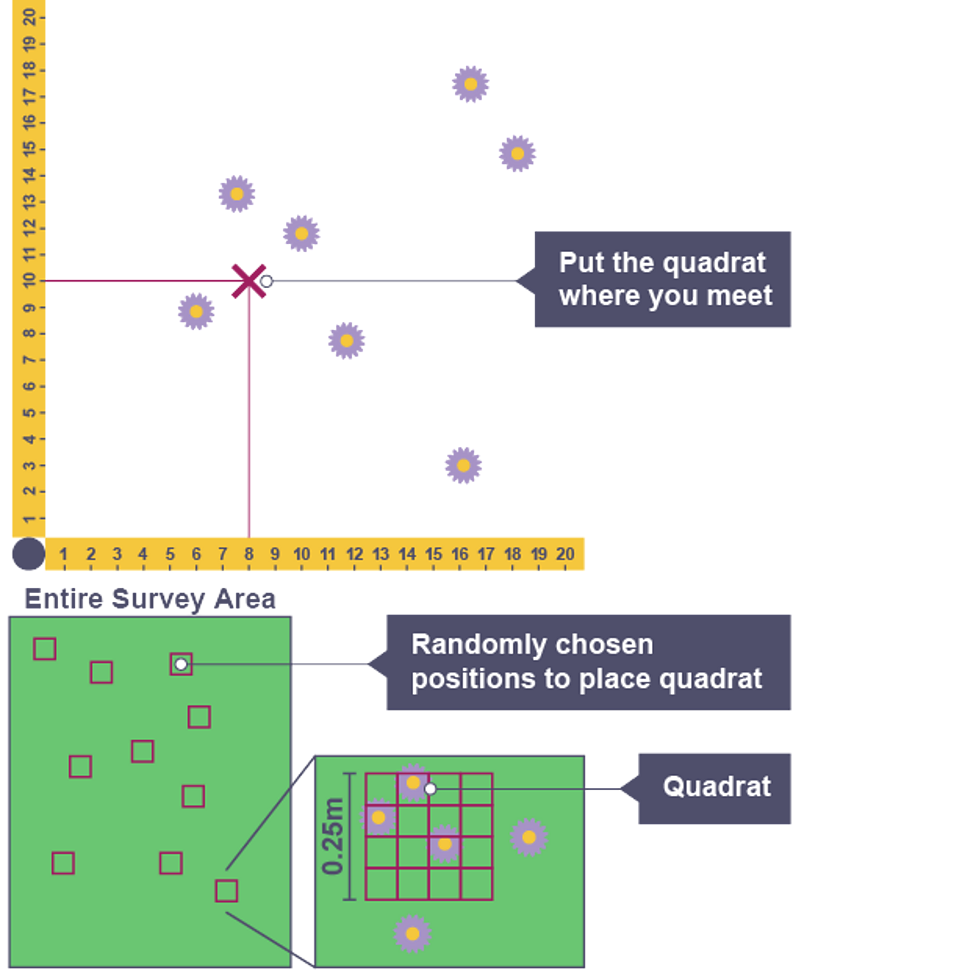
Quadrat
small square frame that can be used to count organisms
Belt transect
used to study changes across habitat (zonation) by using quadrat at regular intervals in straight line
How do abiotic factors affect distribution
effects survival rates of plants and animals
Wind speed
abiotic factor measured with anemometer which affects rate of water loss by plants, therefore survival rate
Water levels in soil
abiotic factor measured by finding mass of soil sample and heating to constant mass to find moisture
pH levels
abiotic factor measured using pH probe, most plants prefer neutral but some only acidic or alkaline
Light
abiotic factor measured using light meter and all plants need it for photosynthesis
Temperature
abiotic factor measured using thermometer which affects rate of cell reactions (photosynthesis)
living factors, much harder to measure e.g effect of predators or competitors
Competition between animals
food
water
territory
mates
Competition between plants
light
water
minerals
space
Effect of competition
effects population growth with many organisms adapting to individual environments/ competition for resources
Human effect on ecosystem
deforestation
pollution
overfishing
climate change
How human activities disrupt ecosystems
alter habitats reducing biodiversity and destabilising food webs which impact health and endanger species
Grey squirrels
much larger and was introduced from north america
now outweighs population of red squirrels
eats wider range of food and can survive in areas of mixed woodland
carries disease that is fatal to red squirrels while grey remains unaffected
struggles to obtain enough food where seeds are small
Heating to constant mass
heating in oven and weighing, repeating this until two readings are the same as water will have been evaporated
Source of energy
the sun on earth, but only about 1% efficiency to plants
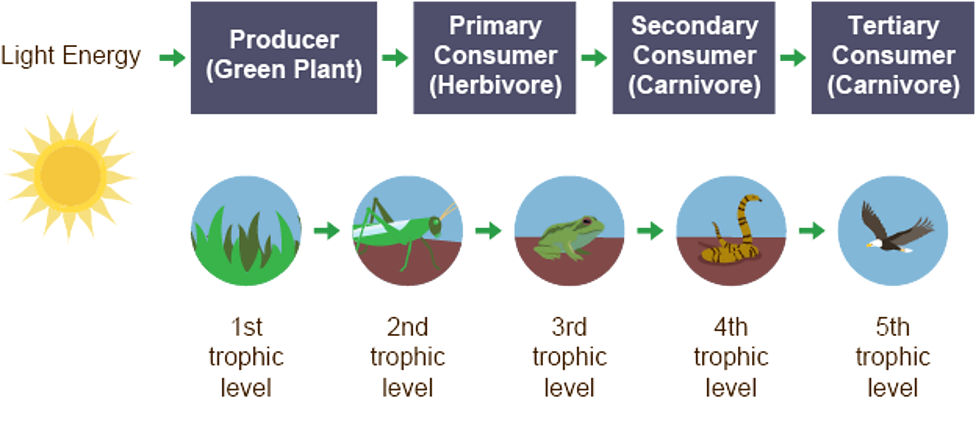
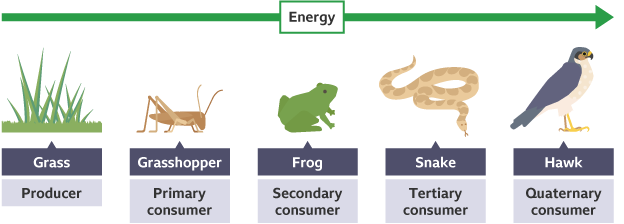
Producers
Plants that use light energy to produce sugars and starches through photosynthesis, making it available to other organisms
Animals/ consumers
Feed on plants or other animals to get energy
Herbivores
plant eating animals that are primary consumers
Carnivores
animals who eat other animals that are secondary consumers, but are eaten by tertiary consumers
Food chains
sequence to show flow of energy using arrows between each trophic level
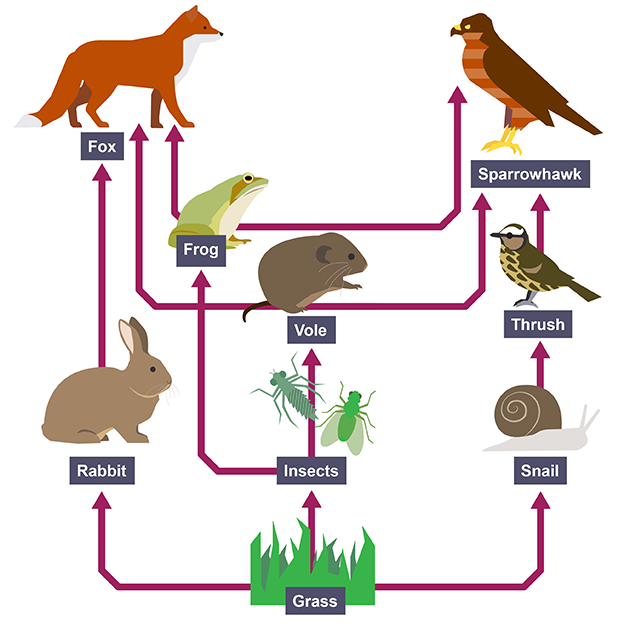
Arrows in food chains/ webs
must be included to show direction of energy flow, consumption and transfer of substances e.g carbon and nitrogen
Food webs
show interconnecting food chains of feeding relationships within a community
How energy is lost from sun to plant
light is reflected off the leaf or passes through the leaf missing chloroplasts
Ways energy is lost between trophic levels
whole organism not being eaten (skeleton/ fur left behind)
not all food digested, some passes out in excretion or egestion
lost as heat in respiration
energy used for movement, reproduction and growth
Efficiency formula
Output/ input x 100

Short food chains
more efficient as fewer trophic levels for energy to be lost through so more is available to final consumer
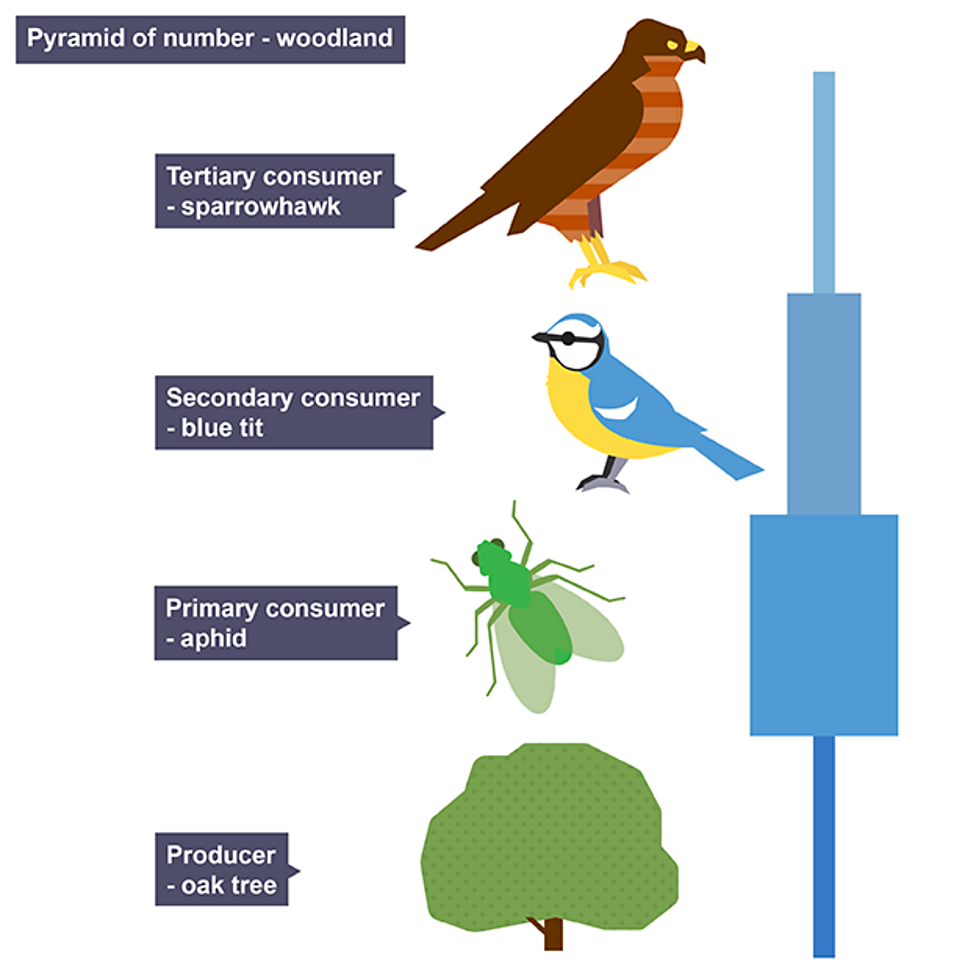
Pyramids of numbers
show the number of individual organisms at each trophic level in food chain
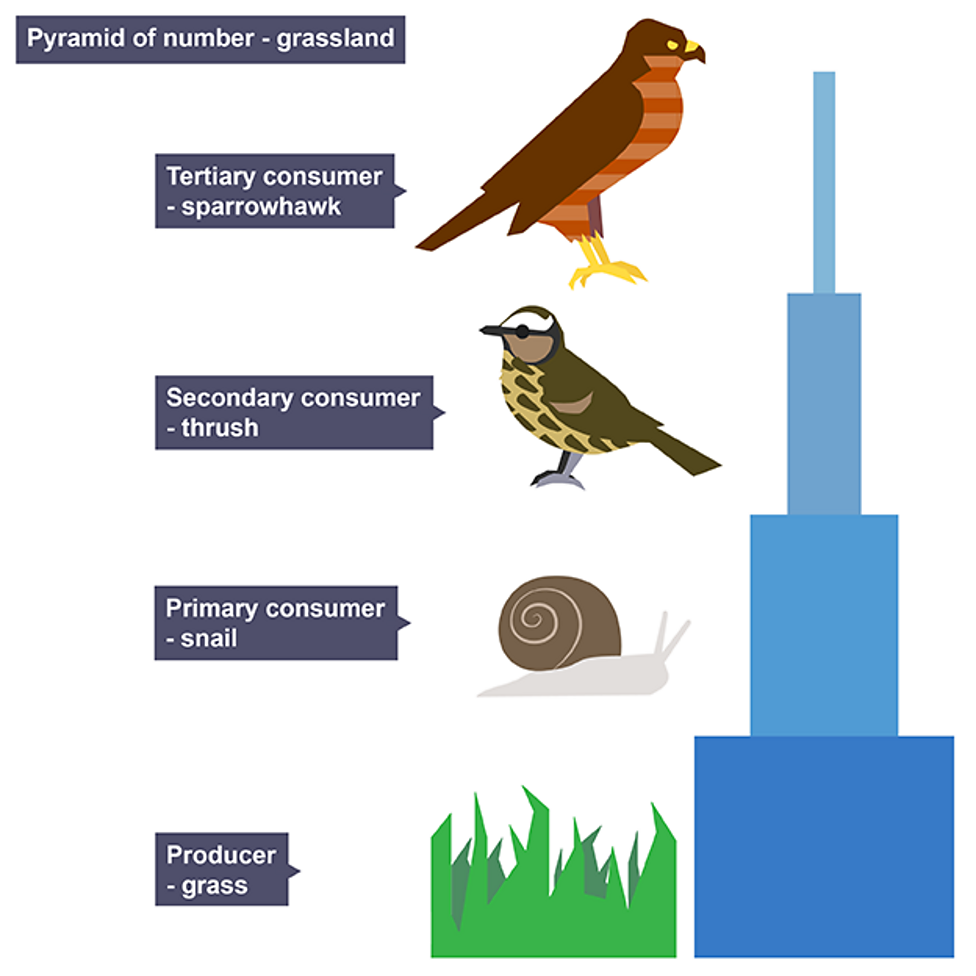
Advantages of pyramid of numbers
simple and easy to construct/ collect data
organisms do not need to be killed
Disadvantages of pyramids of numbers
may produce inverted pyramid
does not take into account size of organisms
Pyramids of biomass
show total mass of living organisms at each trophic level
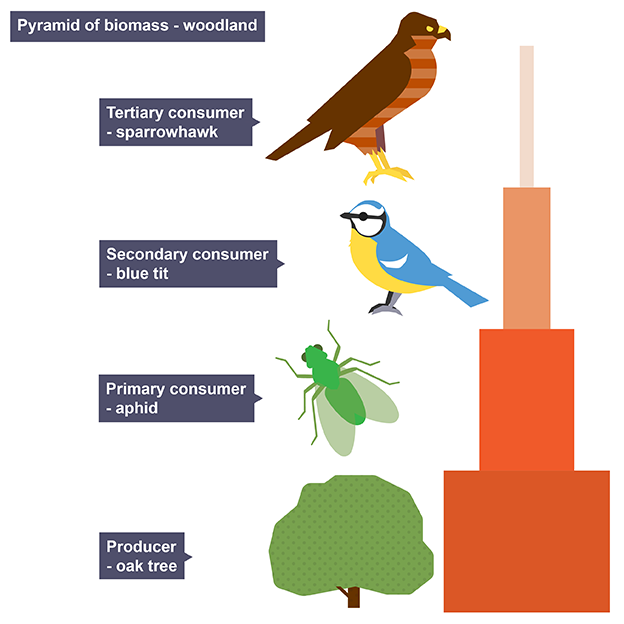
Advantages of pyramid of biomass
more accurate as takes into account size of organism
shows flow of energy between trophic levels
Disadvantages of pyramids of biomass
very difficult to collect data
requires organisms to killed to find dry mass
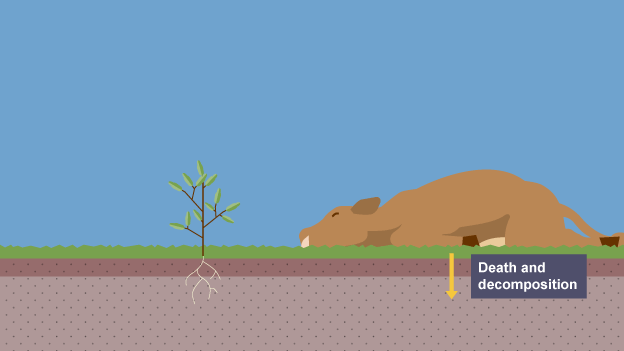
Decoposition
process where bacteria and saprophytic fungi break down dead organisms into simple compounds
Saprophytic
obtain nutrients from dead/ decaying organic matter
Steps of decompoition
bacteria/ fungi secrete enzymes out onto dead organisms.
enzymes digest organic matter outside cells (extracellular digestion)
products of digestion are absorbed by bacteria and fungi
Purpose of decomposition
returns nutrients like carbon and nitrogen to abiotic components, so plants use them, supporting biotic components
Remaining materials of decomposition
form humus which improves soil fertility by retaining water and nutrients
Optimum decomposition
temperature is warm
water is present
oxygen is available
Nutrient cycles
plants absorb inorganic nutrients like carbon dioxide and nitrates to build complex molecules which pass through food chains and return to atmosphere/ soil for reuse
Carbon cycle
exchange of carbon between living organisms (biotic) and their atmosphere (abiotic)
How carbon cycle works
carbon is constantly removed from, and returned to, the environment keeping it in balance
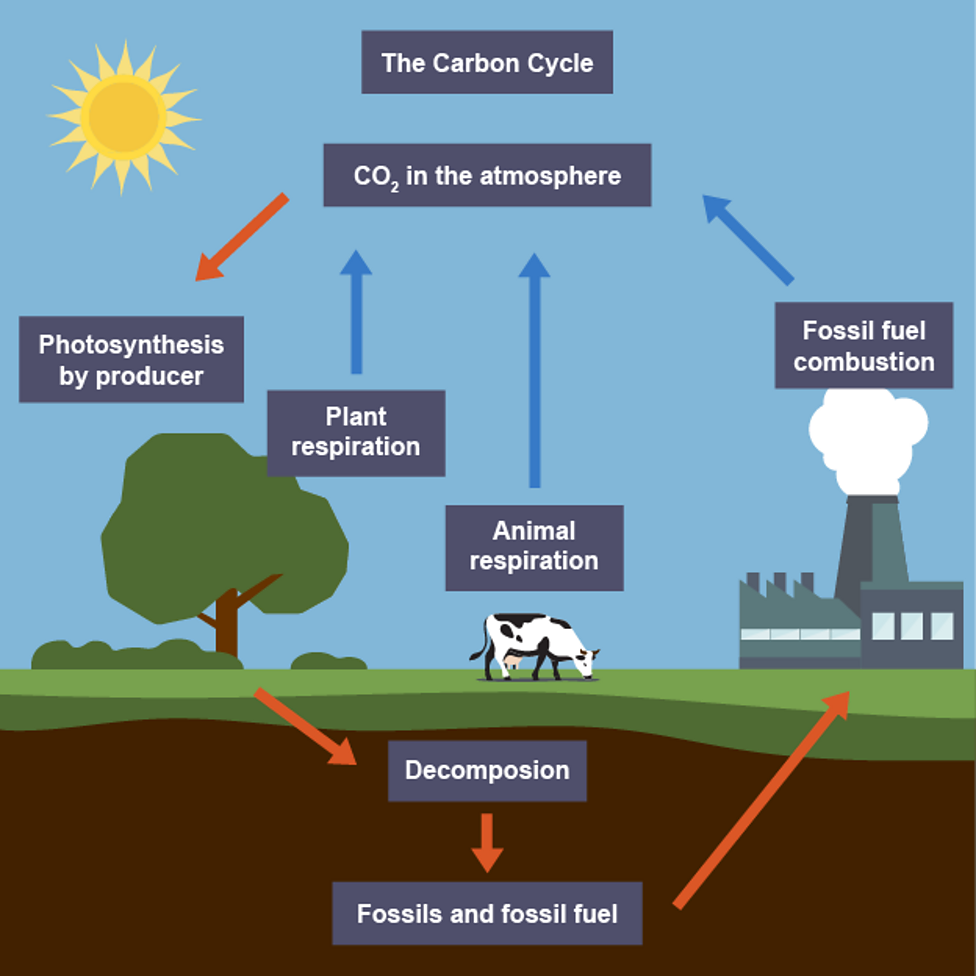
Processes involved in carbon cycle
photosynthesis
feeding
respiration
fossilisation
combustion
excretion
egestion
decomposition
Photosynthesis in carbon cycle
plants absorb carbon dioxide from atmosphere, only process reducing carbon dioxide levels in air
Feeding in carbon cycle
carbon in biological molecules move through food chain as animals eat plants and other animals
Respiration in carbon cycle
all living organisms release carbon dioxide when they respire, form of excretion
Fossilisation in carbon cycle
if conditions are not favourable for decomposition, dead organisms decay slowly or not at all, they build up if compressed over millions of years can form fossil fuels
Combustion in carbon cycle
burning fossil fuels releases stored carbon as carbon dioxide
Excretion in carbon cycle
waste materials are released by organisms and broken down by decomposers
Egestion in carbon cycle
animals remove undigested food as faeces, which are broken down by decomposers
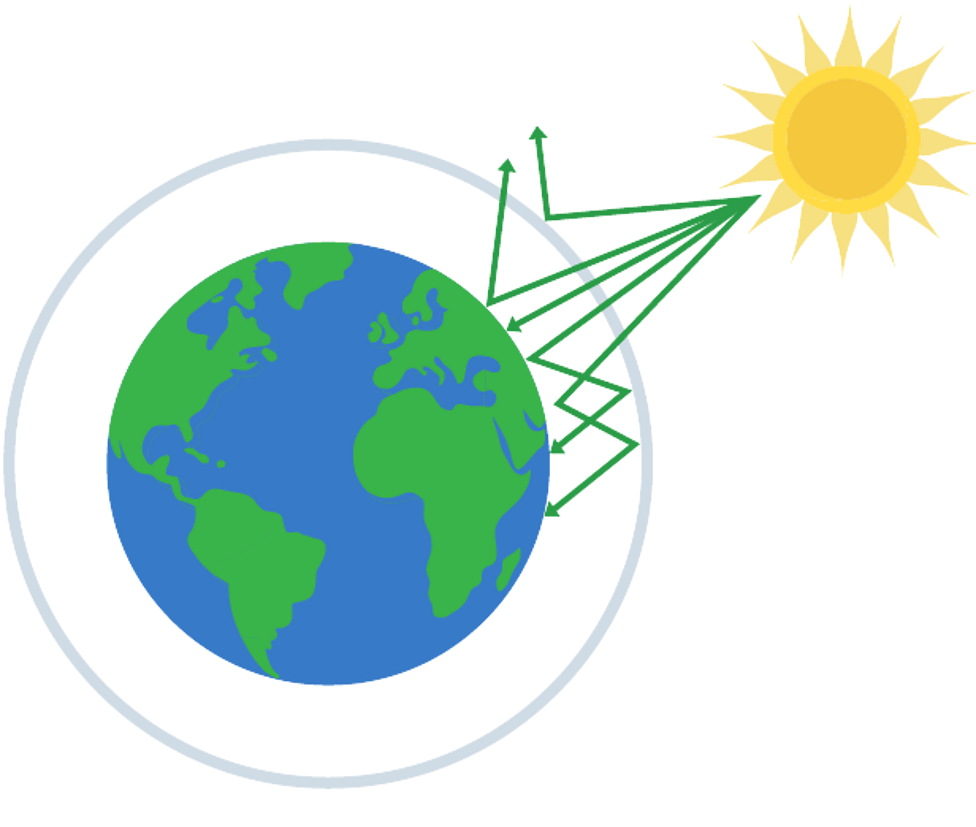
Global warming
increasing carbon dioxide levels and other greenhouse gases form blanket around atmosphere
allows heat from Sun to enter but then traps it, causing temperatures to increase
Burning more fossil fuels
releases carbon dioxide into atmosphere as product
Deforestation
reduces carbon dioxide absorption due to less photosynthesis
Effects of global warming
melting polar ice caps
rising sea levels
flooding
climate change, storms and drought
loss of habitat
How rising temperatures effects distribution of organisms
some species, like polar bears, lose habitats as ice melts
others migrate to cooler areas, changing local ecosystems
How extreme weather effects distribution of organisms
frequent storms or droughts make areas unsuitable for organisms
species move to regions with more stable conditions
How loss of habitat effects distribution of organisms
rising sea levels and flooding destroy habitats, forcing species to relocate
deforestation removes shelter and food, displacing organisms
How to reduce effects of global warming
renewable energy sources like wind and solar
public transport, cycle, or drive electric vehicles
energy-saving appliances and insulate buildings
plant trees to absorb carbon dioxide
Reforestation
planting trees restores habitats, supports wildlife and increases biodiversity
Sustainable wildlands
only few trees are cut at a time, protecting ecosystems
replacing trees and areas are left 35-30 years before harvested again, ensuring sustainability
International treaties
Kyoto (1997) and Paris (2015) set legally binding strategies to reduce CO2 levels
195 countries committed, promoting positive global change
Nitrogen
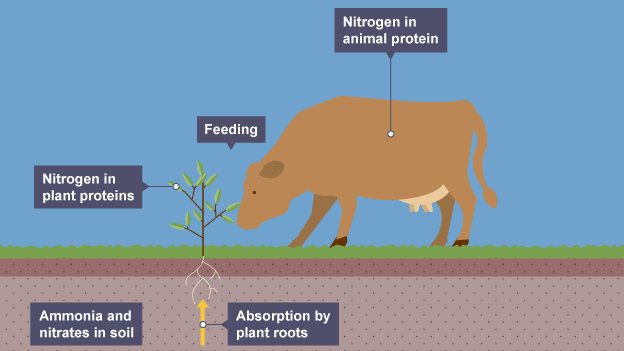
78% of earths atmosphere, essential to amino acids and proteins, but plants can only absorb it as nitrates
Root hair cells
adapted with long extension to increase surface area for absorption of water and minerals through active transport
Active transport/ uptake
uses energy to transport against concentration gradient, low concentration in soil to high concentration in cell
Conditions for active transport
requires energy from aerobic respiration, presence of oxygen
Minerals absorbed by root hair cells
nitrates for making amino acids and proteins
calcium for strengthening cell walls
magnesium for chlorophyll production
Nitrogen cycle
Nitrogen fixation
Feeding
Decomposition
Nitrification
Denitrification
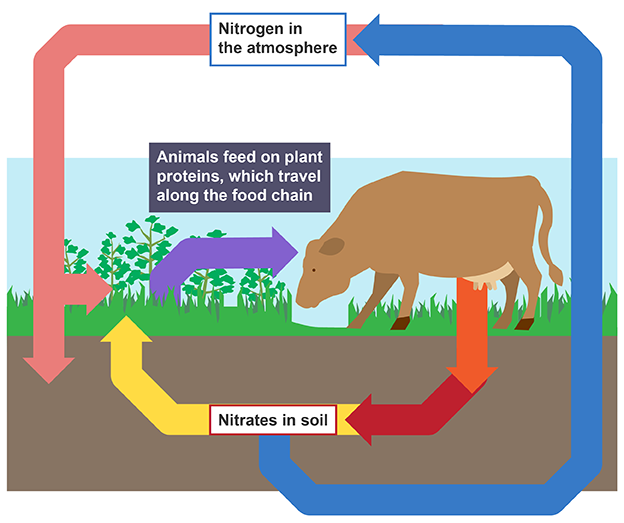
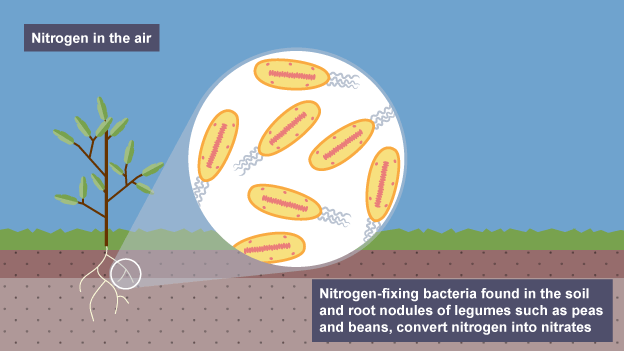
Nitrogen fixation
nitrogen fixing (aerobic) bacteria convert gas into nitrates
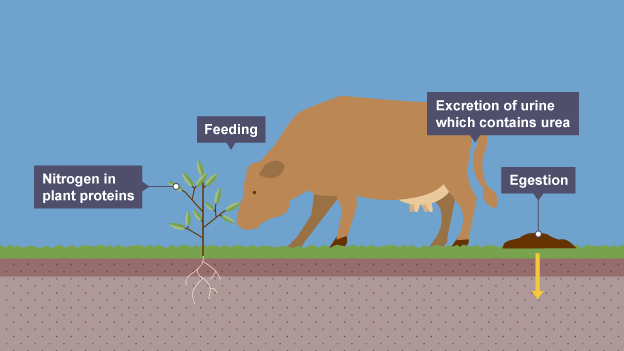
Feeding
animals feed on proteins which travel along food chain
Where are nitrogen fixing bacteria found
‘free’ in soil or nodules of legumes
Legumes
plants like peas, beans and lentils
Decomposition in nitrogen cycle
bacteria/ fungi break down protein from dead plants, animals, urine and faeces into ammonia
Nitrification
nitrifying bacteria (aerobic) convert ammonia into nitrates
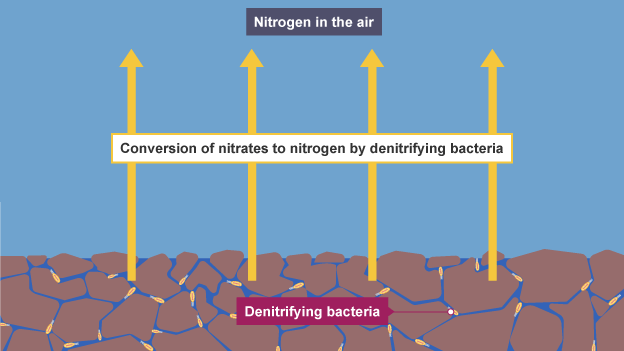
Denitrification
denitrifying bacteria (anaerobic) converts nitrates into nitrogen gas
Why denitrification is bad
reduces soil fertility/ plant growth, reduced by ploughing soil and improving drainage
Where are denitrifying bacteria found
thrive in waterlogged soil as do not need oxygen
What are fertilisers used for
replace nutrients lost when crops are harvested, containing nitrates to help crops grow
Examples of fertilisers
farmyard manure, slurry, compost or artificial fertilisers like NPK
Advantages of natural fertilisers
improves soil quality at no extra cost
nutrients released slowly
less likely to leach into waterways
Disadvantages of natural fertilisers
difficult to store and spread
composition of minerals can vary
Advantages of artificial fertilisers
easily applied to fields
easy to monitor level of minerals added (more accurate)
Disavantages of artificial fertilisers
expensive
soluble and can leach easily
If nutrients are not replaced
soil eventually loses ability to grow crops
Eutrophication
caused when sewage or fertilisers get leached into rivers and lakes

Leaching
water/ rain washes off substances and carries them away
Eutrophication process
Increase nitrate levels
Plants die
Decomposition
Oxygen Depletion
Increased nitrate levels in eutrophication
sewage disposal and fertiliser run-off increase nitrates levels and cause increased growth of aquatic plants and algae (algal bloom)
Plants dying in eutrophication
algae/ plants become overcrowded, shading each other and blocking light for photosynthesis, causing them to die
Decomposition in eutrophication
aerobic bacteria break down dead plants and algae