Lect 12 Eco
1/20
There's no tags or description
Looks like no tags are added yet.
Name | Mastery | Learn | Test | Matching | Spaced | Call with Kai |
|---|
No analytics yet
Send a link to your students to track their progress
21 Terms
Ecological footprint approach
•carrying capacity depends on amount of resources used by each person.
Ecological footprint
Total area of productive ecosystem required to support a population.
Population Size Equation
N(t+1) = N(t) + B - D + I - E
Geometric growth
•organisms reproduce in synchrony at discrete time periods.
Exponential Growth
organisms reproduce continuously over time. Pop size changes by a constant proportion.
Exponential growth equation
dN / dt = rN
Doubling time
Amount of time it will take a population to double in size
Doubling time Equation
t(d) = ln(2)/r
Density Dependent Factors Example
Resources
Population Regulation
•Density-dependent factors cause population to increase when density is low and decrease when density is high.
Life Table
•Summary of how survival and reproductive rates vary with age, size, or life stage of individuals.
What are life tables used for
to predict future population trends and develop strategies for managing populations.
Static life table
shows survival and reproduction of individuals of different ages during a single time period.
Cohort Life table
•follows the fate of a group of individuals all born at the same time (a cohort).
Age Class
•Members of a population whose ages fall within a specified range.
Age Structure
Proportion of a population in each age class; influences whether population will increase or decrease in size.
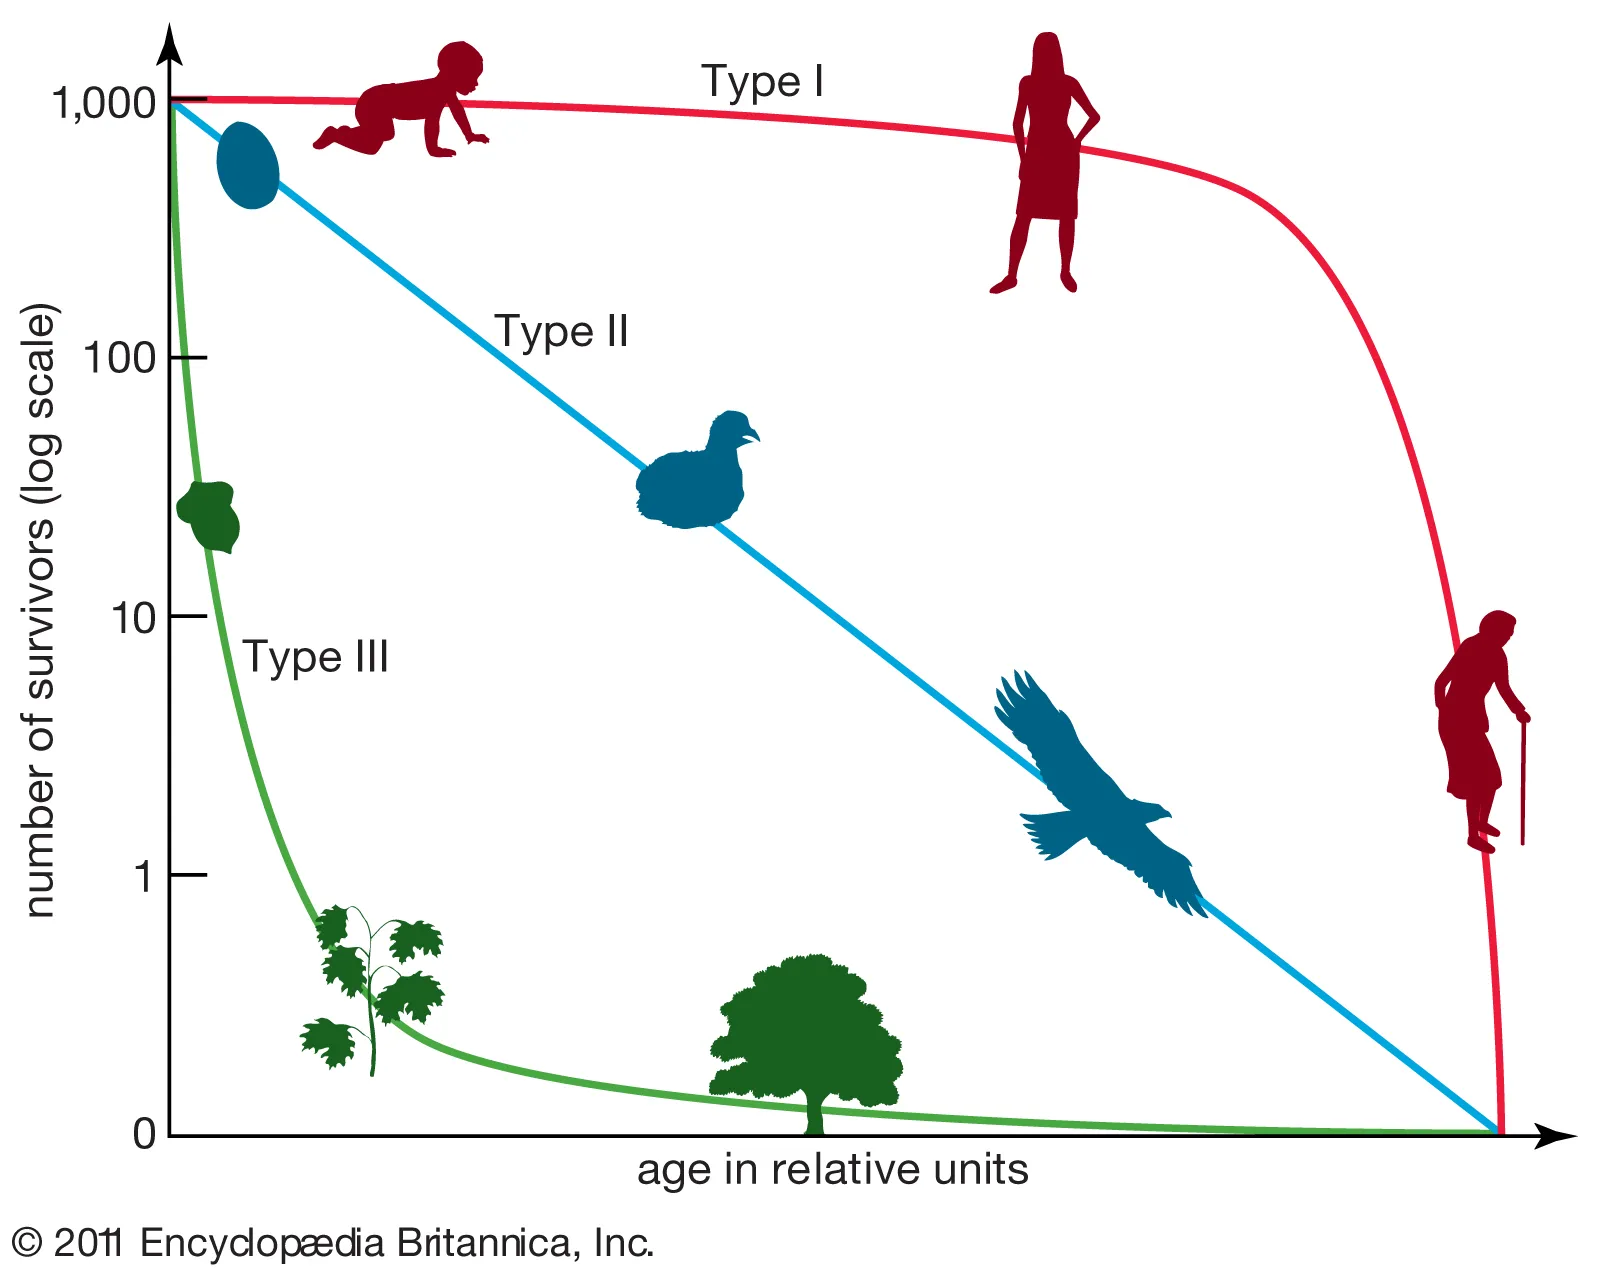
Type I Survivorship
Most individuals survive to old age.

Type II Survivorship
•Chance of surviving remains constant throughout the lifetime.

Type III Survivorship
•High death rates for young; those that reach adulthood survive well.
Net Reproductive Rate
Increases if > 1
Decreases if < 1
Remains the same if R = 1
Generation Time
The average age of parents of all offspring produced by the cohort