Lecture 14: the correlation research strategy
1/62
There's no tags or description
Looks like no tags are added yet.
Name | Mastery | Learn | Test | Matching | Spaced | Call with Kai |
|---|
No analytics yet
Send a link to your students to track their progress
63 Terms
what does correlational research want to demonstrate?
the existence of a relationship between two variables (association)
what does experimental research want to demonstrate?
a cause-and-effect relationship between two variables
what’s the difference between correlational and experimental research?
correlational: demonstrates the existence of a relationship between two variables
experiential: demonstrates a cause-and-effect relationship between two variables
if we say that we have an independent and a dependent variable, then it’s a [experimental/correlational] research
experimental
why do correlational research only have variables? (not independent or dependent)
because it wants to demonstrate the existence of a relation between the variables, not that one causes the other
using the correlational strategy, how can we describe the nature of a relationship? (2)
direction: positive, negative
strength: strong, weak
true or false: the direction and the strength of a relationship are dependent
false
true or false: data from correlational strategy is manipulated
false: it’s only measured
correlational strategy is high in [external/internal] validity and low in [external/internal] validity
high in external: variables are measured and not manipulated (which can easily be generalized to the world)
low in internal: no control for confounds, so you can’t determine if there is a cause-and-effect relationship (that’s not something the correlational strategy can do anyway)
what’s an assumption of correlational strategy?
variables are being measured at the same point in time: time when x is measured = time when y is measured
note: x and y don’t mean IV and DV because we are talking about correlational strategy
what are the graphs used for the correlational strategy? (2)
line charts and scatterplots
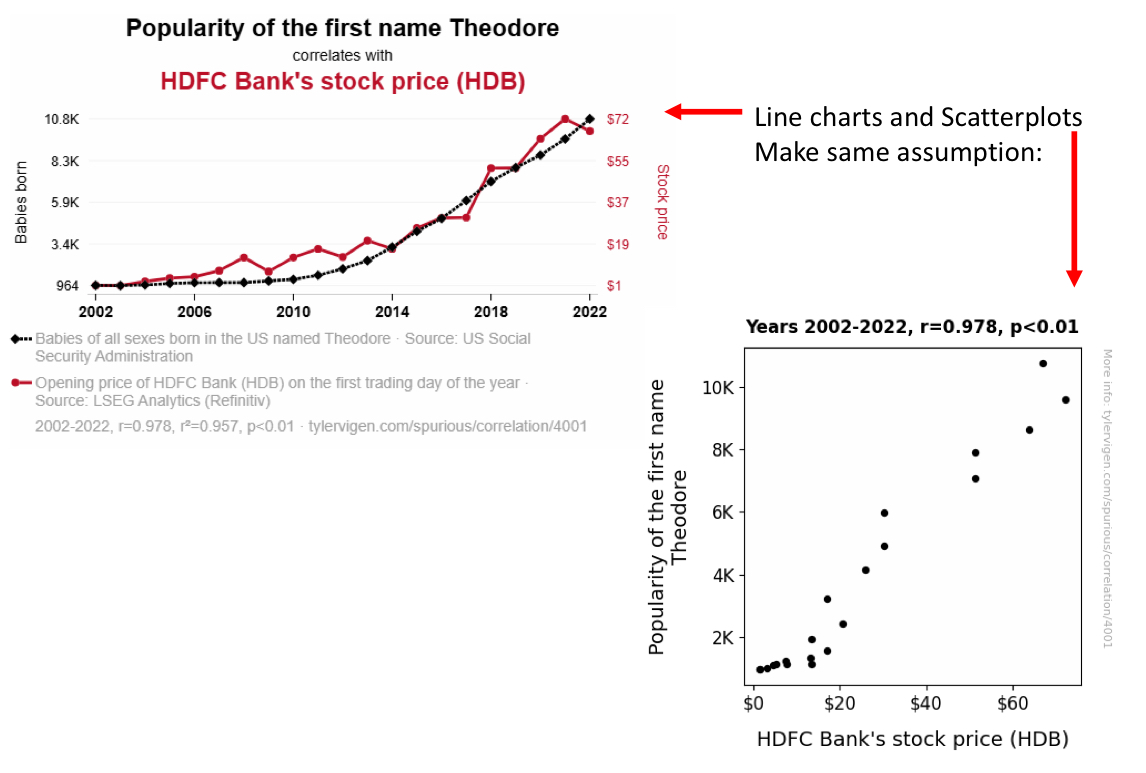
why do we confuse correlation with causation?
inferred through of logical failure: we see that things have a relationship and assume that one causes the other
true or false: according to the assumption of time measurement, person 1 (x1;y1) should be measured at the same time as person 2 (x2;y2)
false: x1 and y1 should be measured at the same time, but not necessarily at the same time as x2 and y2
note: x and y don’t mean IV and DV, just variables because we are talking about correlation
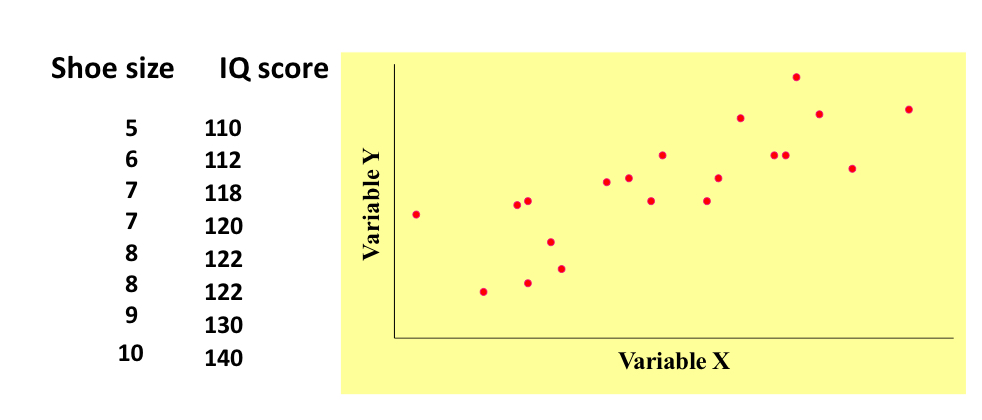
what do the points on a scatterplot represent?
they each represent a person/item that has been sampled once
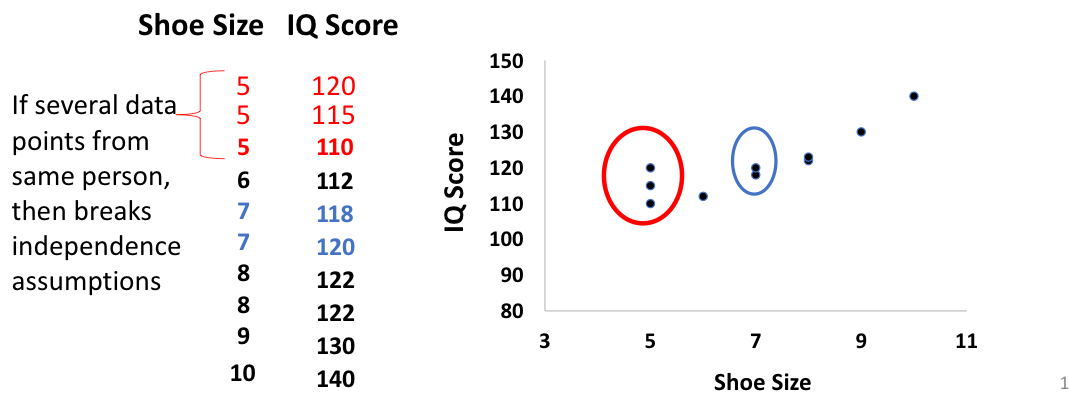
what’s the assumption when using scatterplots and explain it
each point is independent from other points (no points that come from the same person/item)
if we had the same person multiple times, they might cause variance on one dimension more than the other
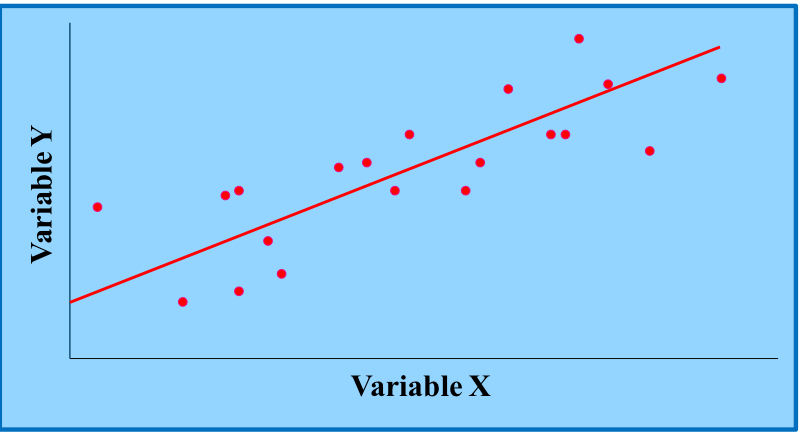
what are the purposes of the regression line drawn on a scatterplot? (2)
points that are closer to the line have more association between variables
tells you the direction of the relation (positive, negative)
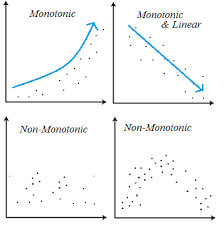
what do we want to know for both Spearman and Pearson correlation? (3)
form (linear, non-linear)
direction (+ or -)
strength (between 0 and 1)
when do we use Spearman rho (rs)?
when one or two variables being correlated are ordinal
when do we use Pearson r?
when the two variables are on a ratio or interval scale
we use [Pearson r/Spearman rho] when one or two variables are ordinal, but we use [Pearson r/Spearman rho] when both variables are on a ratio or interval scale
we use Spearman rho when one or two variables are ordinal, but we use Pearson r when both variables are on a ratio or interval scale
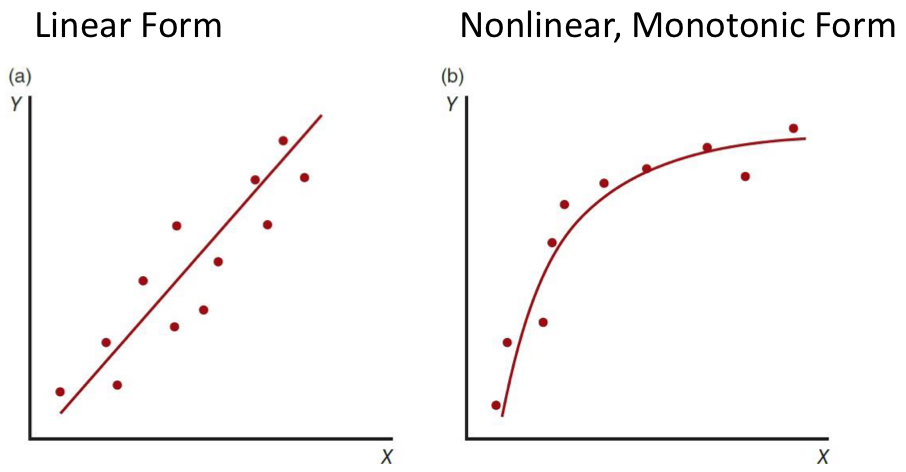
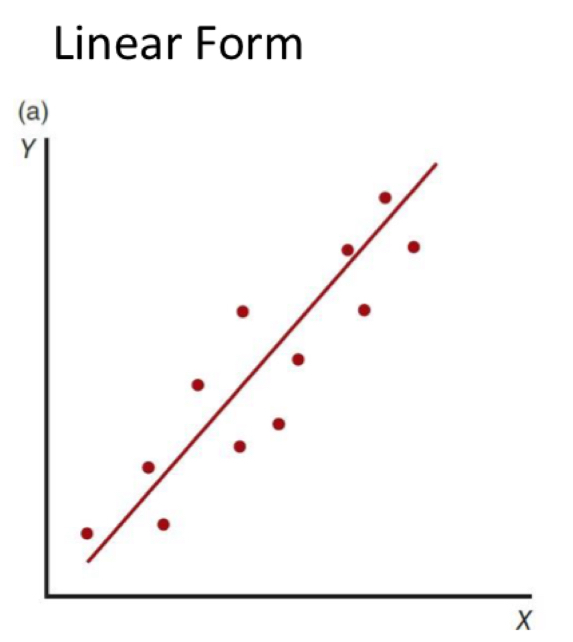
what’s the difference between a linear and a nonlinear correlation?
linear: straight line
change in one variable is consistent with change in other variable
data is clustered around a straight line (straight line)
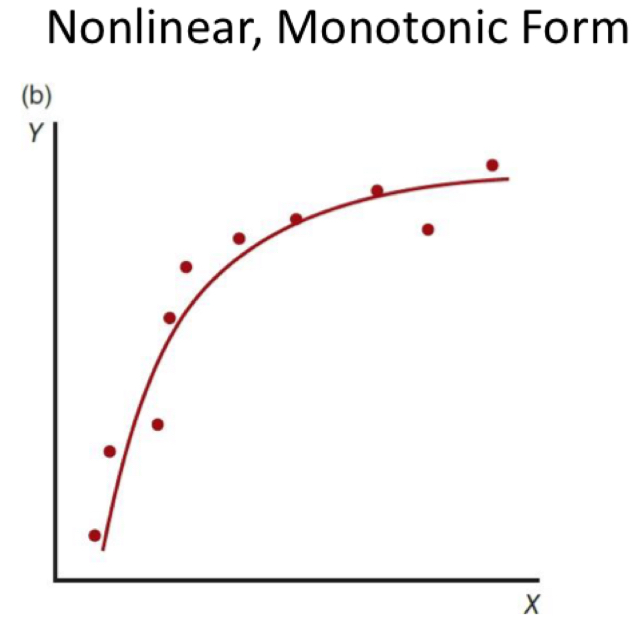
nonlinear: monoatomic (not straight line)
change in one variable is not consistent with change in other variable
one variable is changing in one direction while the other stays the same

when use Pearson r when we have a [linear/nonlinear] correlation and Spearman rho when we have a [linear/nonlinear] correlation
Pearson = linear (change is constant)
Spearman = nonlinear/monotonic (change isn’t constant)
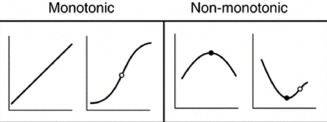
define “monotonic relationship”
when two variables stay in the same direction, no matter the speed
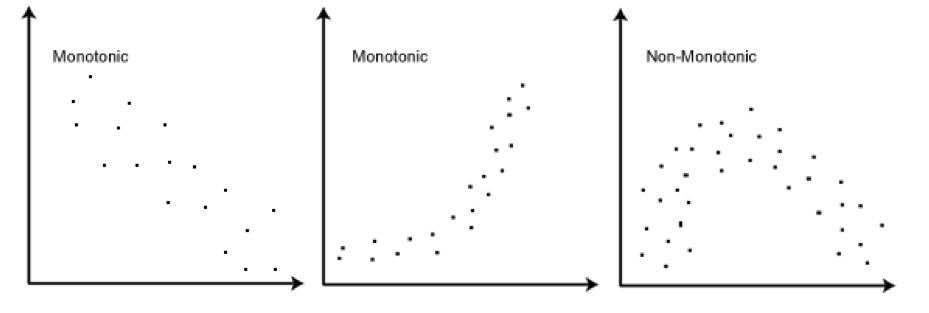
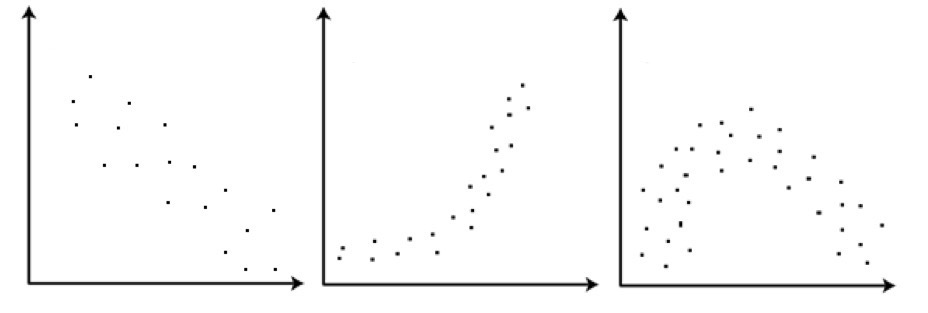
indicate if the graph is monotonic or not

define “spearman’s correlation” (also called “Spearman’s rank-order’s correlation)
determining the strength and direction of the monotonic relationship between two variables
true or false: we can use Spearman’s rho if the data is non-monotonic, but not Pearson
false: both require monotonic data
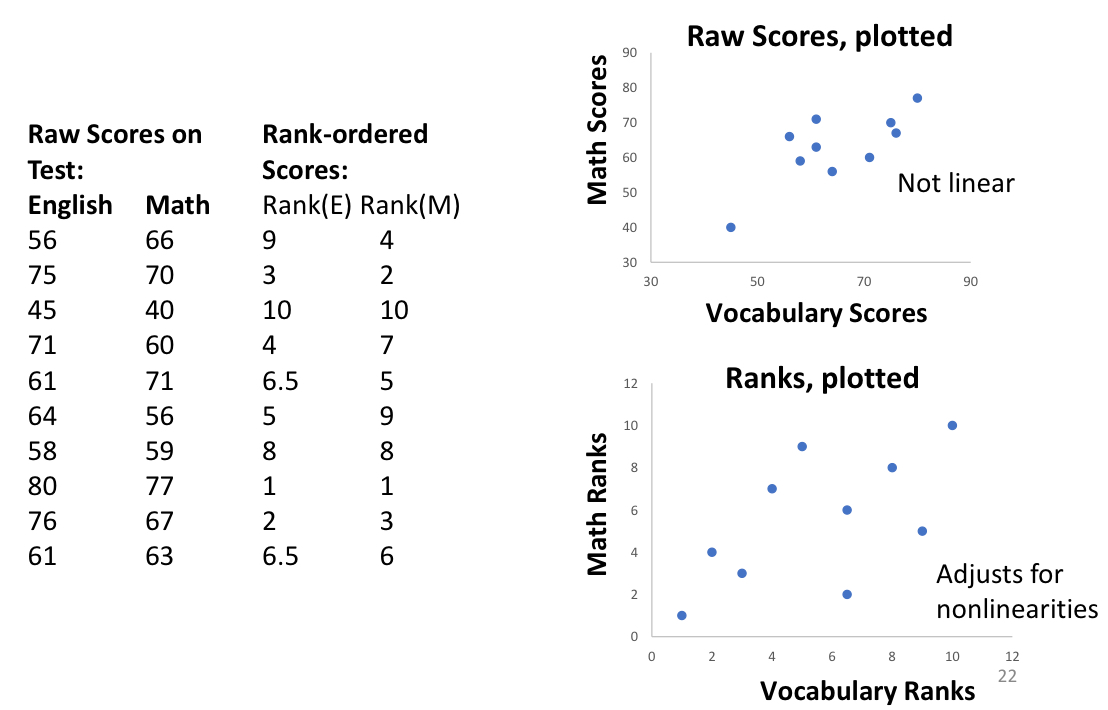
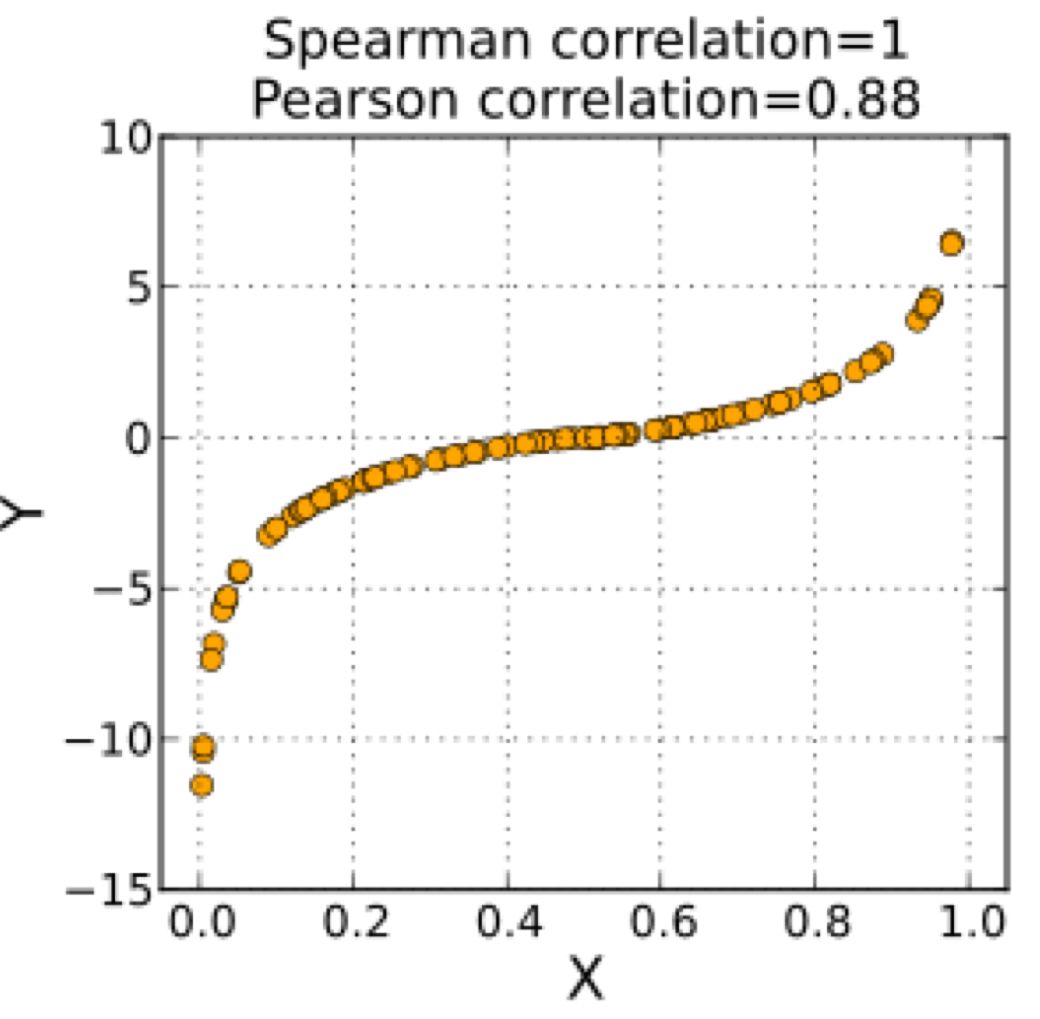
explain how we compute the Spearman correlation and what caused the difference between the graphs
we ranked the scores from largest to smallest (could have done from smallest to largest too)
instead of comparing the raw data (top graph), we compare the rank (bottom graph)
top graph isn’t linear: there is an outlier and a bow shape, wouldn’t work for Pearson
bottom graph doesn’t have an outlier anymore because we care about the rank and no the distance between points
→ Spearman adjusts nonlinear data
how many pairs of data should you have to use Spearman’s rank-order correlation?
when you have at least 5 pairs of data, but preferably over 8
how can the rank-order Spearman’s correlation be not meaningful? (2)
if you have too few pairs
if you have too many tied ranks (points that are close)
when r is a positive value, x and y move in [the same/different] direction(s)
when r is a negative value, x and y move in [the same/different] direction(s)
positive: same direction
negative: different
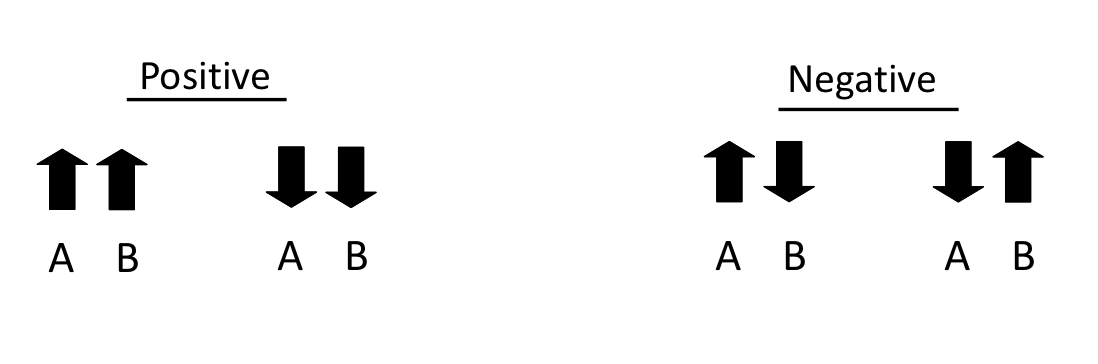
what does the direction of a correlation indicate?
the nature of the change in the variables (positive or negative correlation)
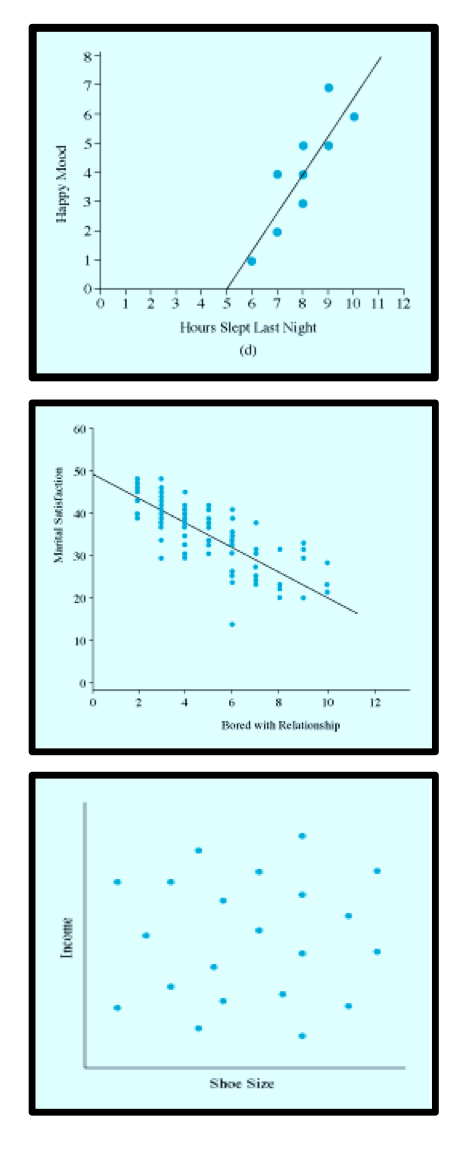
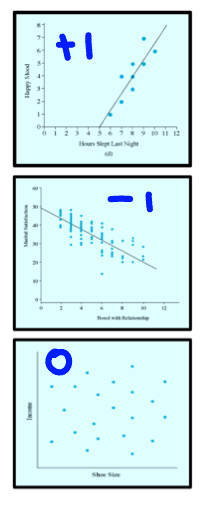
associate the description and graph to the right type of correlation:
zero correlation
negative linear correlation (-1)
positive linear correlation (+1)
high scores on one variable matched by high scores on another
high scores on one variable matched by low scores on another
variables are uncorrelated
line slants down to the right
no straight line
line stand up to the right
positive linear correlation (+1)
high scores on one variable marched by high scores on another
line stand up to the right
negative linear correlation (-1)
high scores on one variable marched by low scores on another
line slants down to the right
zero correlation
no straight line
two variables are uncorrelated
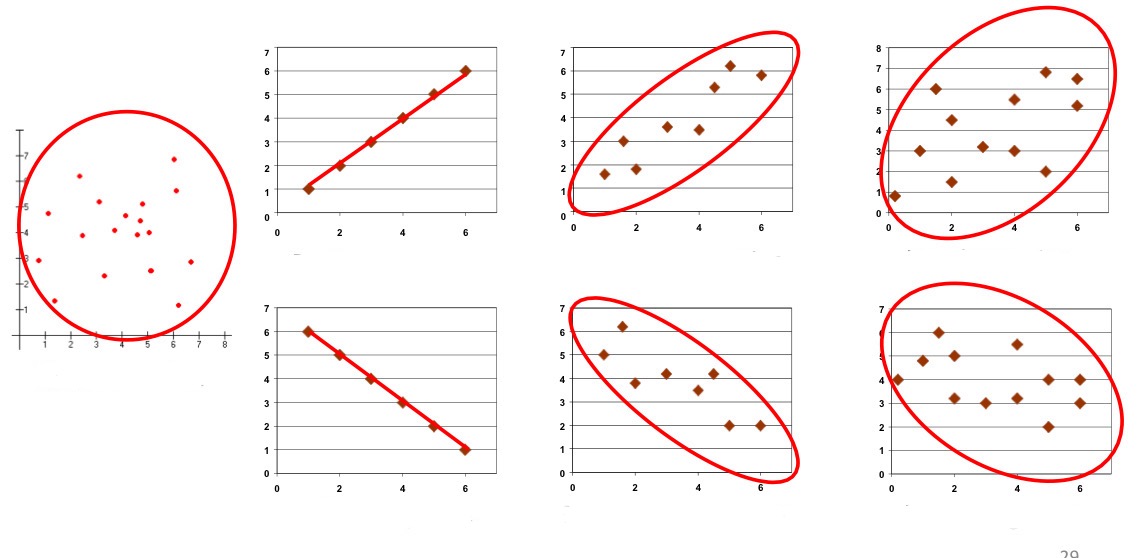
identify the direction (positive or negative) and the strength (perfect, moderate or weak) of each graph
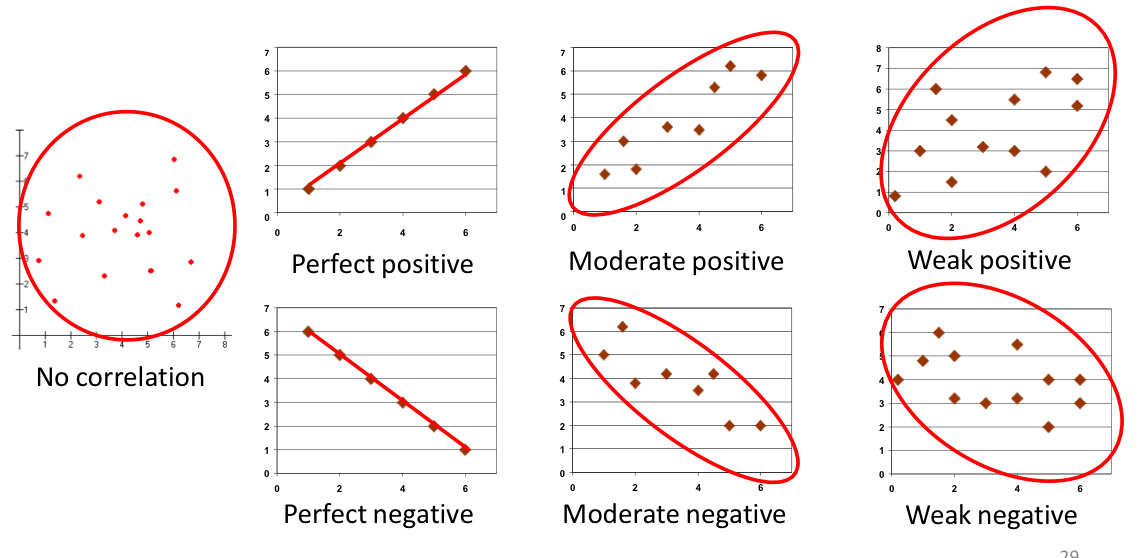
define “Pearson r” (purpose, assumption, calculation method, range, interpretation, outliers, type of data)
purpose: measures linear relationship (scores are clustered around a straight line)
assumption: variables are normally distributed, linear relationship
calculation: covariance, standard deviation
range: -1 to 1
interpretation: strength and direction of the linear relationship
outliers: sensitive
data type: interval or ratio
define “Spearman rho” (purpose, assumption, calculation method, range, interpretation, outliers, type of data)
purpose: measures monotonic relationships
assumption: variables have monotonic relationship, no assumption on distribution
calculation: based on ranked data
range: -1 to 1
interpretation: strength and direction of monotonic relationship
outliers: less sensitive
data type: ordinal or non-normally distributed
what does “consistency” or “degree of association” mean?
strength of the correlation
associate the degree of relationship to the correct values of the correlation coefficient
strong relationship
weak relationship
moderate relationship
no relationship
r = -0.10 to 0.10
r = ±0.30 to ±0.70
r = ±0.10 to ±0.30
r = ±0.70 to ±1.00
No relationship: r = -0.10 to 0.10
Weak relationship: r = ±0.10 to ±0.30
Moderate relationship: r = ±0.30 to ±0.70
Strong relationship: r = ±0.70 to ±1.00
true or false: you cannot get a Spearman correlation of 1
false: you can if the two variables are monotonically related, even though they aren’t linear
true or false: we can only use Pearson coefficient for non monotonic relationships
false: we can’t use Spearman or Pearson
Spearman, Pearson or both: which relies on monotonicty
both
Spearman, Pearson or both: which relies on linear relationship
Pearson
Spearman, Pearson or both: which is robust to outliers
spearman
Spearman, Pearson or both: for which does -1 mean perfect disagreement between the variables
both
when looking at a graph, how can we determine the strength of the correlation?
by the tightness: how spread the data is around the line
define “outlier”
data point that differs significantly from others on X or Y or both
how many standards deviations should a point have to be considered as an outlier?
2-3
why is the Spearman correlation less sensitive to outliers than the Pearson correlation?
because Spearman’s rho uses ranks and you can’t have outliers in a rank
why doesn’t “prediction” mean “causal”?
because it can mean that x causes y, but also that y causes x: same correlation, not causality
define “statistical significance”
the relationship is unlikely to be the result of chance
what the the probability/alpha of < 0.05 mean?
there is a 5% chance that we got those results out of chance
what happens to the statical significance when n increases?
more chances that the relationship exist
![<p>to be significant, r should be equal or [smaller/larger] to the corresponding value in the table</p>](https://knowt-user-attachments.s3.amazonaws.com/b2aaf4c5-a990-48a9-9a20-ba84d3ea7bc1.jpg)
to be significant, r should be equal or [smaller/larger] to the corresponding value in the table
larger
what is statistical significance related to? (4)
p-value
n
df
size of correlation
define “practical significance”
meaningful real world consequence of the observed correlation
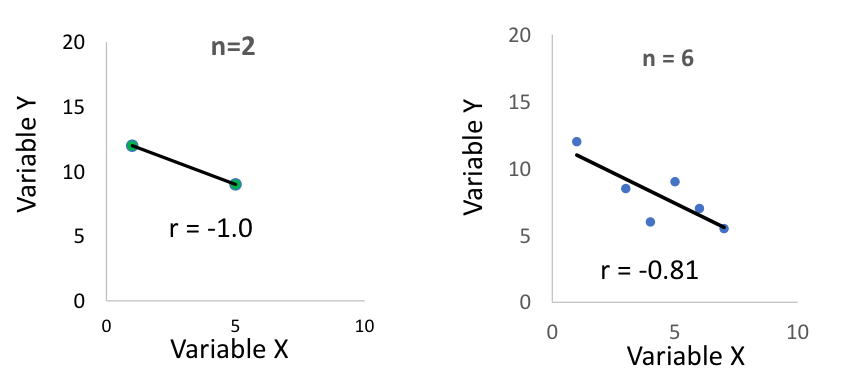
why do you obtain stronger correlations with smaller samples?
if you have a sample size of two, then the correlation will always be of ±1 (because the line will touch both points)
as the sample size increase, r will go down because there is more variability
when measuring the correlation, we should take into account the sample size because of [internal/external] validity
external
define “coefficient of determination” (r²)
shared variance: percentage of changes in one variable (x) that account for the changes in the other variable (y)
true or false: correlational values are ordinal
true: r doesn’t increase in equal increments (ex: r = 0.80 isn’t twice as strong as r = 0.40)
*r value is ordinal but that data used to compute the r is ratio or interval scaled
true or false: we can find out r by using r²
false: you can find r² by using r but not the opposite (unless you know the directionality…)
ex: r = 0.9 → r² = 0.81
r² = 0.81 → \sqrt{r^2} = r = ±0.9
associate the degree of relationship to the correct values of the coefficient of determination (and the correlational coefficient)
medium
large
small
r ≤ 0.10 or ≥ -0.10; r² = 0.01 (1%)
r ≥ 0.30 or ≤ -0.30; r² = 0.09 (9%)
r ≥ 0.70 or ≤ -0.70; r² = 0.49 (49%)
small: r ≤ 0.10 or ≥ -0.10; r² = 0.01 (1%)
medium: r ≥ 0.30 or ≤ -0.30; r² = 0.09 (9%)
large: r ≥ 0.70 or ≤ -0.70; r² = 0.49 (49%)
what are the advantages of correlational methods? (3)
quick and efficient to study relationships between variables
often only method available
high external validity
what are the limitations of correlational methods? (4)
doesn’t tell us why two variables are related
low internal validity/third variable problem
sensitive to outliers
directionality problem
what’s the difference between a predictor variable and a criterion variable? when are they used?
predictor: variable that helps predict or explain criterion variable
criterion: variable being explained
used when we try to demonstrate a relationship between two variables