Lecture 19 Dynamic Biogeography
1/16
There's no tags or description
Looks like no tags are added yet.
Name | Mastery | Learn | Test | Matching | Spaced | Call with Kai |
|---|
No analytics yet
Send a link to your students to track their progress
17 Terms
Species Patterns (3)
Historical factors determine regional pool of species
evolution, climate change, catastrophes like asteroid impact
Abiotic factors govern distribution and abundance within the region
time from origin, pH, rainfall, site fertility, disturbance, distance from regional species pool (e.g. island biogeography)
Biotic factors further govern distribution and abundance within the community
dispersal, species interaction, community structure
Changes in species patterns
historical processes affecting present patterns
e.g. Pleistocene biogeographic dynamics
future patterns: the possible impacts of change during 21stC
impacts of climate change
human impacts
Pleistocene and Holocene (9)
the past two million years -> but what came before?
tectonic movements affecting climate, ocean currents, marine and land life, biotic interactions
completely different land distributions in past geological ages
glacial-interglacial cycles
movement of entire climatic zones during past periods
climatic combinations without contemporary analogues
massive temperature differences from Pleistocene LGM far from glacial edges
little tectonic movement between periods but significant climatic change
regionally variable effects
jet stream moves
shifting of climate patterns, potentially warmer in some areas
temperature but also aridity, etc.
sea level change
Glacial-interglacial cycles
interglacial periods have made up 10% of the past 2 million years
glacial periods cooler, wetter in North America, drier in Europe and the tropics e.g.
Impacts of sea level change
land bridges, marine channels
effects on dispersal, speciation, community structure
Wallace Line between South East Asia and Oceania
first noticed by Venetian explorer Pigafetta
total amplitude of over 230m during Pleistocene possible
Biogeographic dynamics in the Pleistocene
Environment
location, extent, configuration of habitat
changes in nature of climatic zones
formation and dissolution of dispersal routes
Biotic responses
move
remain: tolerate or adapt
reduction in range, eventual extinction (why, if population not completely lost in sudden events? viable size tipping point)
Postglacial biogeographical dynamics (4)
disjunct species distributions
shifts can vary
mountains, rivers, etc
European mountain ranges largely run east-west, blocking north-south migrations
North American forest types
expansions/reduction of forest and tundra long Mississippi river during ‘Wisconsin’ glacial period
mountains
shifts of biomes higher up mountains
cooling -> reduced area, extinctions
warming -> increased dispersal
What responds to biogeographic shifts (6)
communities, species, or individuals
dependent on physiology, behaviour, life history, reproductive capacity, etc.
combination of species and individuals
differences within and among species
northward expansion of white spruce (Picea glauca), faster dispersal in west because of north-flowing winds
individualistic species expansions and contractions, non-analogue communities as well as non-analogue climate/soil combinations
composition and abundance of biomes varies over time
glacial-interglacials led to a series of individualistic responses in animals and plants, creating and breaking up ecological relationships
reshuffling of communities, influence of refugia
reaching an ‘equilibrium’?
Human Influences
domestication of plants and animals, land use change
extinction, especially of animas
plants: many extinctions 5-0.7 million ybp
animals: many large-scale extinctions after LGM, e.g. mega-fauna
climate change or human-driven
Predicting responses to 21st Century change
models of vegetation growth (photosynthesis and respiration)
use carbon as the currency for success or failure
differential success
climate
build models from the bottom up
process based not pattern based
Predicted rates of change from IPCC
boreal zone shifting northward: 5km/year, loss or gain in total area
temperature zone shifting northward: 5km/year, overall gain in area
topical mountains shifting upwards: 2-5m/year, overall loss in area
rates of migration larger than Pleistocene changes
50-3000m/year
not completely analogue to Pleistocene shifts
scenarios of initial losses of biodiversity as species
differentially migrate, some with more longevity than others
migrate through fragmented (e.g agricultural) landscapes
Modelling the present and future carbon cycle (4+4)
Approaches
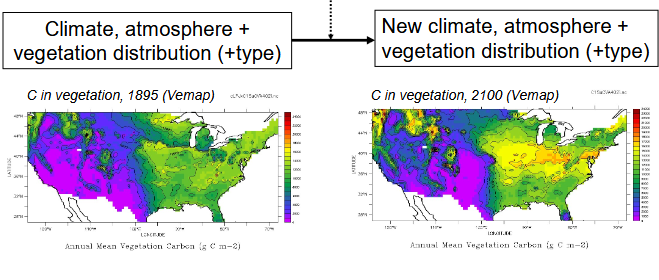
Equilibrium climate and biogeographic vegetation models (IPCC 1995: VEMAP group)
Specified climate and dynamic vegetation (IPCC 2001)
Fully coupled dynamic climate and vegetation models (IPCC 2001)
DGVMs that include NBP(net bioproductivity) estimate (e.g. fire frequency) and land use change
Static ‘equilibrium’ biogeographic models
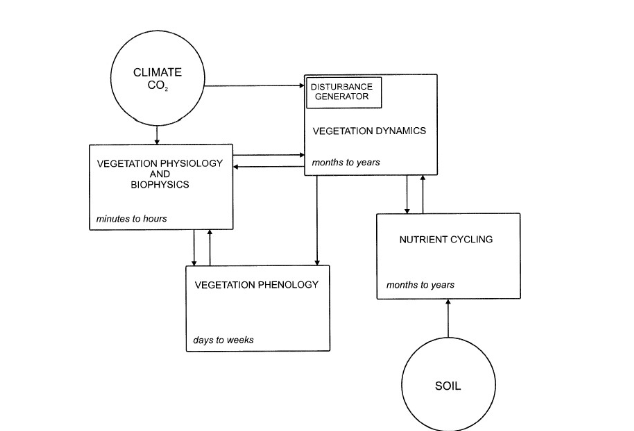
Generic dynamic global vegetation model
models that include land surface/carbon cycle have very different results
‘Intermediate’ biogeographic models
Static ‘equilibrium’ biogeographic models (3)
assuming no secondary (ie. regrowth) vegetation
Climate, atmosphere and vegetation distribution/type -> new climate, atmosphere and vegetation distribution/type
no transition, no dynamic responses (e.g. to CO2, water use)
Generic DGVM (2)
have equations at their root
e.g. stomatal variation affects evaporation, temperature
GCMs and DGVMs interactively (4)
running GCM and DGVM interactively, temperatures 2-3C higher than standard scenario with carbon cycle involved
responses in soil/vegetation and surface-climate interactions
uncertainty in DGVM and climate model
recent analysis showing need to improve veg and climate models, Cox et al 2000, Huntingford et al 2013
Intermediate Biogeographic Models (4)
include idea of migration requirements
models on local levels
estimate species richness changes on basis of changes in area
assumptions of niche requirements
Vulnerability, dynamic change, and recovery
bistable and multistable systems -> tipping points
non-linear change past a threshold
recovery to original state maybe not possible, even if wider climate recovers
Maslin 2004 % tree cover compared to dry season length