International Trade HM 1
1/49
There's no tags or description
Looks like no tags are added yet.
Name | Mastery | Learn | Test | Matching | Spaced | Call with Kai |
|---|
No analytics yet
Send a link to your students to track their progress
50 Terms
Countries that import more than they export run a
Trade deficit
Chapter 1: Nokia Corporation, a Finnish company, produces smartphones. When exported, the value of one of these phones is $250. A typical assembly line worker in Finland is paid $20 for every phone she assembles. The manufacturer imports each phone's components from East Asia and North America. The total value of these components per phone imported from East Asia is $100, and from North America is $110. What is the value added in Finland phone production?
40
Chapter 1: The largest amount of trade is within which of the following region?
Europe
Chapter 1: Why do countries with a smaller ratio of trade to GDP tend to have large sizes?
Large countries tend to have a lot of trade within their borders.
Chapter 1: If China's value of exports is $4 Trillion, the value of its imports is $6 Trillion, and its GDP is $20 Trillion, then its trade-to-GDP ratio is
25%
Chapter 1: During the interwar period, the following policy by the United States caused other countries to retaliate, leading to higher global protectionism.
Smoot-Hawley Act
Chapter 1: From 1925 to 2018 the structure of U.S. international trade was transformed from
primarily agricultural goods and raw materials to mainly capital and consumer goods.
Chapter 1: In the past 20 years, most of the global foreign investment occurred
within advanced countries.
Chapter 1: The majority of immigrants to Europe come from
Other European countries
Chapter 1: Immigration restrictions against immigrants coming from low-wage countries are offset to some degree by
the ability of low-wage countries to export products to high-wage countries.
Chapter 2: One reason for why Canada is the United States' largest trading partner is
Geographic proximity
Chapter 2: Suppose that in Singapore, one worker can produce 5 basketballs or 3 footballs. If Singapore has a workforce of 50 workers, it can produce
50 basketballs and 120 footballs.
Chapter 2: In a Ricardian economy producing two goods, X and Y, the "no-trade" (autarkic) equilibrium is characterized by the following feature:
the opportunity cost of good X equals the relative price of good X.
Chapter 2: Time series evidence from the United States, France, and Japan indicates that the __________movement in labor productivity is matched by the __________movement in real wages.
Upward; upward
Chapter 2: Germany is famous for its luxury cars. Which of the following concepts shows the range of consumption possibilities that Germany can achieve by specializing in luxury cars and engaging in international trade?
The world price line.
Chapter 2: Economists Raul Prebisch and Hans Singer argued that
The price of primary commodities would decline over time relative to the price of manufactured goods.
Chapter 2: A Ricardian economy has 10 workers, each of whom can produce 10 bottles of wine or 20 yards of cloth. The relative price of wine under no trade is
2 yards of cloth
Chapter 2: _______________advantage explains why most trade occurs.
Comparative
Chapter 2: Under no trade, if the relative price of cloth (in terms of wheat) in Foreign is Pc / Pw =1 whereas cloth's relative price in Home is Pc / Pw =2, what trade pattern would you expect?
Foreign will export cloth
Chapter 2: A rise in a country's terms of trade makes it ____________because its exports are more expensive or its imports are cheaper.
Better off
Chapter 2: Canada and the United States produce hockey sticks and footballs. In Canada, it takes 1 hour of labor to produce 3 hockey sticks and 3 hours of labor to produce 9 footballs. In the United States, it takes 2 hours of labor to make 1 hockey stick and 2 hours of labor to produce 8 footballs. Which country has an absolute advantage in the production of footballs?
US
Chapter 2: Canada and the United States produce hockey sticks and footballs. In Canada, it takes 1 hour of labor to produce 3 hockey sticks and 3 hours of labor to produce 9 footballs. In the United States, it takes 2 hours of labor to produce 1 hockey stick and 2 hours of labor to produce 8 footballs. Which country has absolute advantage in the production of hockey sticks.
Canada
Chapter 2: Canada and the United States produce hockey sticks and footballs. In Canada, it takes 1 hour of labor to produce 3 hockey sticks and 3 hours of labor to produce 9 footballs. In the United States, it takes 2 hours of labor to produce 4 hockey sticks and 1 hour of labor to produce 2 footballs. Which country has a comparative advantage in the production of hockey sticks?
Neither
Chapter 2: Canada and the United States produce hockey sticks and footballs. In Canada, it takes 1 hour of labor to produce 3 hockey sticks and 3 hours of labor to produce 9 footballs. In the United States, it takes 2 hours of labor to produce 1 hockey stick and 2 hours of labor to produce 8 footballs. Which country will export footballs?
US
Chapter 2: Canada and the United States produce hockey sticks and footballs. In Canada, it takes 1 hour of labor to produce 3 hockey sticks and 3 hours of labor to produce 9 footballs. In the United States, it takes 2 hours of labor to produce 4 hockey sticks and 1 hour of labor to produce 2 footballs. Which country will enjoy higher wages under free trade?
Canada
Chapter 2: According to the following figure, the autarky equilibrium is determined by point
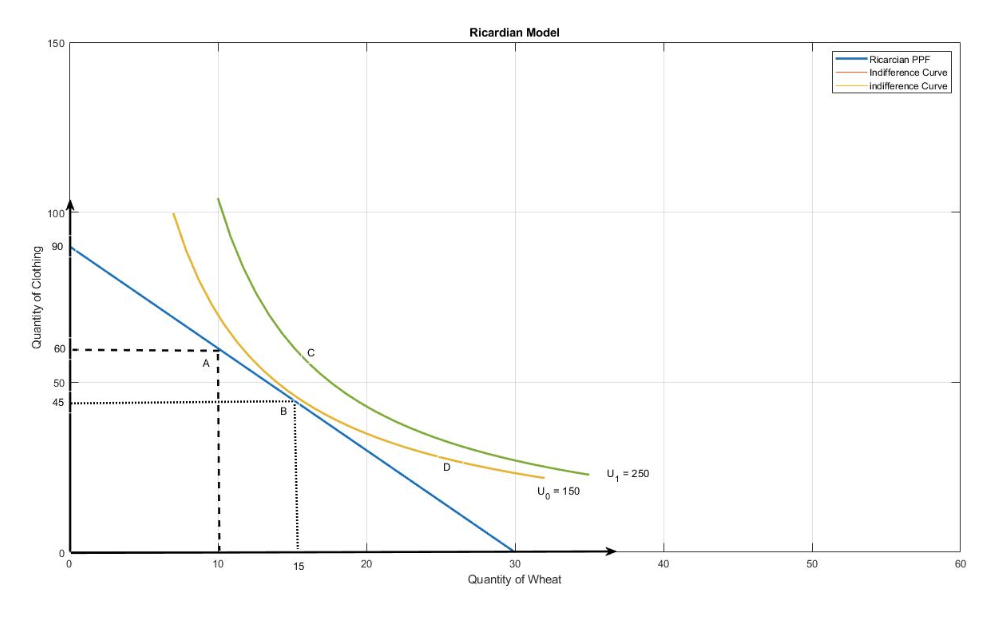
B
Chapter 2: According to the following figure, the economy obtains a utility level equal to ______under autarky equilibrium.
150
Chapter 2: According to the following figure, the autarky relative price of clothing equals
One-third of units of wheat.
Chapter 2: Assume that Ukraine exports wheat and imports guns. What would increase Ukraine's terms of trade?
An increase in the relative price of wheat.
Chapter 2: What lessons can we learn from the Ricardian model?
All answers are correct
Chapter 3: In the specific-factors model, labor
is used in both sectors.
Chapter 3: If a nation allows no trade with all its trading partners, it reaches an equilibrium situation called
Autarky
Chapter 3: If the price per bushel of wheat is $3 and the marginal product of labor is 4 bushels per hour, the hourly wage is
$12
Chapter 3: In the specific-factors model, firms hire labor up to the point where
the wage equals the product's value produced by an additional hour of labor.
Chapter 3: In the specific-factors model, the production possibilities frontier is concave to the graph's origin (instead of linear) because
of the law of diminishing marginal returns to labor.
Chapter 3: The "law of diminishing returns" states that as more labor is employed in manufacturing, its marginal product
Declines
Chapter 3: In the specific-factors model, the amount of manufactures and/or food that a worker can afford to buy is called
Real wage
Chapter 3: In the specific-factors model, if the relative price of one product rises and labor is the mobile factor of production, the equilibrium real wage will
increase by less than the price increase in percentage terms.
Chapter 3: In contrast to the Ricardian model, international trade in the specific-factors model will
lead to gains for some resource owners and losses for other resource owners.
Chapter 3: In the specific-factors model, if a country exports more manufactured goods and imports more agricultural goods leading to better terms of trade, then workers will be able to buy more
agricultural goods
Chapter 3: In the specific-factors model, an increase in the price of manufactured goods will
Have an ambiguous effect on the real wage
Chapter 3: In a specific-factors economy producing manufactured and agricultural goods, what happens to the marginal product of specific factors if the relative price of manufactured goods increases?
The marginal product of capital rises and the marginal product of land falls.
Chapter 3: Given the following information, what is the percentage change in land rental in the specific factors model?
Manufacturing: Sales revenue = $200; Payments to labor=$120; Payments to capital = $80
Agriculture: Sales revenue = $200; Payment to labor = $100; Payments to land = $100
Percentage increase in Price: Manufacturing = 10%; Agriculture = 0%
Percentage increase in wage in both industries = 5%
-5%
Chapter 3: Given the following information, what is the percentage change in capital rental in the specific factors model?
Manufacturing: Sales revenue = $200; Payments to labor=$120; Payments to capital = $80
Agriculture: Sales revenue = $200; Payment to labor = $100; Payments to land = $100
Percentage increase in Price: Manufacturing = 10%; Agriculture = 0%
Percentage increase in wage in both industries = 5%
17.5%
Chapter 3: Under free trade and comparative advantage, the home country will
see winners and losers within its economy.
Chapter 3: Why does the rental of capital change after free trade occurs, resulting in an expansion of manufacturing output?
There is more labor used per unit of capital in the manufacturing sector.
Chapter 3: The United States maintains a program to help workers affected adversely by trade relocation. It is called
Trade Adjustment Assistance
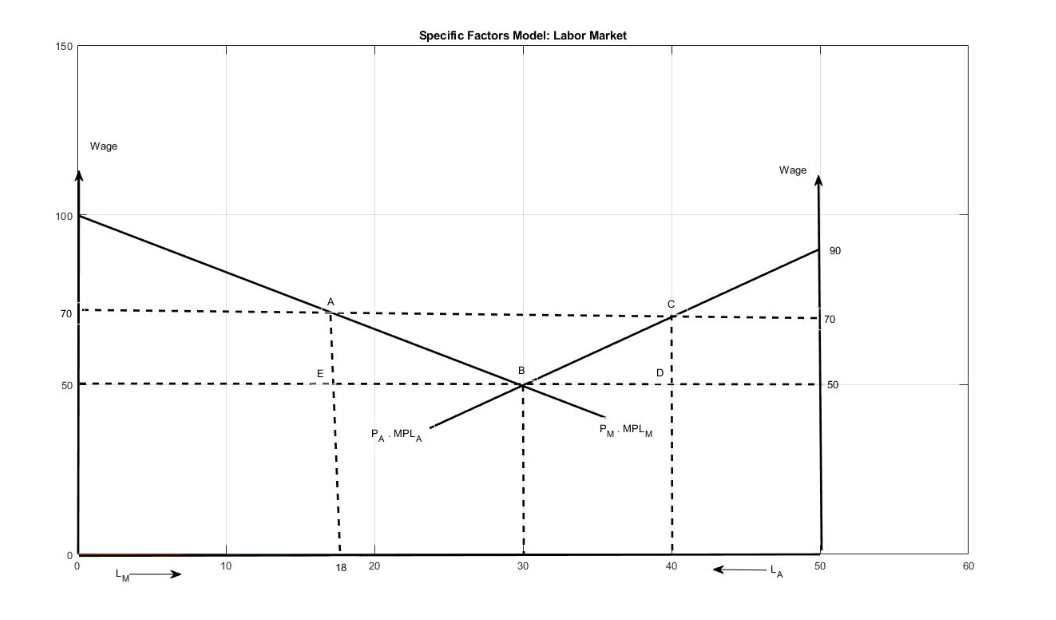
Chapter 3: The following figure illustrates the labor market equilibrium for a small open economy under free trade. The economy produces manufactured goods with capital and labor and agricultural goods with land and labor. The economy's labor endowment is fifty workers. According to the figure, the equilibrium number of workers in agriculture is equal to
20
Chapter 3: The following figure illustrates the labor market equilibrium for a small open economy under free trade. The economy produces manufactured goods with capital and labor and agricultural goods with land and labor. The economy's labor endowment is fifty workers. According to the figure, the income of landowners is equal to
$400
Chapter 3: The following figure illustrates the labor market equilibrium for a small open economy under free trade. The economy produces manufactured goods with capital and labor and agricultural goods with land and labor. The economy's labor endowment is fifty workers. According to the figure, the aggregate income of workers is equal to
$2500