Psychological Statistics Quiz #1
1/23
There's no tags or description
Looks like no tags are added yet.
Name | Mastery | Learn | Test | Matching | Spaced | Call with Kai |
|---|
No analytics yet
Send a link to your students to track their progress
24 Terms
What is a variable?
A variable is any type of thing that you can categorize, measure, or count.
• a thing whose value varies between observations in your dataset.
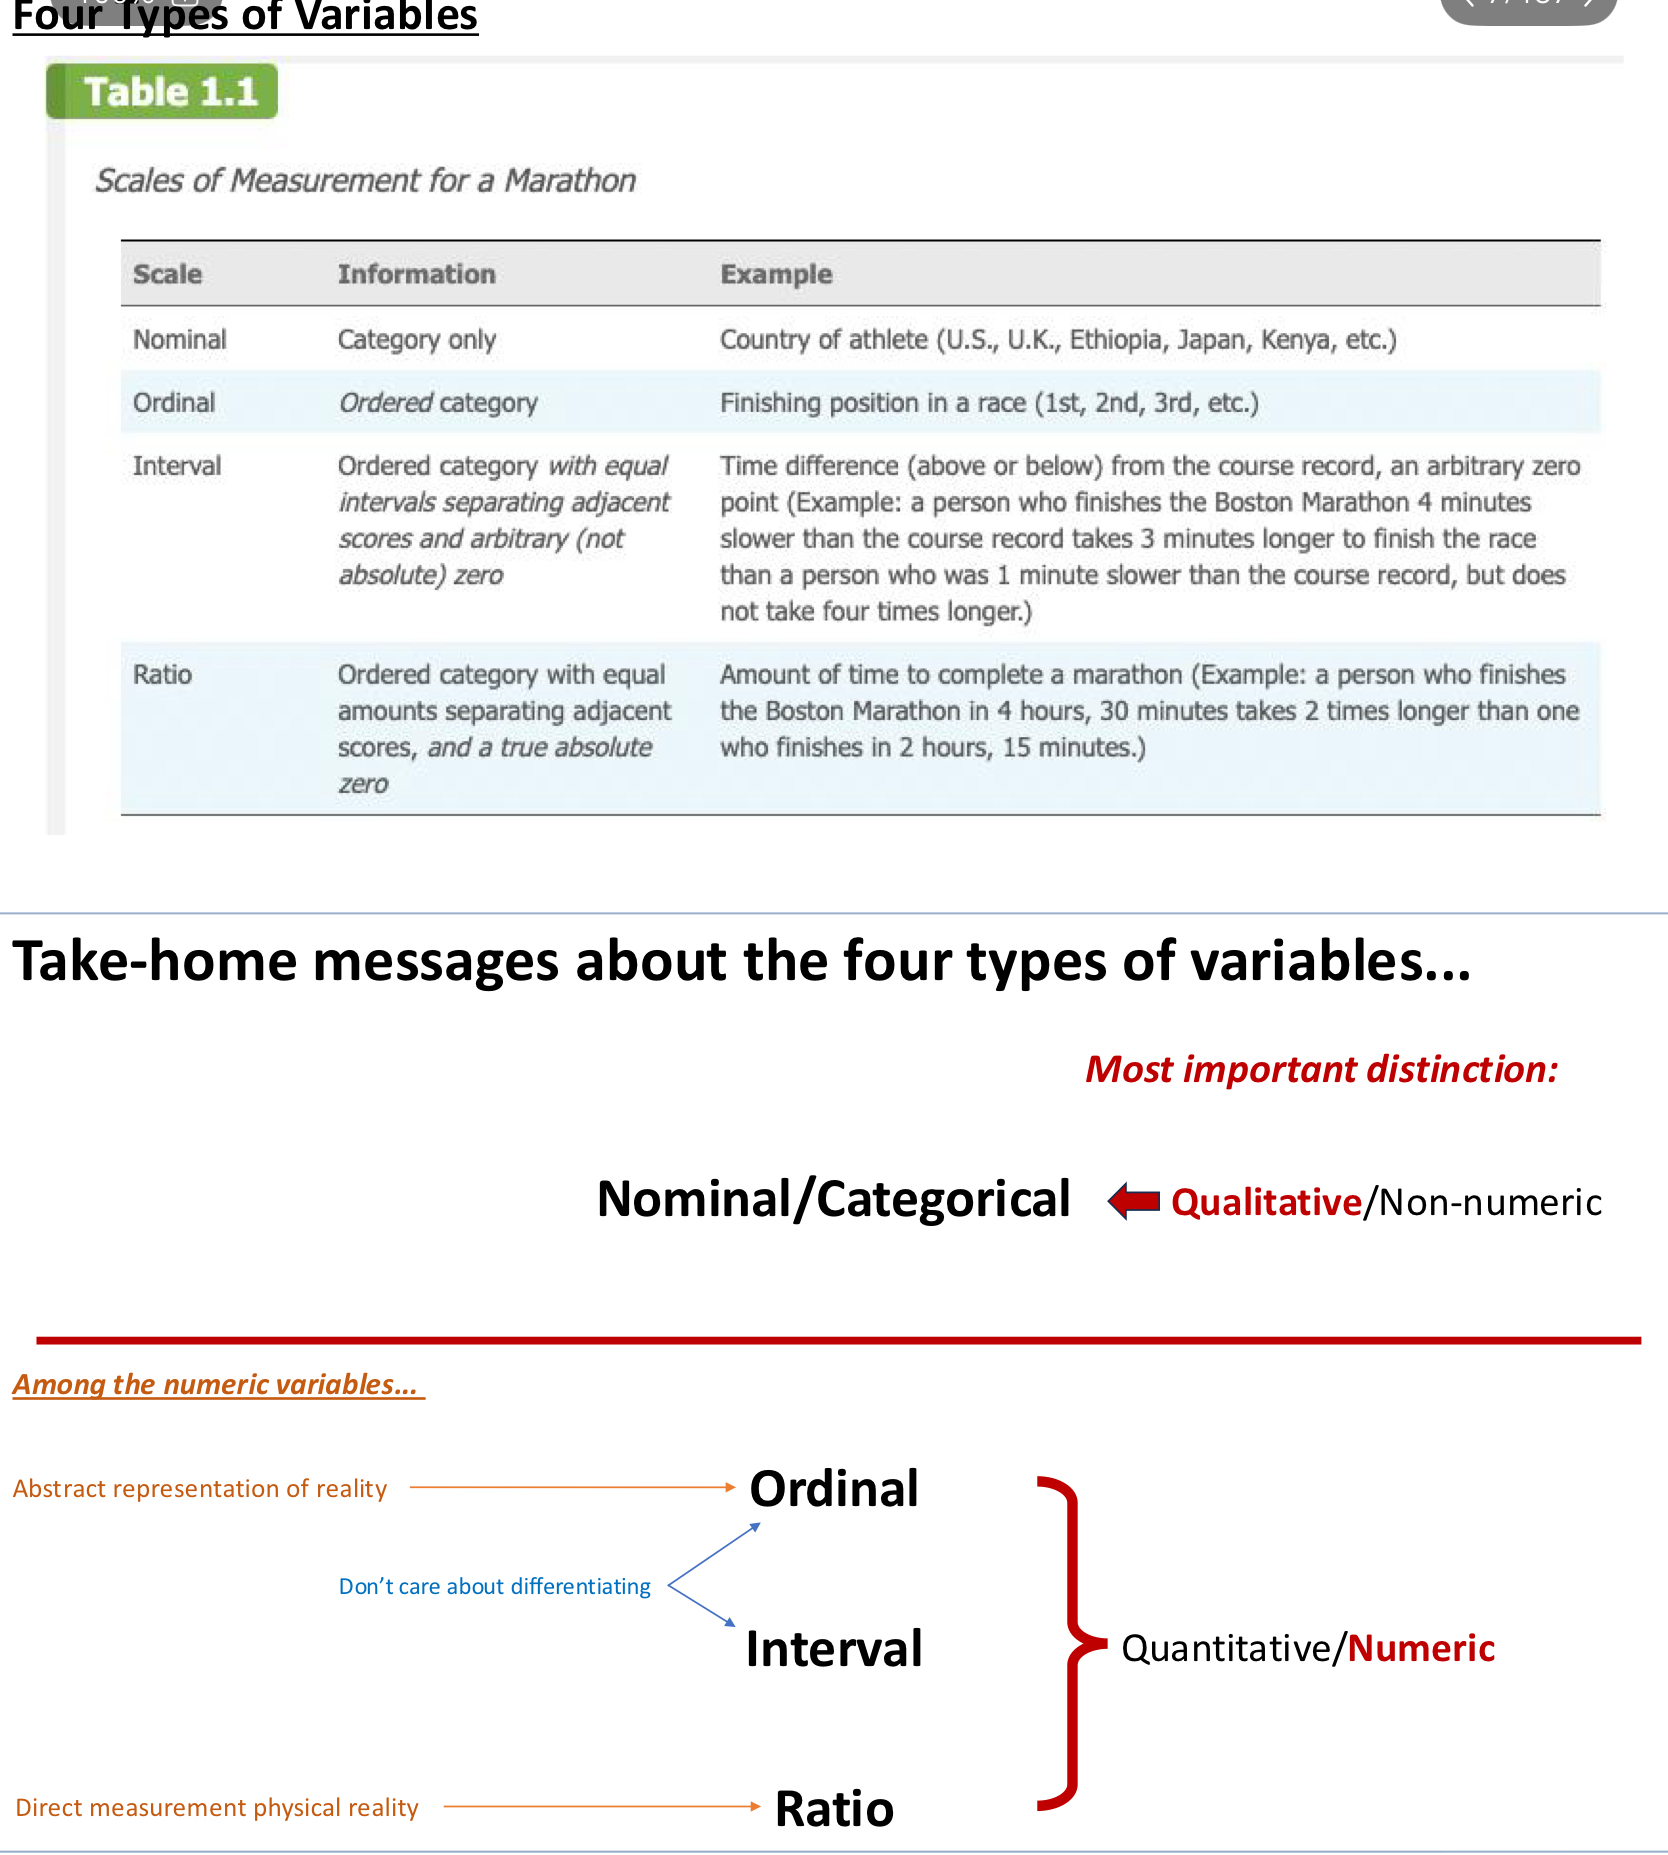
Four Types of Variables:
• Nominal; Categorical... A nominal (or “categorical”) variable is qualitative. It varies by name, instead of by quantity (i.e., numerical value)...
• Examples?
• eye color... academic year... state of residence... covid status...
• Prior to statistical analysis, it is often critical to define the number of “levels” of each nominal variable.
• For example, “Sex” would (most often) have two levels: male; female....
“hair color” might have four levels: blond, red, brown, black
Ordinal scales
• The order of values matters, but differences between values on the scale might not represent equivalent differences in the construct. But, you don’t know how close they were.
• E.g., 1st place, 2nd place, 3rd place
• E.g., 1=very unsatisfied; 2=somewhat unsatisfied; 3=neutral; 4=somewhat satisfied; 5 = very satisfied
So like, maybe 1st and 2nd finished closer than 3rd and 4th, but that doesn’t matter in ordinal scales.
Interval variables
• Example:
• degrees Fahrenheit and degrees Celsius are both interval scales, because:
• 0o ≠ zero heat energy
• IF there is a True Zero, it’s a Ratio Variable (see next slide)...
• BUT, equal intervals (2 to 4, compared to 6 to 8) relate to equal differences in heat. by contrast, Kelvin is a Ratio Variable...
Ratio... Ratio variables are physical, real-world things that can be measured.
• Examples: Height... Weight... number of fingers... time to run 100 meters... Hours of sleep
• zero = zero of the thing... (“True Zero”)
• zero weight = you don’t exist
• zero fingers = no fingers.
• Ratios are meaningful.
• 40o Farenheit ≠ 2*20o Farenheit... BUT, 40 Kelvin = 2*20 Kelvin
Zero means that there is nothing, 0° Farenheit and Celcius have negative values, so they are not ratio. Same thing with credit score: you can’t get to 0.
Two Common Uses of Statistics
1. Precisely describe/quantify the details of a specific a chunk of reality.
• Descriptive Statistics do this.'
• e.g., describe the mean and standard deviation of how many nightly hours of sleep PSYC 2320 students get
2. Use measurements of one small chunk of reality to draw probabilistic
conclusions about a MUCH LARGER chunk of reality.
• Inferential Statistics do this.
• e.g., based on the mean & SD of hours of sleep among PSYC 2320 students (sample), what is the 95% confidence interval of mean nightly hours of sleep among all Northeastern Students (population).
A “parameter” vs a “statistic”
A “population” vs a “sample”
What’s the difference?
A parameter pertains to an entire population (e.g., 23% of US citizens)
• examples of populations:
• the entire US...
• the entire population of Northeastern students...
A statistic pertains to a sample of a population (e.g., 23% of survey respondents)
• examples of samples:
• our 2320 class is a relatively flawed sample of the entire population of Northeastern students
• our 2320 class could also be a very flawed sample of the entire US...
• NOT a random sample; NOT a sample that accurately represents the population
Descriptive vs. Inferential statistical analyses...
Descriptive statistics just describe your sample. Are exactly what they sound like:
Descriptive Statistics describe the dataset from which they came.
Examples of Descriptive Statistics:
• What is the average (mean) age of PSYC 2320 students?
• How many students have tested positive for covid this semester?
• What percentage of Princeton students drive a luxury car that was
purchased by their parents?
Inferential Statistics use your sample data to make probabilistic inferences about the population
Are much more ambitious...
They use your sample statistics (i.e., your descriptive statistics) to make probabilistic inferences about the population.
ALL research findings in your psychology textbooks (or any other science textbook)= summaries of inferential statistics!!
Example:
• Based on the proportion of participants who reported that Bill
Cosby was the most unlikable celebrity in America (M = 58%),
compared to the proportion who reported that Gwyneth Paltrow
was the most unlikable (M = 7%), we conclude that Bill Cosby is
significantly more unlikable than Gwyneth among American
college students, 𝜒2 (1, N = 175) = 6.7, p < .01
What is Sampling Error
Imagine I collected data from you, and I found that
people who sit on the left side of the room are an
average of 1 inch taller than people who sit on the right
side of the room.
Which is more likely:
1. There is something about the left side of the room
that attracts taller people?
2. The 1-inch difference is due to random chaos
Sometimes the world is just weird, but replication is always helpful to figure out if it is a sampling error.
Correlational Design:
As X rises, does Y tend to rise or fall?
Tell me:
• X = studying.... Y = GPA
• X = sleep.... Y = anxiety
• X = height.... Y = how many vegetables you eat per year
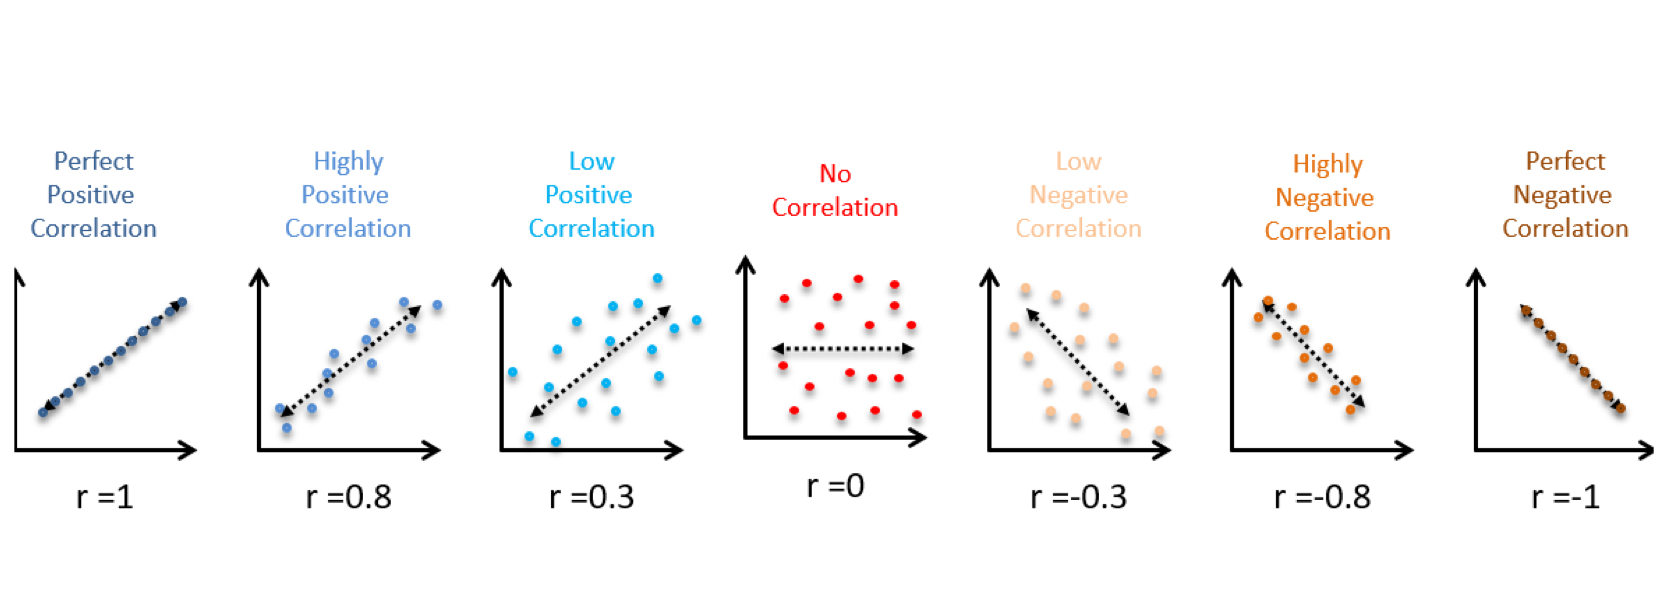
Positive Correlation: higher values of X are associated with higher values of Y
• Also, lower values of X are associated with lower values of Y
Negative Correlation: higher values of X are associated with lower values of Y
• Lower values of X are associated with higher values of Y.
Zero Correlation: Values of X aren’t associated with values of Y.
A Correlation Coefficient (r) describes the correlation between
two variables as a number within the range: -1 → 0 → +1
• Positive Correlation: As r approaches +1, it means that X and Y
tend to rise and fall together
• Negative Correlation: As r approaches -1, it means that X and Y
tend to go in opposite directions
• Zero Correlation: As r approaches 0, no correlation between X and Y
Quasi-Experimental Design (aka “non-equivalent groups” design)
Comparison of naturally occurring groups. for example:
• Which group has higher emotional IQ: Men or Women?
• Which group drinks more beer: Freshmen or Seniors?
• Which group is faster at sprinting: Chinese or Japanese?
• Note: these are not worthwhile questions; they’re just valid examples of this type of design
essentially, when you can’t assign people to different groups.
Like correlational design, quasi-experimental design cannot determine
whether changes in one variable causes changes in the other variable...
Why?
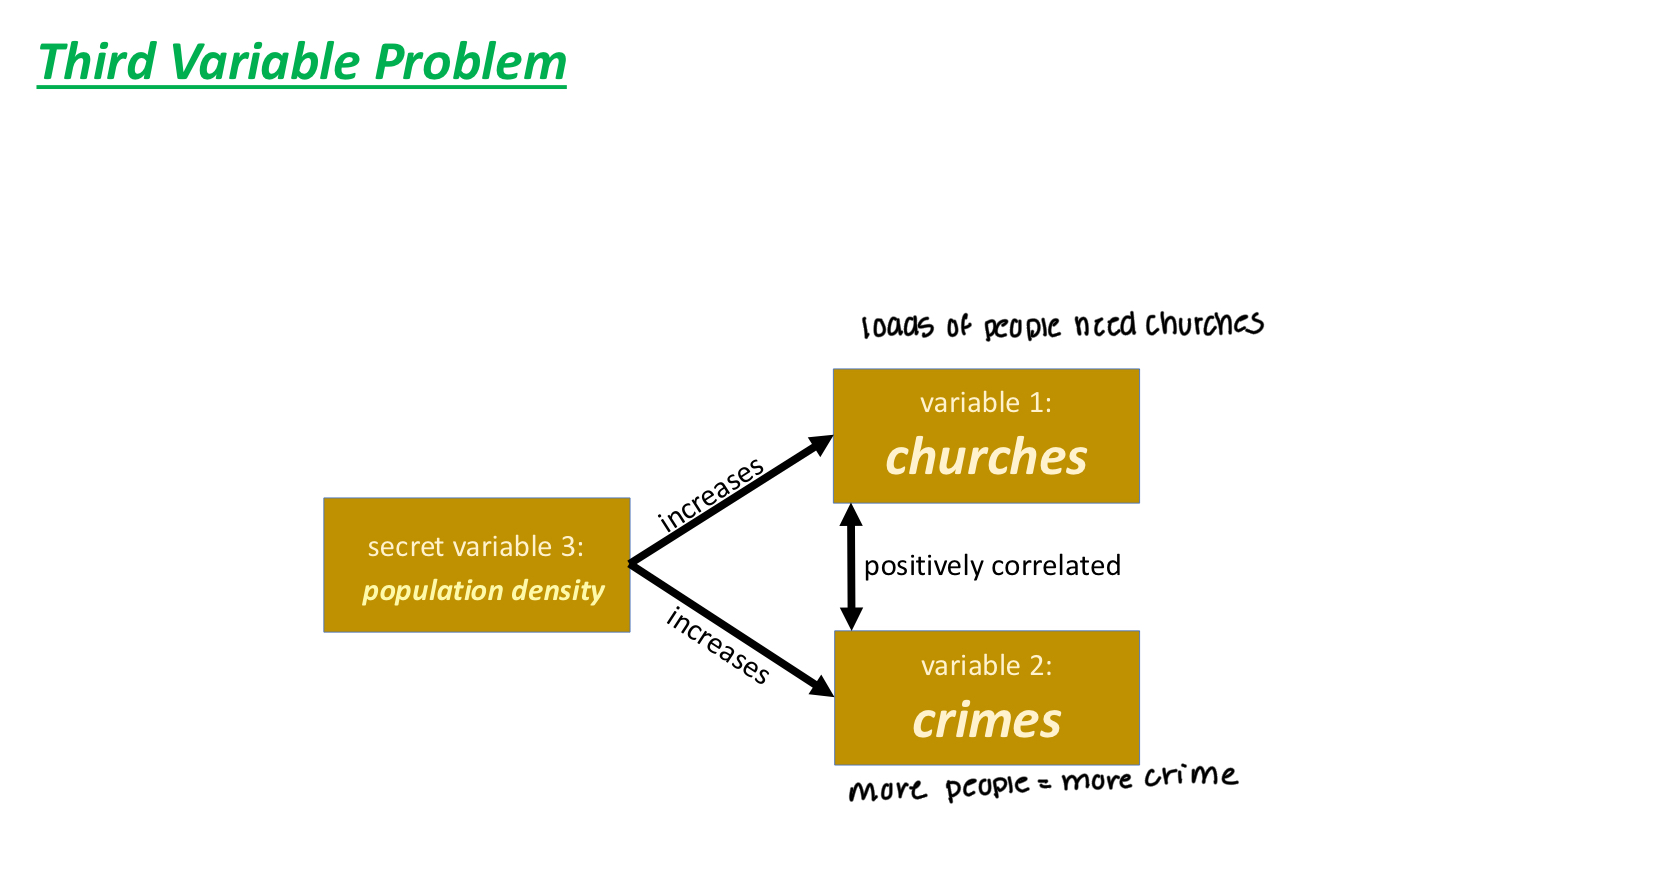
Third Variable Problem
Third Variable Problem: When a secret third variable influences both of
two variables that are significantly correlated
• Neither of the two correlated variables causes the other
• Changes in both variables are caused by the secret third variable
Think of heartburn study where they failed to consider that diet or sleep could be causing the drugs to be linked with mortality
Ice cream sales and shark attacks are positively correlated, the third variable in that situation is the heat.
THE PURPOSE OF SCIENCE: + IV and DV
1. Identify cause-and-effect relationships between phenomena.
2. Use [1] to make predictions about and/or influence the future.
Within a scientific study...
... the “cause” = the independent variable
... the “effect” = the dependent variable
Experimental Research (aka True Experimental Design)
In a true experimental design, participants are RANDOMLY ASSIGNED
to different conditions of the experiment
• Conditions should be identical, except for the ndependent Variable (IV)
• Each condition of an experiment represents a different “level” of the IV.
Why is RANDOM ASSIGNMENT so critical in True Experimental Design?
If participants are randomly assigned to different levels of the independent
variable (IV) -- i.e., to different conditions...
... and if conditions are identical, aside from differences in the IV....
... then any differences between conditions in the dependent variable (DV)
must be due to differences in the independent variable.
This is why True Experimental Design is THE ONE type of study that can determine causality.
Proportion and Percentage
proportion = f/N = frequency of [some value] / total observations
What proportion of this dataset is X = 2?
f = There are 3 observations of X = 2
N = [1+2+3+3+1] = 10 total observations
proportion = f/N =
percentage = p(100)
p = f/N = 3 / 10 = 0.3
30% of our observations of X in this dataset were X = 2
For what percentage of the dataset was X = 2?
= 0.3(100) = 30%
![<p>proportion = f/N = frequency of [some value] / total observations</p><p>What proportion of this dataset is X = 2?</p><p>f = There are 3 observations of X = 2</p><p>N = [1+2+3+3+1] = 10 total observations</p><p>proportion = f/N =</p><p></p><p>percentage = p(100)</p><p>p = f/N = 3 / 10 = 0.3</p><p>30% of our observations of X in this dataset were X = 2</p><p></p><p>For what percentage of the dataset was X = 2?</p><p>= 0.3(100) = 30%</p><p></p>](https://knowt-user-attachments.s3.amazonaws.com/648af2c5-2775-4622-8938-3584c47e155d.png)
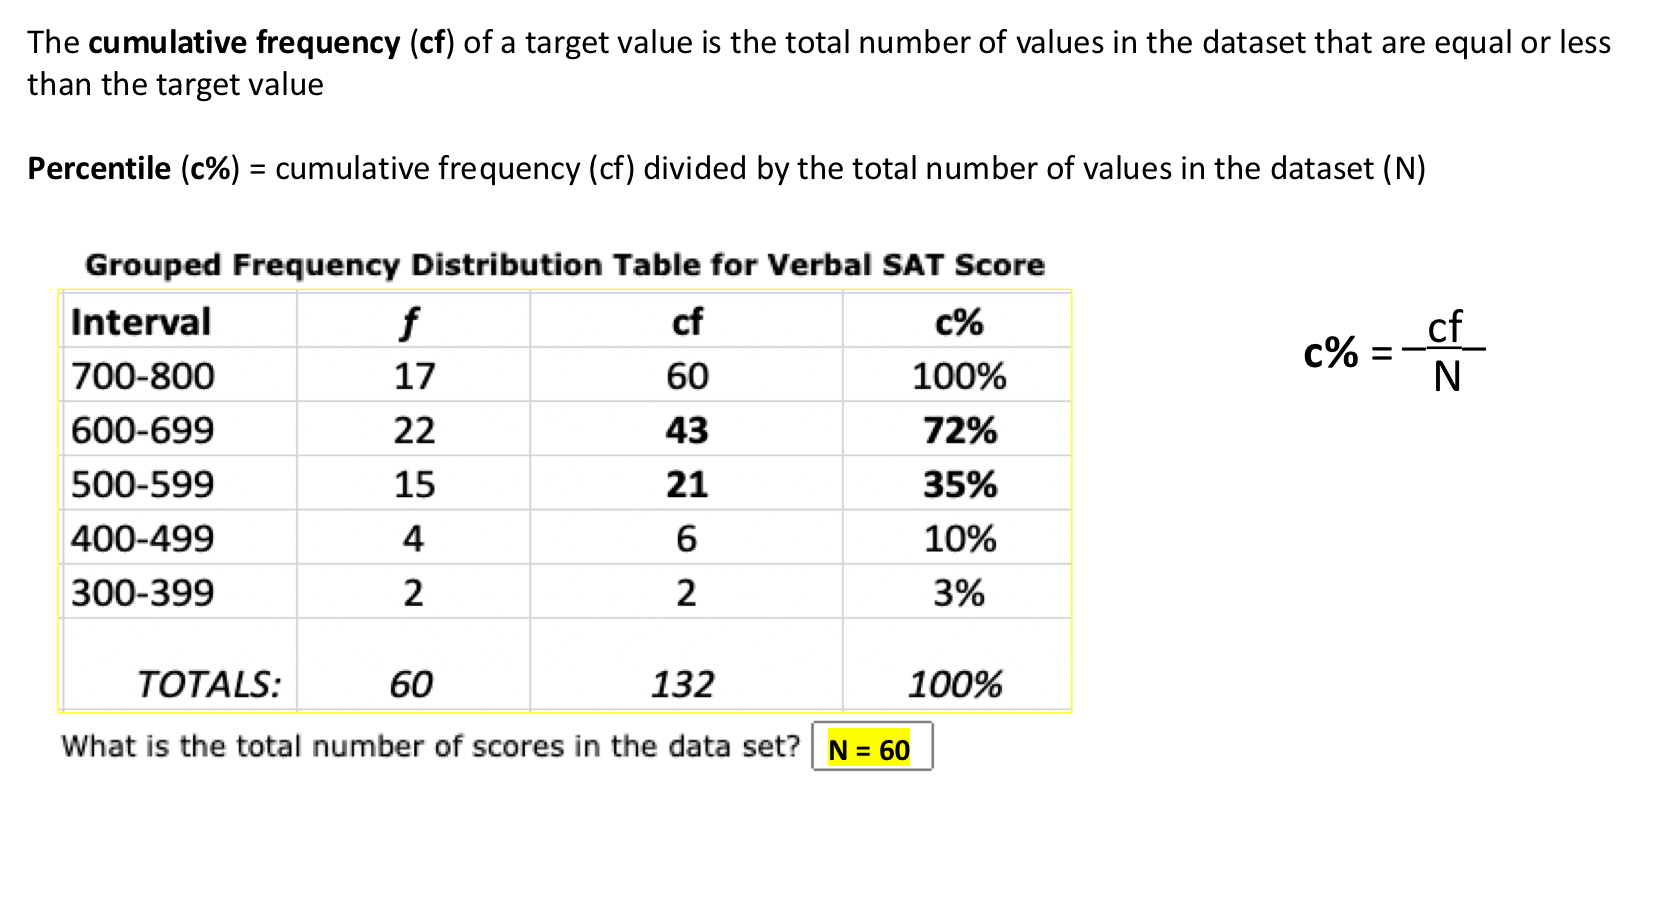
Percentile Rank
The percentile rank of a particular score is defined as the percentage of individuals in the distribution with scores at or below this score.
The cumulative frequency (cf) of a target value is the total number of values in the dataset that are equal or less than the target value
Percentile (c%) = cumulative frequency (cf) divided by the total number of values in the dataset (N)
c% = cf/N x 100
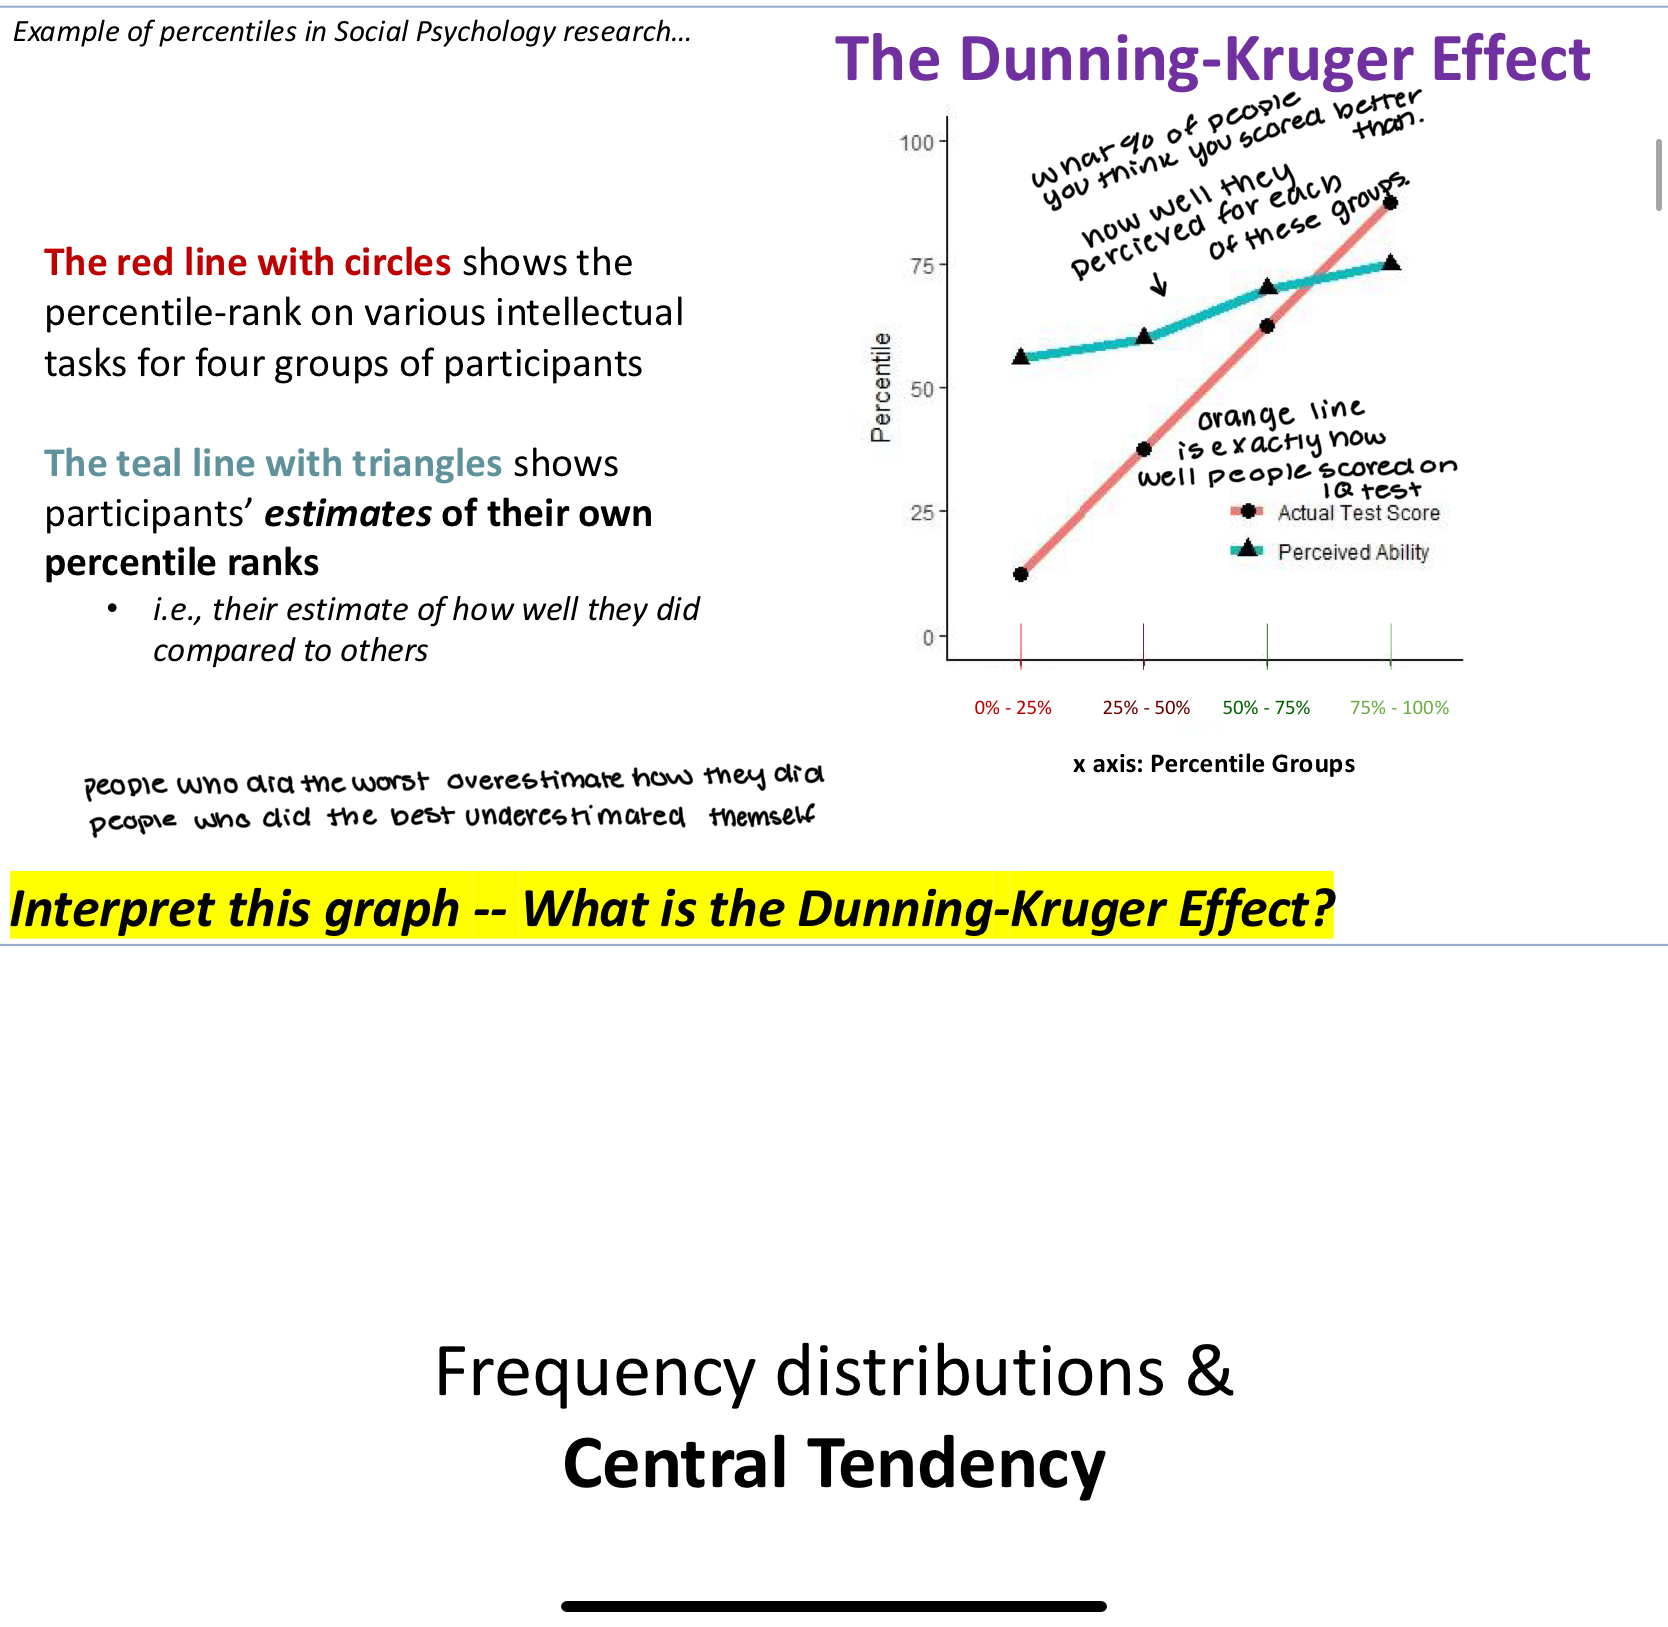
The Dunning-Kruger Effect
The red line with circles shows the percentile-rank on various intellectual
tasks for four groups of participants
The teal line with triangles shows participants’ estimates of their own percentile ranks
• i.e., their estimate of how well they did compared to others
The Dunning-Kruger Effect is basically that the people who did the worst overestimate how they did and the people who did the best underestimated themselves
Frequency Distribution
A Frequency Distribution shows how frequently each value occurs within a dataset
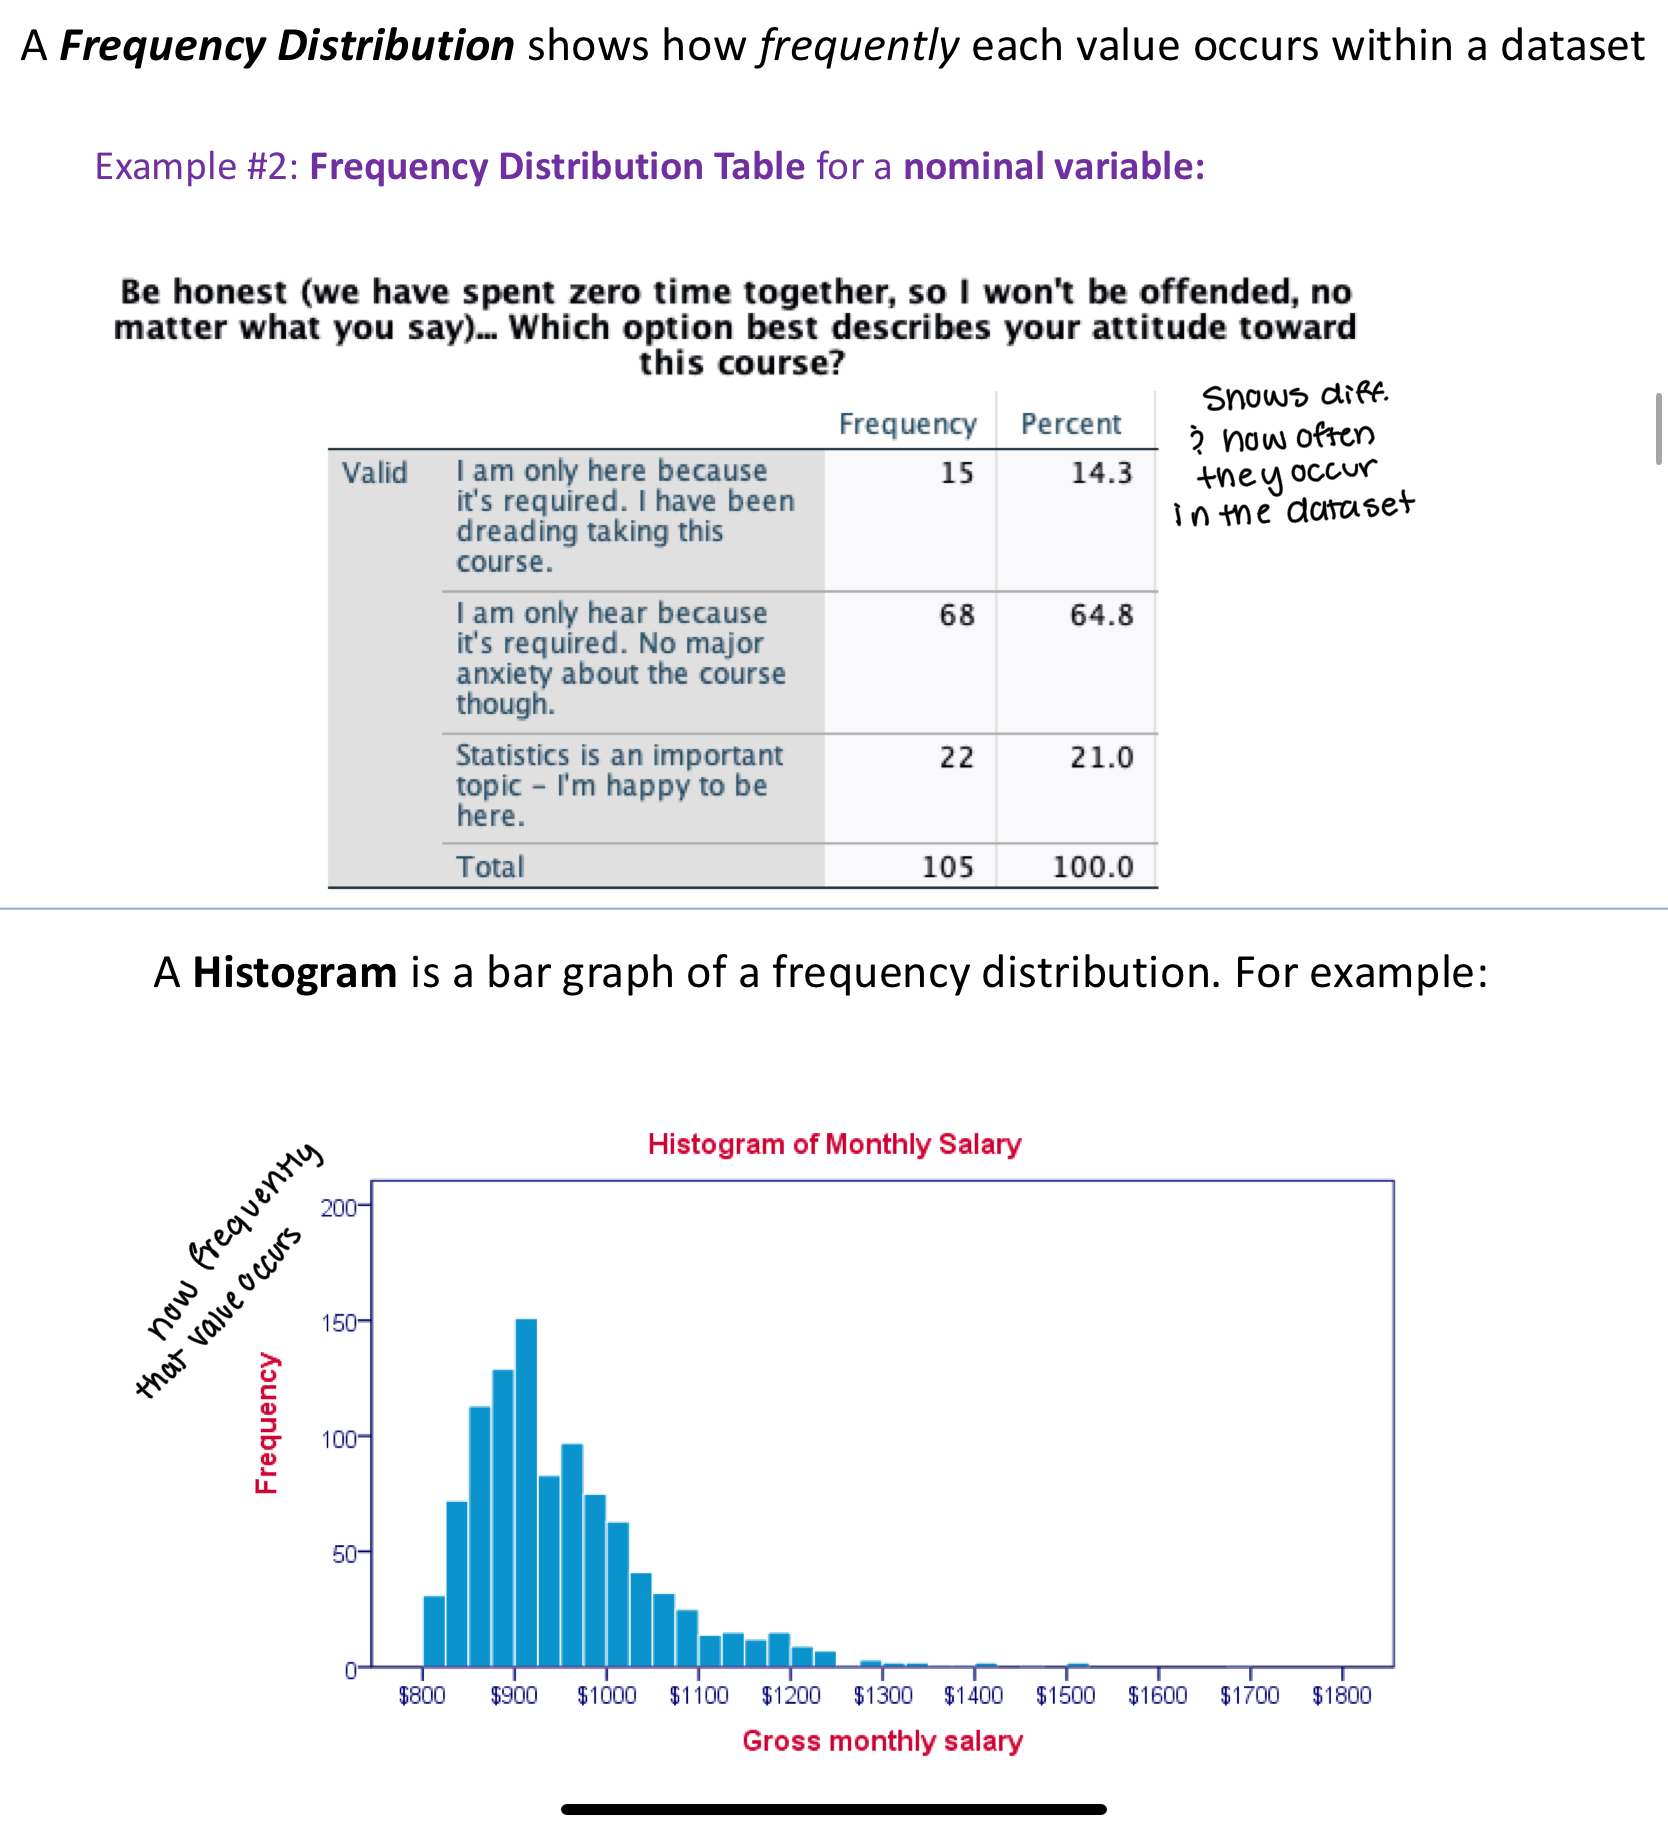
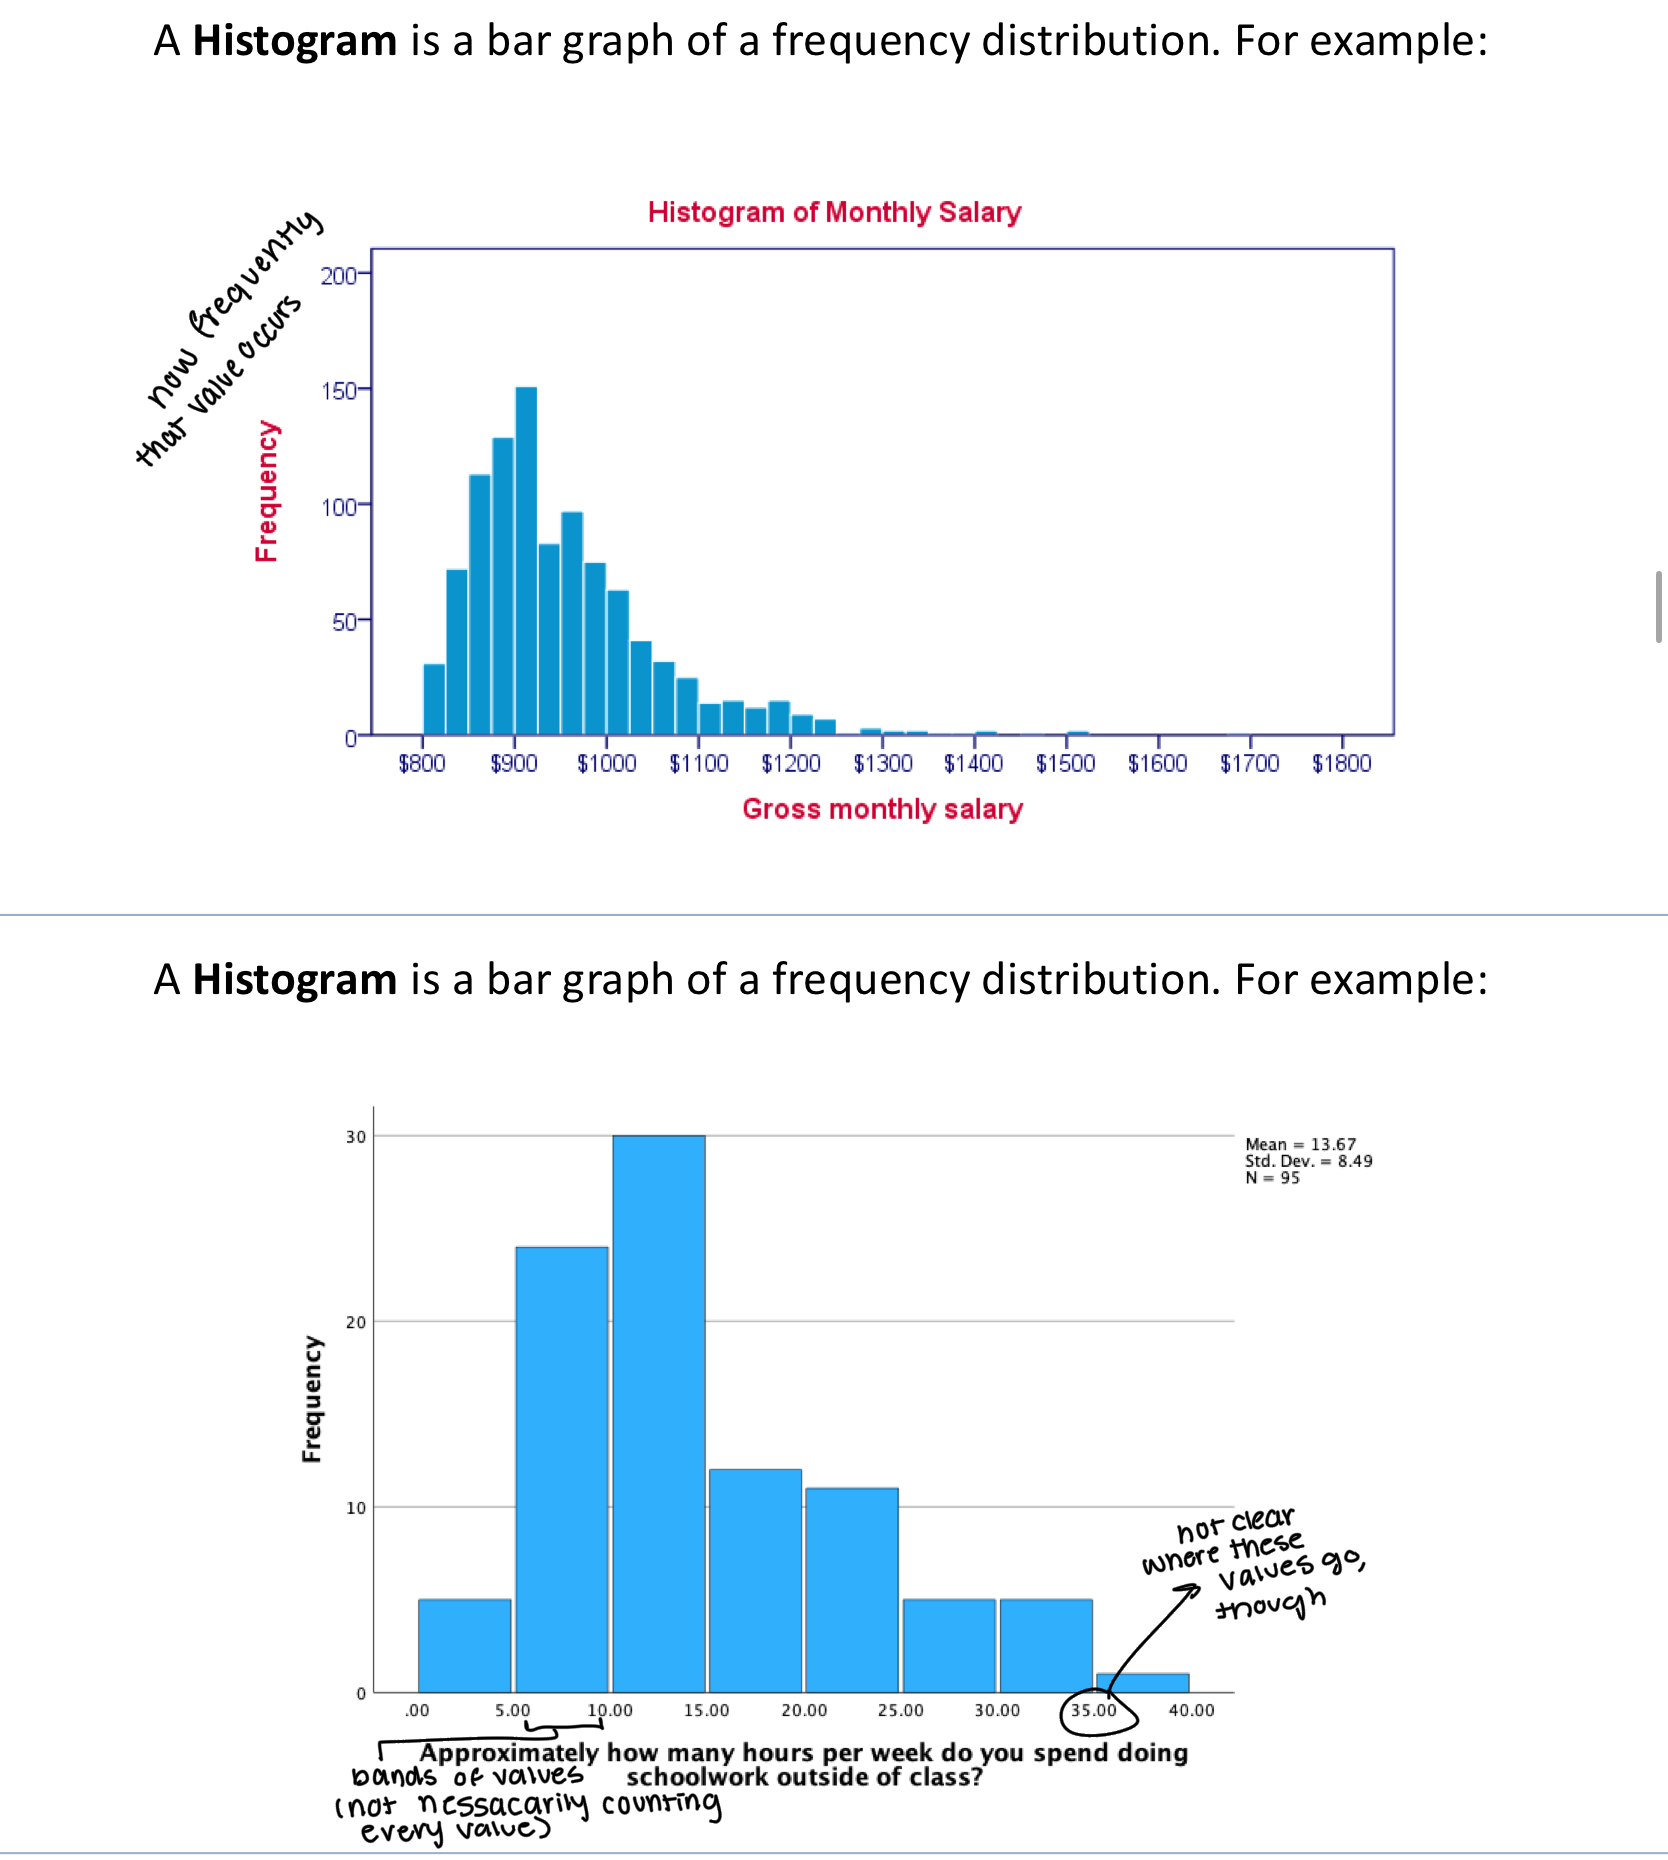
Histogram
A Histogram is a bar graph of a frequency distribution. For example
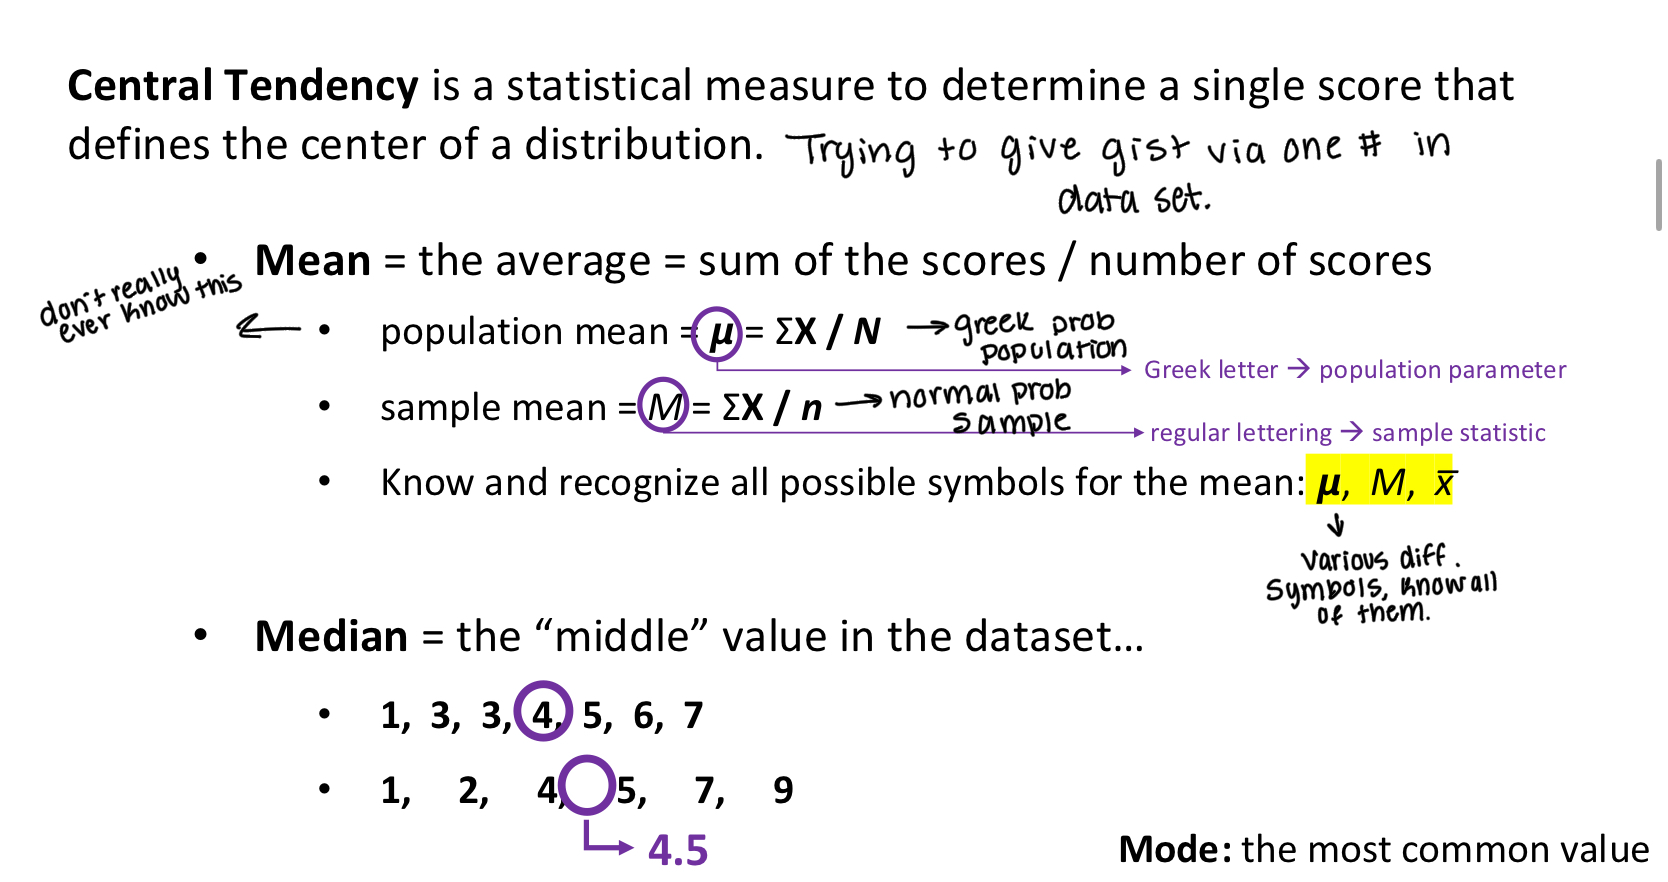
Assessing Central Tendency
Central Tendency is a statistical measure to determine a single score that
defines the center of a distribution.
• Mean = the average = sum of the scores / number of scores
• population mean = 𝞵 = ΣX / N
• sample mean = M = ΣX / n
• Know and recognize all possible symbols for the mean: 𝞵, M, x̅
Greek letter → population parameter
regular lettering → sample statistic
• Median = the “middle” value in the dataset...
Mode: the most common value
When to use mean and median?
When the data obey a NORMAL DISTRIBUTION. aka a bell curve USE THE MEAN
A LOT of variables are normally distributed (roughly). Thus, the mean is the most common measure of central tendency
In a perfectly normal distribution, mean = median = mode
What about the median?
When is the median a better measure of central tendency?
• When there are major outliers (especially within small datasets)...
• ... the mean is sensitive.
• ... the median doesn’t care.
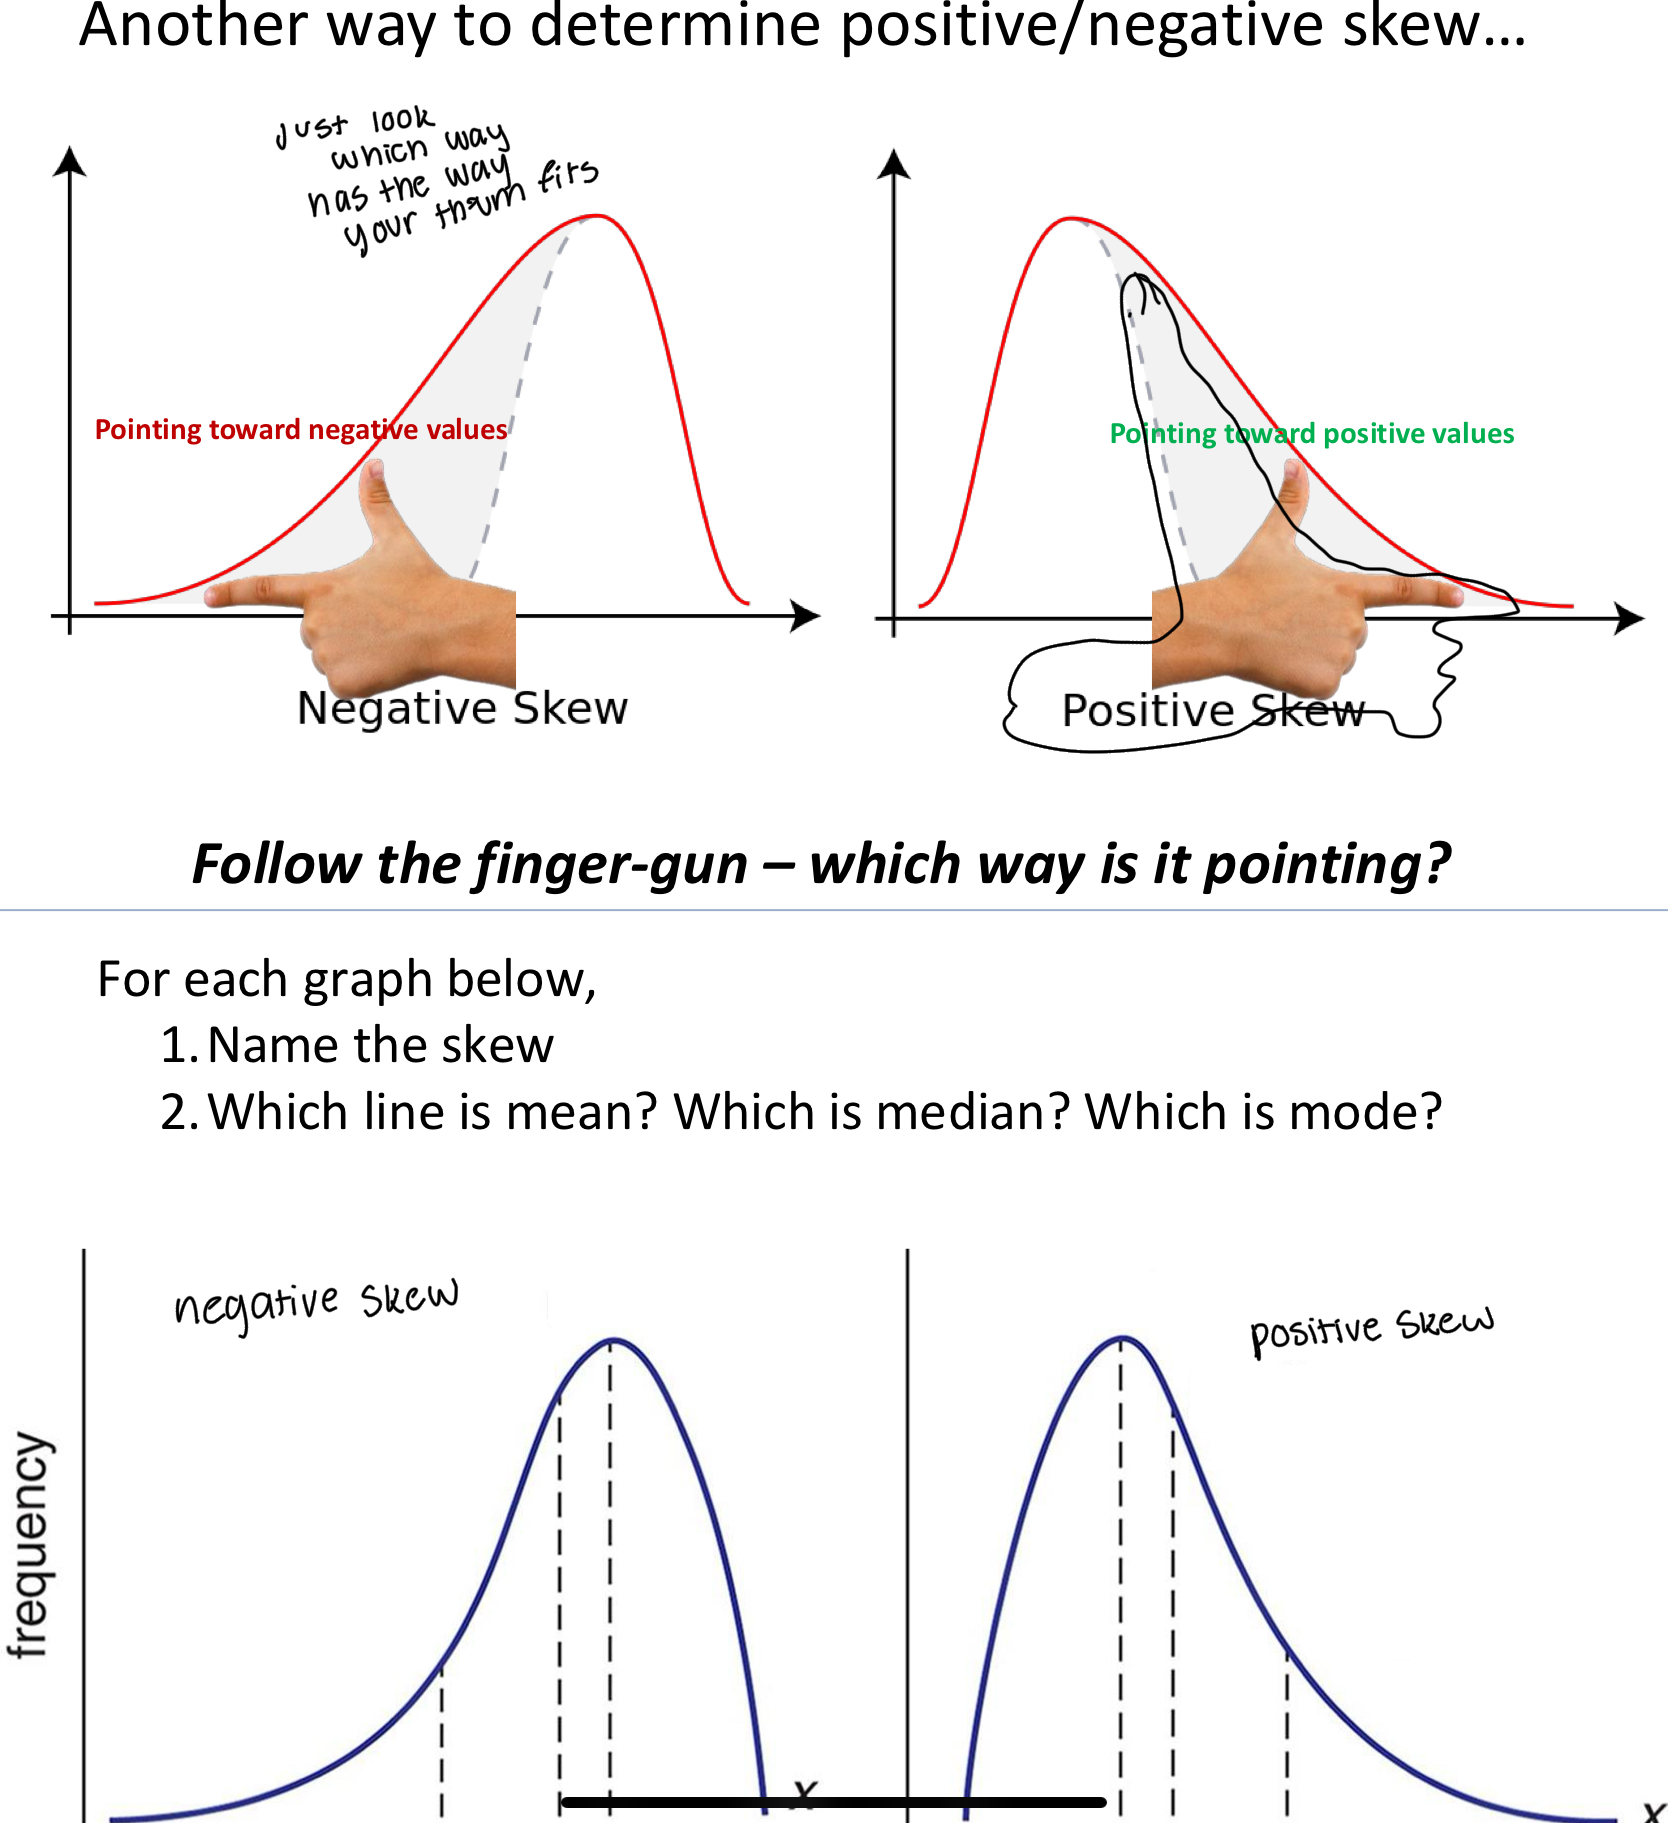
• When the data are skewed
• Positively skewed data: the mean will be “too high”
• Negatively skewed data: the mean will be “too low”
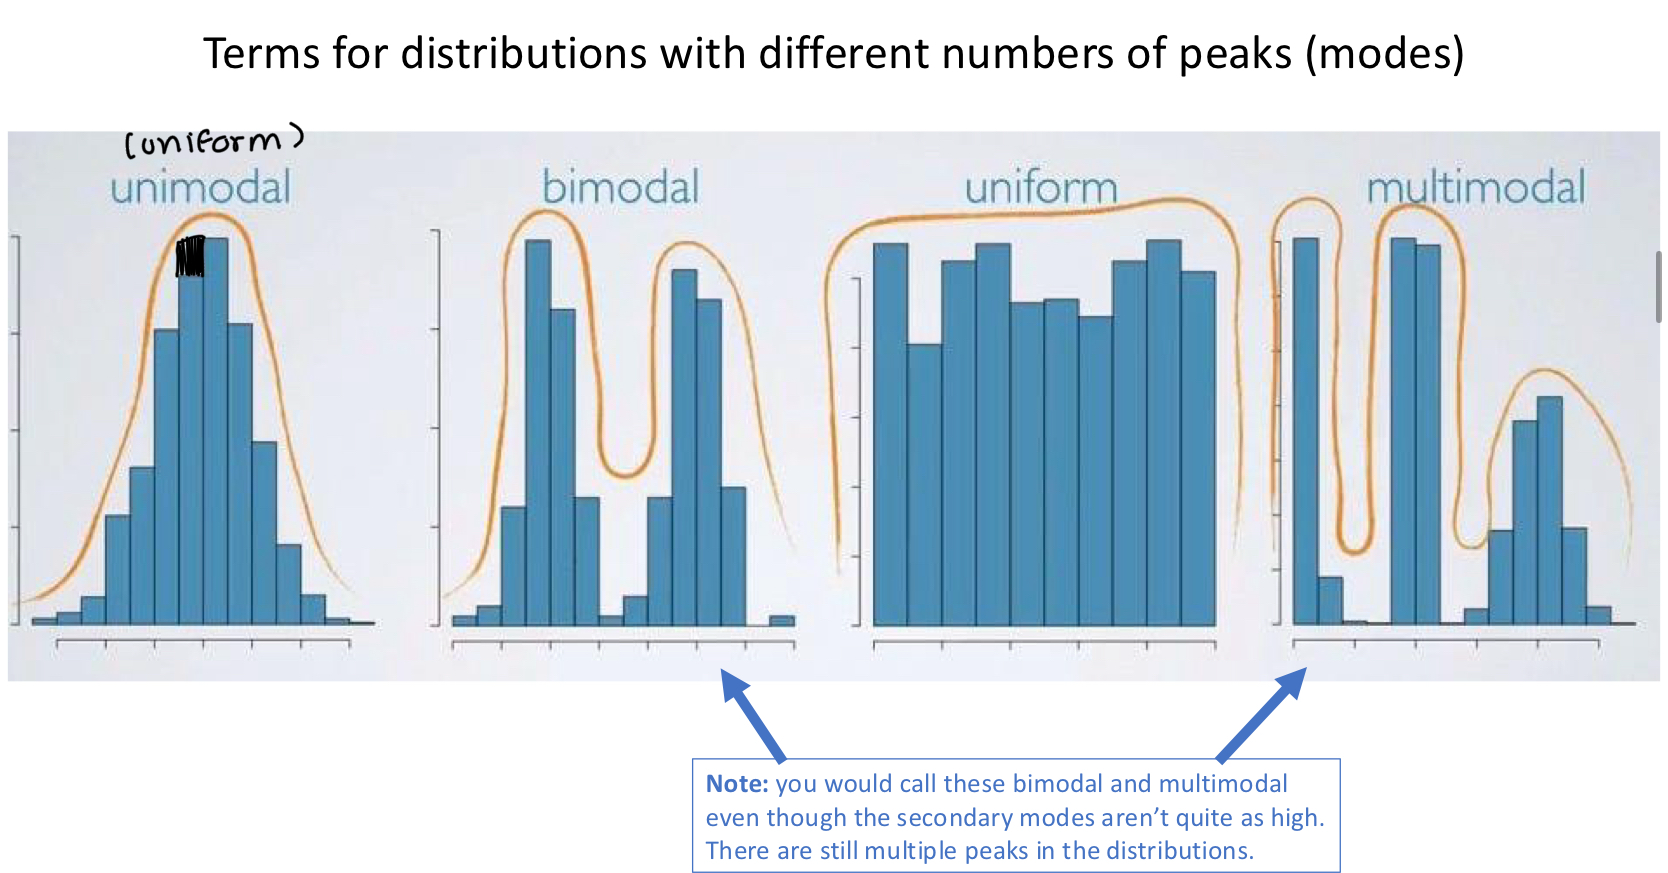
Showcase of distributions with different numbers of peaks (modes)
Skewing
Positive skew: he mean is skewed positively. It is a higher (more positive) value
than the center of the distribution
Negative skew is the opposite of that
What to do when summarizing data?
In a nutshell, when summarizing data, do this:
1. Calculate both the mean and the median
2. If they’re similar, then just talk about the mean when summarizing your data
3. If they’re dissimilar, talk about both the mean and the median, and talk about why they’re dissimilar (outliers? Skew?)
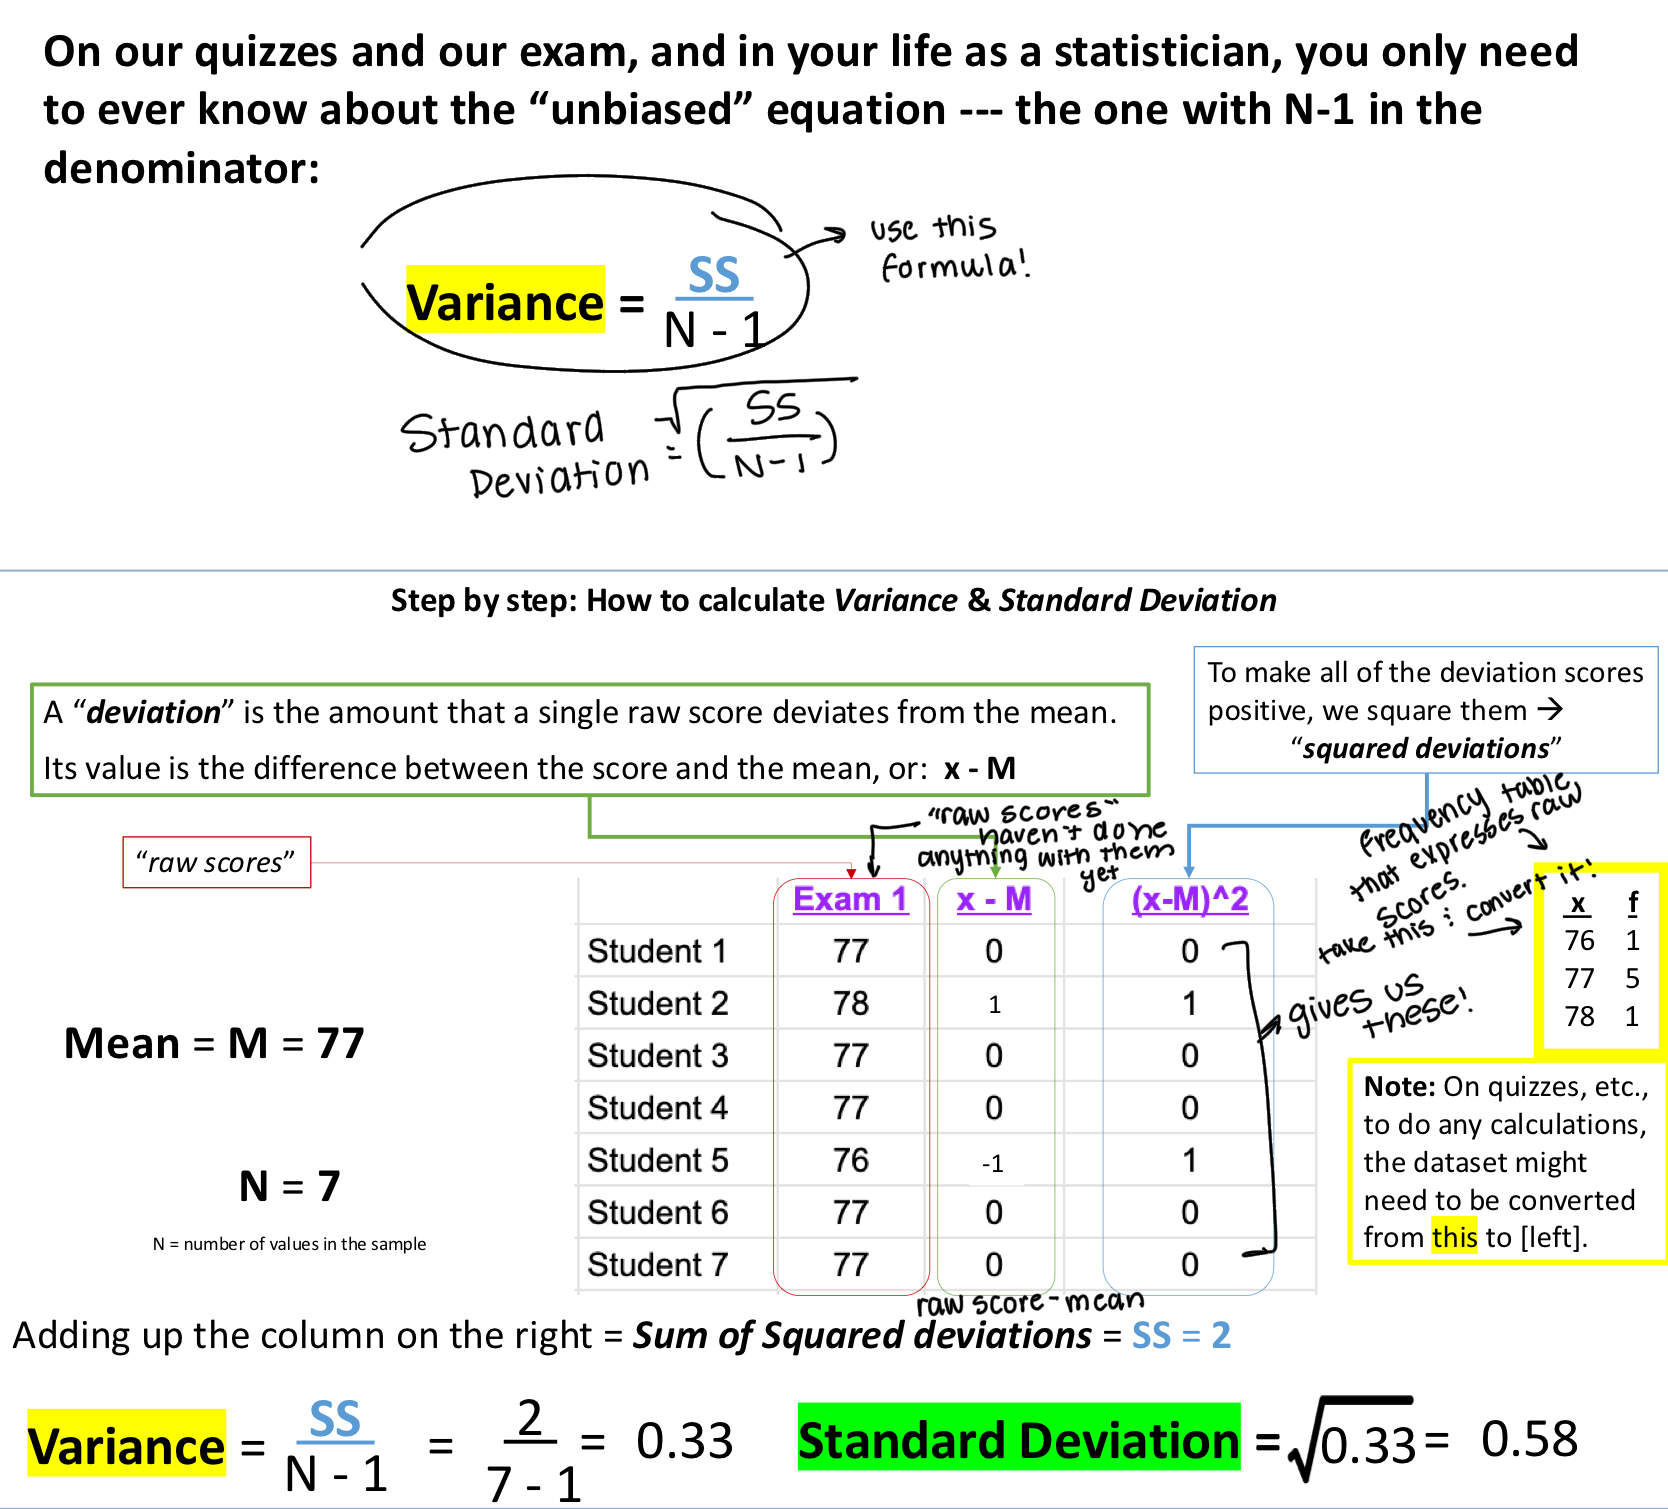
Variability
The divergence of data from its mean value
The difference: variability:
low variability -- scores are consistent.
high variability -- scores are all over the place.
Measures of variability: Variance & Standard Deviation
Variance = SS/(N-1)
Standard Deviation: Sqrt(Variance)
Where SS is squared Deviations
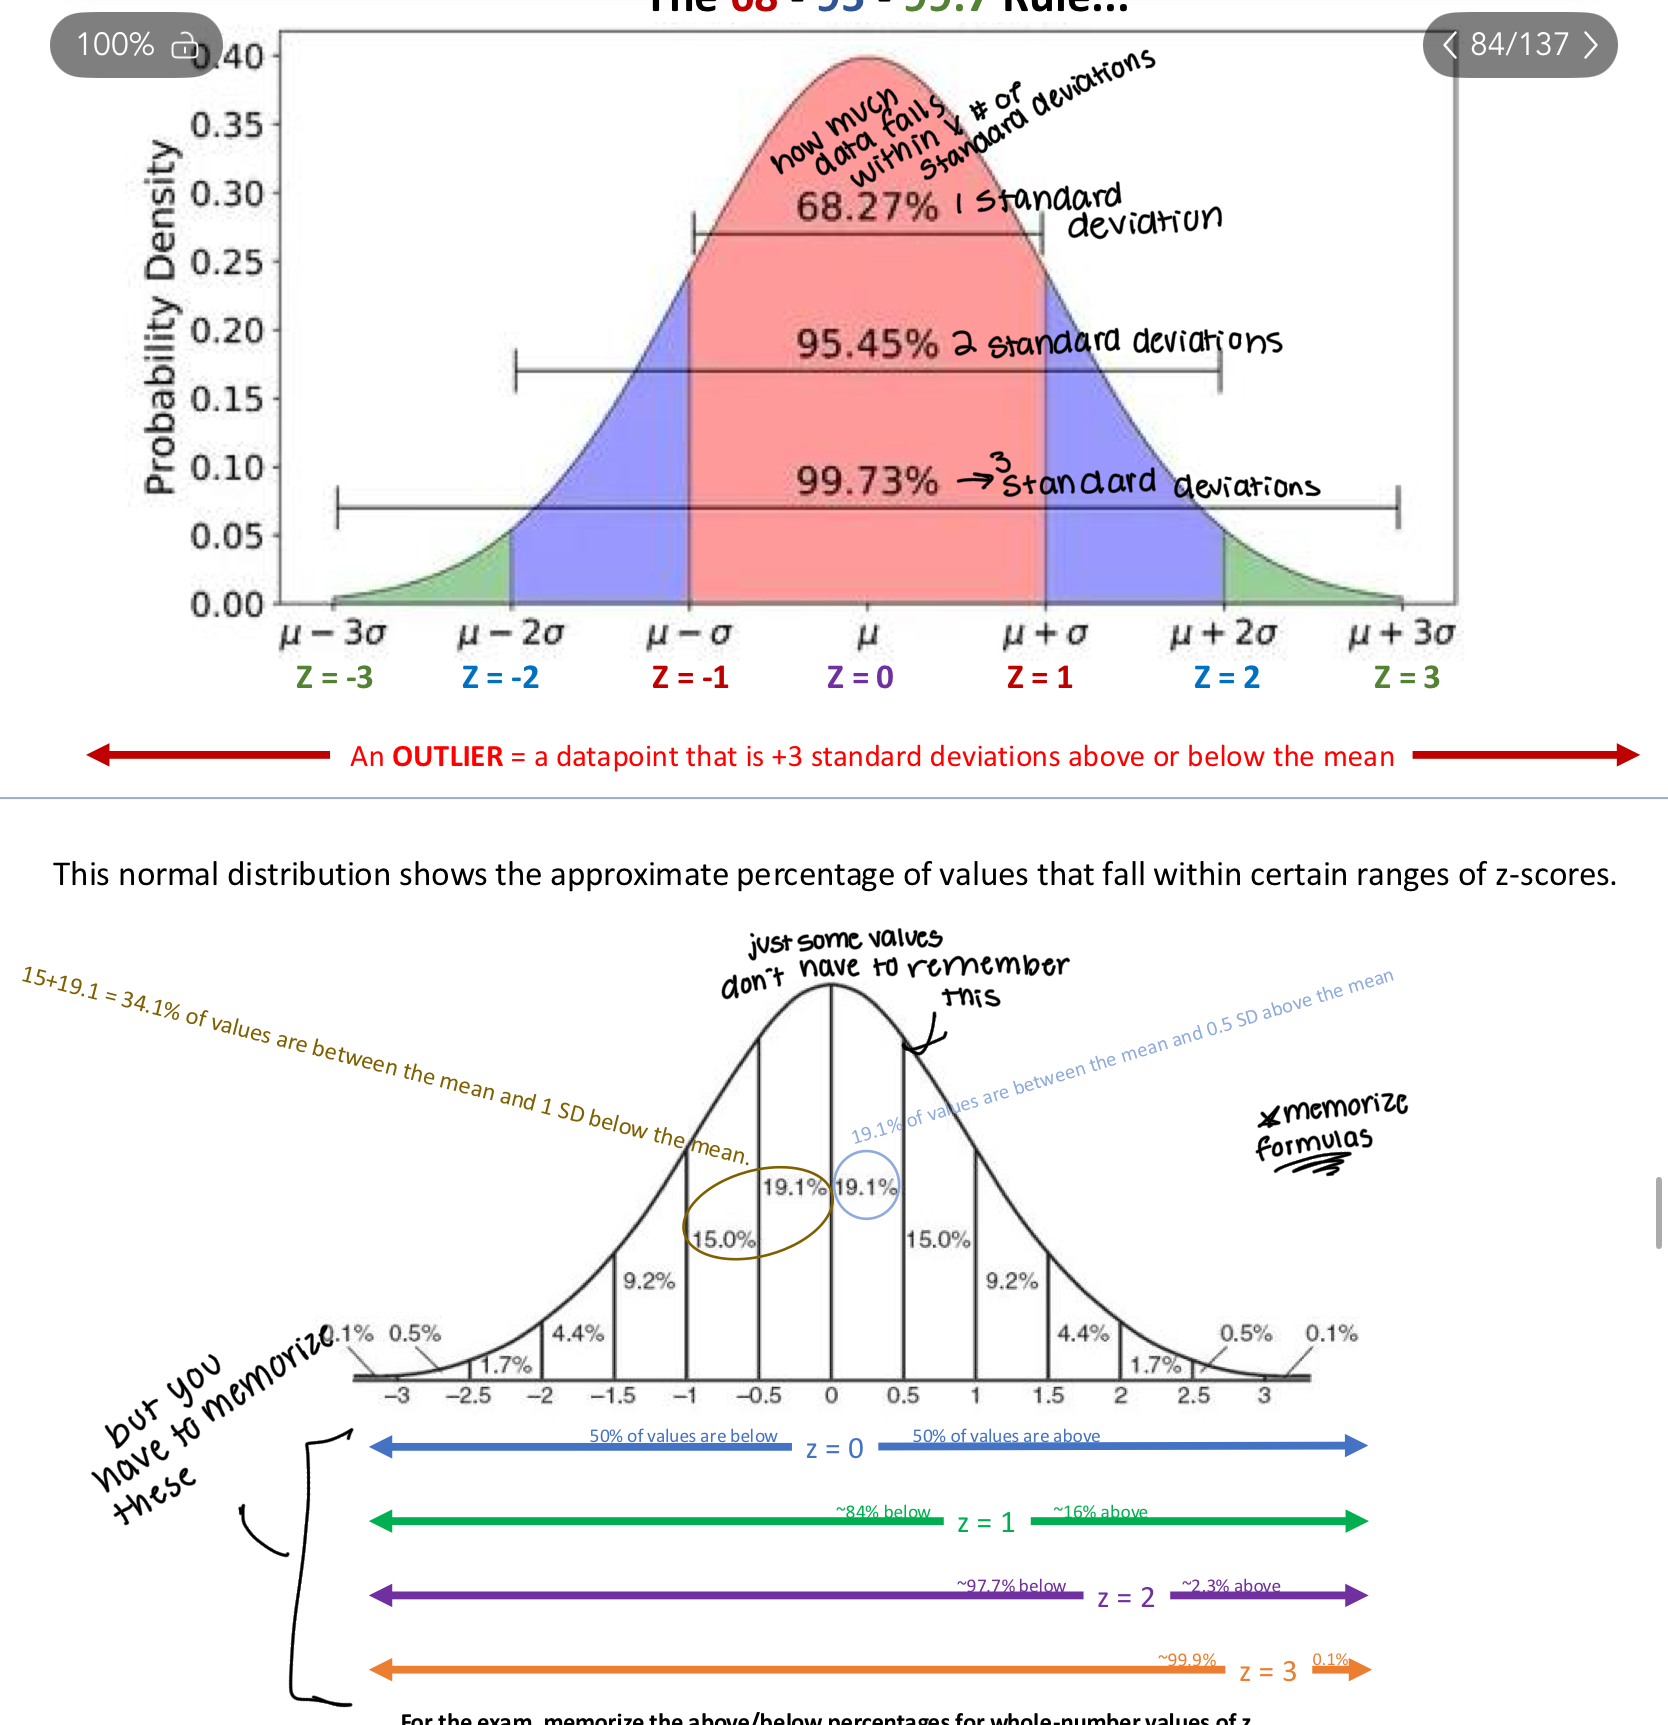
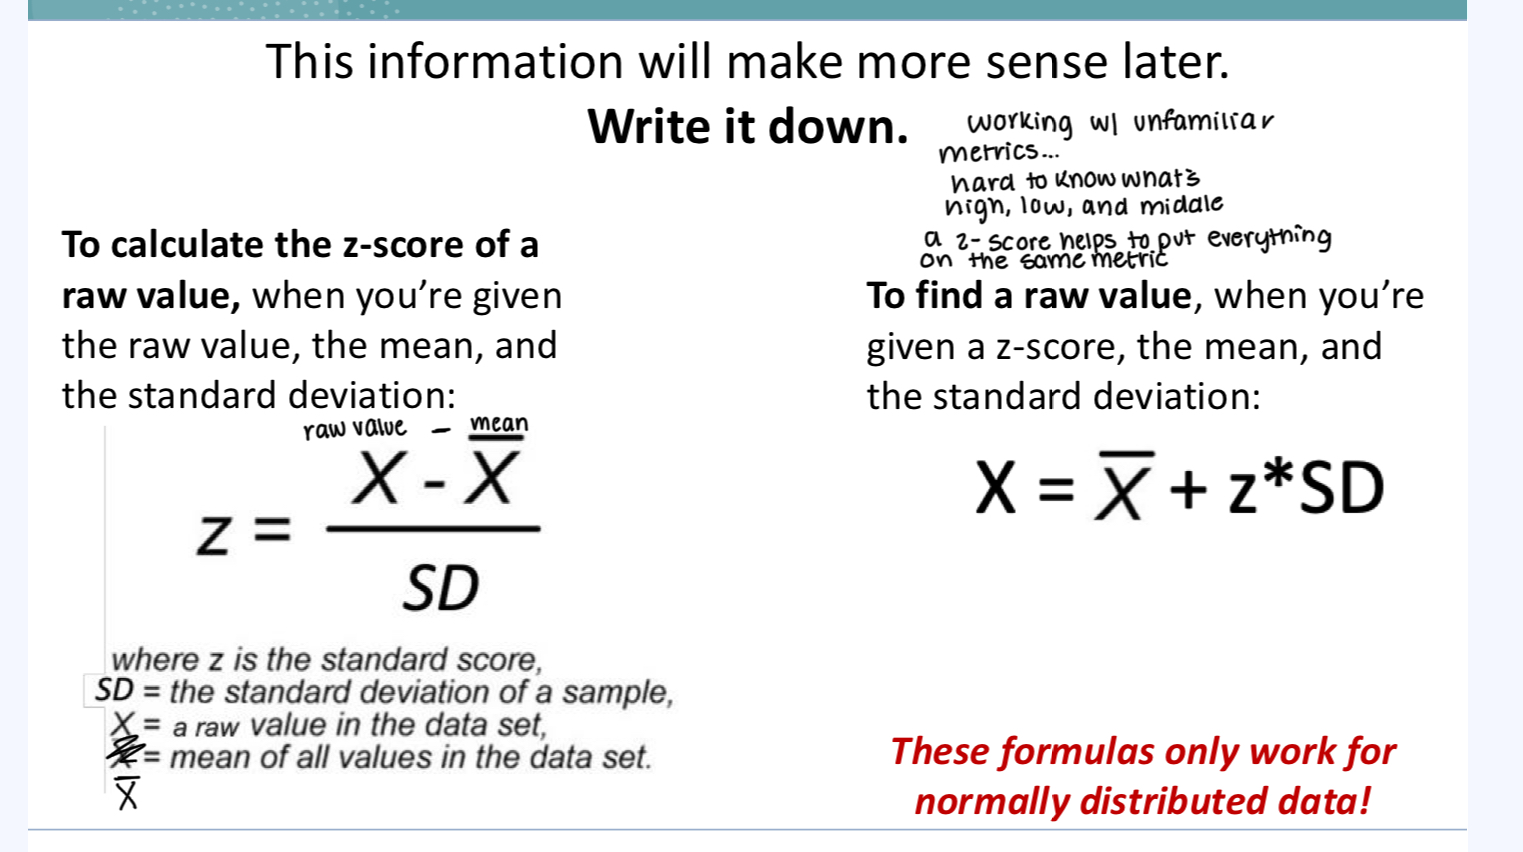
Z- score
A numerical measurement that describe’s a value’s relationship to the mean of a group of values and is measured in terms of standard deviations from the mean
To calculate the z-score of a raw value, when you’re given the raw value, the mean, and the standard deviation
To find a raw value, when you’re given a z-score, the mean, and the standard deviation:
These formulas only work for normally distributed data!
standard deviation = a universal unit of measurement.
z = 1 → the observation is 1 standard deviation above the mean.
z = -3 → the observation is 3 standard deviations below the mean.
This is useful because... “The standard amount” by which a given value in the distribution tends to differ from the mean
The 68-95-99.7 rule and the z score percentages I have to memorize