UNIT 7 COMBINED
1/79
There's no tags or description
Looks like no tags are added yet.
Name | Mastery | Learn | Test | Matching | Spaced | Call with Kai |
|---|
No analytics yet
Send a link to your students to track their progress
80 Terms
4 mechanisms of Evolution
Natural selection: Individuals with advantageous traits leave more offspring.
Genetic drift: Random changes in allele frequencies (strongest in small populations).
Gene flow: Movement of alleles between populations (migration).
Mutation: Random changes in DNA that create new variation.
Gene Pool
The sum of all alleles for all genes in a population.
Used to measure genetic variation in the population.
More variation → greater ability to adapt to environmental changes.
Allele frequency
Definition: Proportion of a specific allele in a population.
Formula: number of copies of the allele ÷ total number of alleles.
A change in allele frequencies over generations = evolution.
Genotype frequency
proportion of each genotype among individuals in the population
Allele
variation of a gene
Microevolution and macroevolution
Microevolution
Small-scale changes in allele frequencies within a population.
Occurs over short time periods.
Caused by mechanisms like natural selection, genetic drift, gene flow, mutation.
Macroevolution
Large-scale evolutionary changes above the species level.
Occurs over long time periods.
Includes speciation, extinction, and diversification of species.
Monomorphic vs. Polymorphic (AP-ready)
Monomorphic
Only one allele at a locus.
Allele frequency = 1 (fixed).
Polymorphic
Two or more alleles present at a locus.
Indicates genetic variation in the population..
Genetic structure
frequency of alleles and genotypes of a population.
Hardy-Weinberg Equilibrium
Hardy-Weinberg Equilibrium (AP-ready)
Definition: Allele frequencies do not change across generations → no evolution.
Allows calculation of genotype frequencies from allele frequencies.
Equations
p+q=1p + q = 1p+q=1 (allele frequencies)
p2+2pq+q2=1p^2 + 2pq + q^2 = 1p2+2pq+q2=1 (genotype frequencies)
AA = p²
Aa = 2pq
aa = q²
Key ideas
Applies to one gene at a time.
Rare in real populations due to many variables.
If a population is in HW equilibrium → not evolving (allele frequencies stay constant).
can apply for 1 gene, but for a genome, there are many traits and conditions, so it is very unlikely
may reach equilibrium for some genes, it is unlikely for all genes within a genome
Conditions for Hardy-Weinberg equilibrium
No mutations
No gene flow (no migration)
No natural selection
Large (infinite) population → no genetic drift
Random mating
Assumptions
Population is diploid and sexually reproducing
Allele frequencies are the same in both sexes
Key idea
If any condition is violated → evolution is occurring
Genetic Drift
Definition: Random changes in allele frequencies due to chance.
Occurs in all populations, but strongest in small populations.
Not related to fitness (purely random).
Effects
Can cause harmful alleles to increase or beneficial ones to be lost.
Leads to loss of genetic variation.
Can result in fixation (allele frequency = 1) or loss of alleles.
Key idea
Allele frequencies change over generations by chance, not selection.
Bottleneck Effect
A sudden reduction in population size due to events (e.g., natural disasters).
Only a small, random group survives.
Causes genetic drift → allele frequencies change by chance.
Results in loss of genetic variation in the population.
Founder Effect
A small group leaves a larger population to start a new population.
The new group has a different allele frequency than the original population.
Causes genetic drift.
Results in reduced genetic variation and possible overrepresentation of certain alleles.
Evolutionary theory
Explains the mechanisms of evolutionary change (e.g., natural selection).
Allows scientists to make predictions about biological systems.
Applications:
Disease research and treatment (e.g., antibiotic resistance)
Crop and industrial development
Understanding the diversification of life
Explaining species interactions
Evolution
Definition: Change in the allele frequencies of a population over time.
Populations evolve, not individuals.
Descent with modification
Species change over time and give rise to new species.
All species share common ancestors.
Divergent species come from a common ancestor.
Mechanism
Main mechanism: natural selection.
Individuals vary in traits → environment selects which traits increase survival and reproduction.
Leads to adaptations over generations.
Key ideas
Evolution explains the patterns of relationships among organisms (phylogeny).
“Survival of the fittest” = individuals with advantageous traits leave more offspring.
Population
a group of individuals of a single species that live and interbreed in a particular geographic area at the same time.
What do you need for natural selection
Variation
Individuals in a population have different heritable traits.
Mechanism of inheritance
Traits are genetically passed from parents to offspring.
Natural forces (selection pressures)
Environmental factors favor certain traits, leading to differences in survival and reproduction.
Natural Selection
Definition: Environmental factors select for heritable variation in a population.
Key conditions
Variation exists among individuals.
Variation is heritable (from mutations, sexual reproduction, germline).
Resources are limited → competition.
Process
Individuals with advantageous traits survive and reproduce more.
These traits are passed to offspring.
Trait frequency increases over generations.
Outcome
Populations become adapted to their environment over time.
Important notes
Acts on existing variation (does not create new traits).
What is “beneficial” depends on the environment.
Owl Eye Butterfly
Butterflies have large eye-like spots on their wings.
These spots mimic the eyes of predators (like owls).
Predators are less likely to attack, increasing survival.
Individuals with larger/more effective spots reproduce more.
Over generations, the trait becomes more common in the population.
Example of adaptation through natural selection (anti-predator defense).
Darwin’s mechanism of natural selection depends on:
1. Heritable variation in a population;
2. Overproduction of offspring (competition);
3. Differential survival and reproduction;
4. Increase in frequency of beneficial traits in the population over time.
Principles of Natural Selection
Variation exists and is heritable within a population.
More individuals are produced than can survive → competition.
Individuals with advantageous traits have higher survival and reproduction (differential fitness).
Favorable traits increase in frequency in the population over time.
Mutations vs Natural Selection
Mutations
Occur randomly without environmental pressures
Create new genetic variation (new alleles).
Natural Selection
Nonrandom process.
Acts on existing variation.
Favors adaptive traits that increase survival and reproduction (fitness).
Key idea
Mutations provide the raw material, natural selection shapes it.
artificial selection
humans select desirable traits in agricultural products/animals, rather than allowing species to evolve and change gradually without human interference
Adaptation
An adaptive trait is a heritable trait favored by natural selection.
Adaptation also refers to the process by which populations become better suited to their environment.
Individuals with deleterious mutations are less likely to survive and reproduce → their alleles decrease in frequency.
Sexual Selection
Mates are chosen based on phenotypic traits (e.g., bright feathers).
Traits increase reproductive success, not necessarily survival.
Often involves a trade-off: attracting mates vs. attracting predators.
Can involve visual traits, behaviors, scents, or calls
Qualitative vs Quantitative Traits
Qualitative traits
Controlled by one gene (one locus)
Show discrete categories (e.g., black vs. white)
Quantitative traits
Controlled by multiple genes (polygenic)
Show continuous variation (e.g., height, body size)
Natural selection can act on quantitative traits in three ways:
Stabilizing selection: Favors intermediate (average) phenotypes → reduces variation.
Directional selection: Favors one extreme → shifts the population mean.
Disruptive selection: Favors both extremes → increases variation, may split population.
• Stabilizing selection
Favors average (intermediate) phenotypes.
Mean stays the same.
Reduces variation in the population.
• Directional selection
Favors one extreme phenotype.
Shifts the mean in that direction.
Can reduce variation as one trait becomes more common.
Disruptive selection
Disruptive selection favors individuals that vary in both directions from the mean.
Increases variation in the population; can result in a bimodal distribution of traits.
Mutations & Natural Selection
Not all mutations affect natural selection.
Silent mutations
Do not change the protein.
Do not affect phenotype → not selected for or against.
Mutations that change proteins
Can be beneficial → selected for.
Can be neutral → no effect on selection.
Can be harmful → selected against.
Key idea: Natural selection only acts on mutations that affect phenotype.
Mutation Rates & Molecular Clock
Functional genes mutate more slowly due to selective pressure.
Mutation rates are relatively constant over time.
These consistent changes can be used as a molecular clock to estimate evolutionary time.
Neutral theory
the majority of evolutionary changes at the molecular level (DNA and protein sequences) are caused by random genetic drift of selectively neutral mutants, rather than natural selection. I
most genetic variation within species is neither advantageous nor disadvantageous
Evolution at the molecular level is often driven more by drift than selection.
LUCA
LUCA (Last Universal Common Ancestor)
The most recent common ancestor of all life on Earth.
Not the first life, but the ancestor shared by all current organisms.
Likely had:
DNA as genetic material
Ribosomes for protein synthesis
Cell membrane
Supported by universal genetic code and shared biochemical pathways across all life.
Phylogenic tree
Represents common ancestry and relatedness of organisms.
A hypothesis, not a fact.
Branches show evolution from common ancestors.
Closer recent common ancestor → more closely related species.
Notes:
Vertical distances between branches have no meaning.
Vertical order of lineages is arbitrary.
Parts of the phylogenic tree
Taxon – a group of species designated for study.
Clade – a taxon including all evolutionary descendants of a common ancestor.
Derived traits – characteristics that provide evidence of common ancestry.
Ingroup – the group of organisms being primarily studied.
Outgroup – a related group outside the ingroup, used as a reference point.
Node – a branching point representing a common ancestor of descendant lineages.
Polynomy
a node in a phylogenetic tree that branches into three or more lineages instead of the usual two.
Indicates uncertainty or lack of resolution about the exact evolutionary relationships among those lineages.
Often occurs when there is insufficient data to determine the precise order of divergence.
Evidence for phylogenic trees
morphology, internal anatomy, behaviors, biochemical pathways, DNA and protein, fossils
Parisomy
when building phylogenetic trees or cladograms, choose the tree that requires the fewest evolutionary changes.
The simplest explanation is preferred.
Minimizes assumptions about trait changes.
Helps infer the most likely evolutionary relationships.
Morphology
Study of presence, size, shape, or other attributes of body parts.
Use: Most extinct species’ phylogenies rely on morphology. Fossils help identify ancestral vs. derived traits and divergence times.
Limitations:
Some taxa have few morphological differences.
Hard to compare distantly related species.
Environmental factors can cause morphological variation.
Evidence Used in Phylogenetics
Morphology: Presence, size, shape, or other body part attributes.
Development: Similar developmental patterns reveal evolutionary relationships.
Behavior: Genetically based behaviors can help reconstruct phylogenies.
Molecular Data: DNA sequences (nuclear, chloroplast, mitochondrial) and amino acid sequences show evolutionary relationships.
Taxonomy levels
Domain – largest, most inclusive category.
Kingdom
Phylum
Class
Order
Family
Genus
Species
Subspecies – most specific; populations with slight genetic differences.
Note: The lower you go in the hierarchy, the fewer members and the more genetic differences they show, determined through DNA and evolutionary relationships.
Paraphyletic
A group of organisms that includes a common ancestor but not all of its descendants.
Leaves out some lineages that also descended from that ancestor.
Example: Reptiles are paraphyletic if birds are excluded, because birds share a common ancestor with reptiles.
Polyphyletic
A group of organisms that does not include the most recent common ancestor of all members.
Members come from different evolutionary lineages.
Example: Grouping bats and birds together as “flying animals” is polyphyletic, because their common ancestor did not have wings.
Monophyletic
A group of organisms that includes a common ancestor and all of its descendants.
Represents a complete branch on a phylogenetic tree.
Example: Mammals form a monophyletic group because they include the common ancestor of all mammals and all its descendants.
Vicariance Model
Explains how geographic barriers (mountains, rivers, oceans) split populations, leading to speciation.
Populations become isolated, preventing gene flow.
Over time, genetic divergence occurs, producing new species.
Example: Formation of the Isthmus of Panama separated marine species into Atlantic and Pacific populations.
Divergent Evolution
A common ancestor gives rise to multiple species over time.
Species become increasingly different due to different environments/selective pressures.
Indicates common ancestry.
Convergent Evolution
Unrelated species develop similar adaptations.
Occurs due to similar environmental pressures.
Does not indicate recent common ancestry.
Parallel Evolution
Occurs when related species with a similar ancestral trait evolve similar changes independently.
The starting trait is already similar due to common ancestry.
Often involves similar underlying genes.
Key distinction
Parallel: similar starting point + similar changes.
Convergent: different starting point → similar traits evolve.
Coevolution
Two species are evolving in response to one another
Expected between species that interact often
Evidence of evolution
anatomy, embryology, molecular biology, biogeography, direct observation, fossils
Morphological evidence
Closely related species share more features due to a recent common ancestor.
Types of structures
Homologous structures
Same developmental origin, may have different functions.
Indicate common ancestry.
Associated with divergent evolution.
Analogous structures
Different origins, similar function.
Do not indicate common ancestry.
Result of convergent evolution.
Vestigial structures
Remnants of ancestral traits.
Have little or no current function.
Geographical evidence
The distribution of species across locations reflects their evolutionary history.
Species in nearby regions are more closely related than those far apart.
Isolation (e.g., islands, continents) leads to divergent evolution/speciation.
Island species often resemble the nearest mainland species.
Continental drift explains similarities in species across distant continents.
Molecular Biology Evidence
Fewer differences in DNA or amino acid sequences → closer evolutionary relationship.
More differences → more distant relationship.
Applies to both protein (amino acid) and DNA sequences.
Key ideas
All life uses DNA and a universal genetic code → supports common ancestry.
Similar gene expression processes indicate shared origin.
Homologous genes = inherited from a common ancestor.
Mutations
Occur rarely and accumulate over time.
Used to trace evolutionary relationships (molecular comparisons)
Evidence from Developmental Biology - Embryology
Similar embryonic development among species indicates common ancestry.
Early embryos of different species often show shared structures (e.g., pharyngeal pouches, tails).
These similarities reflect shared developmental genes and pathways.
Differences appear later as organisms specialize.
Direct Observation
Evolution can be observed in real time.
Examples:
Antibiotic resistance in bacteria
Pesticide resistance in insects
Shows natural selection acting on existing variation.
Provides direct evidence that populations evolve over generations.
Fossil record
Provides evidence of past life and evolutionary change over time.
Shows transitional forms between ancestral and modern species.
Documents extinction and appearance of new species.
Older fossils are found in deeper rock layers (strata) → helps build timelines.
Radiometric dating determines the absolute age of fossils.
Not all organisms fossilize, so the record is incomplete.
Supports common ancestry and descent with modification.
Carbon Dating
Formation:
Cosmic radiation converts ¹⁴N → ¹⁴C (carbon-14).
Incorporation:
¹⁴C forms CO₂ and enters the atmosphere and oceans.
Taken up by plants, then passed through food chains.
While alive:
Organisms maintain a constant level of ¹⁴C.
After death:
No more intake → ¹⁴C decays back to ¹⁴N (beta decay).
Decay occurs at a constant rate.
Half-life:
~5730 years (half of ¹⁴C decays).
Use:
Determines the age of recent fossils/organic material.
Species
A group of organisms that can interbreed and produce fertile offspring.
Members share a common gene pool.
Often defined by reproductive isolation from other groups.
Can be identified using morphology, genetics, behavior, or ecological niche.
Speciation
The process by which new species arise.
Requires reproductive isolation between groups.
Morphological species concept: individuals that look alike are the same species.
Biological species concept: individuals that actually or potentially interbreed and produce fertile offspring are the same species.
Occurs when isolated groups diverge genetically over time.
Biological Species Concept limitations with asexual organisms
Does not apply to asexual species because they do not interbreed.
Cannot determine species boundaries based on reproductive isolation.
Alternative methods (e.g., morphology, genetics, ecology) must be used to define species.
Dobzhansky-Muller Model
A population splits into two isolated groups that evolve independently.
In each group, new alleles become fixed at different loci.
The new alleles from the two groups are genetically incompatible.
Over time, this incompatibility can prevent interbreeding if the groups reunite.
Reproductive isolation
Necessary to keep two diverging groups as separate species.
Members of the groups cannot produce viable or fertile offspring together.
Can occur before fertilization (prezygotic) or after fertilization (postzygotic).
Allopatric Speciation
Occurs when populations are separated by a physical/geographic barrier (e.g., continental drift, sea level changes, glaciers, climate shifts).
Populations evolve independently through genetic drift and adaptation to their environments.
Genetic divergence can become so great that even if the barrier is removed, interbreeding is no longer possible.
Sympatric speciation
Speciation occurs without physical/geographic isolation.
Can happen when populations occupy the same area but mating is restricted to certain microhabitats or among individuals with specific phenotypes.
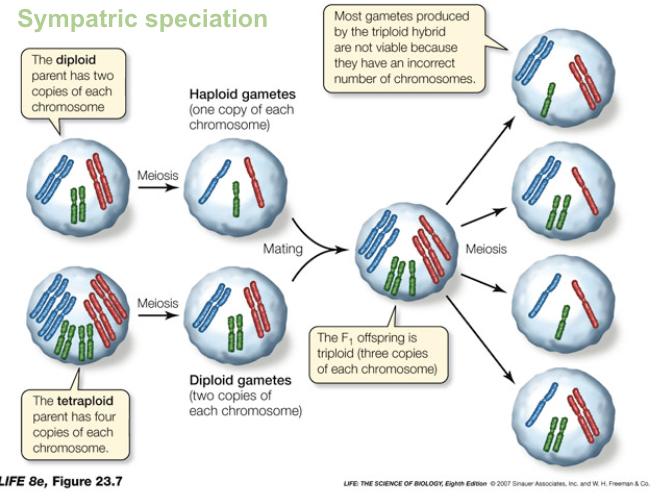
Polyploidy Sympatric Speciation
Two unreduced diploid gametes combine → tetraploid individual.
Tetraploids are reproductively isolated from diploids (hybrids are triploid and usually sterile).
Tetraploids can self-fertilize or mate with other tetraploids.
Polyploidy can create complete reproductive isolation in just two generations.
Prezygotic Isolation
prevent hybridization before fertilization:
Mechanical isolation – reproductive organs incompatible; in plants, may involve different pollinators.
Temporal isolation – species breed at different times (season or time of day). Example: leopard frogs.
Behavioral isolation – individuals fail to recognize mating behaviors. Examples: frog calls, male cichlid coloration.
Habitat isolation – closely related species prefer different habitats for living or mating.
Gametic isolation – sperm and eggs of different species cannot fuse; important in aquatic animals that release gametes into water.
Postzygotic Isolation
reduce fitness of hybrid offspring:
Low hybrid zygote viability – fertilized egg fails to develop properly.
Low hybrid adult viability – offspring survive to adulthood but are weak or die early.
Hybrid infertility – offspring are sterile, often due to mismatched chromosomes that prevent proper meiosis.
Hybrid Zones
regions where two closely related species meet and interbreed, producing hybrid offspring.
Can be narrow or wide depending on the degree of reproductive isolation.
Hybrids may have lower fitness than parent species, limiting gene flow.
Hybrid zones can persist over time, fade away, or lead to the formation of new species if hybrids become reproductively isolated.
Relative Dating of rocks
Relative dating of rocks can be done using the law of superposition
Law of Superposition: in undisturbed rock layers, older layers are at the bottom and younger layers are at the top.
Extinction Events
Extinction events occur when geologic or environmental changes cause species to adapt or die out.
Mass extinctions are identified in the fossil record as sharp decreases in species diversity and abundance.
During these events, the rate of extinction exceeds the normal background rate.
K-T event - Cretaceous Extinction
K–T (Cretaceous–Tertiary) event marked by an iridium-rich layer at the boundary.
Caused by a massive asteroid impact (~size of Mount Everest) in the Yucatán Peninsula.
Effects: particulates blocked sunlight, forests burned, photosynthesis decreased, global temperature and rainfall changed.
Resulted in ~75% of species going extinct.
Adaptive radiation
Adaptive radiation – rapid diversification of a single ancestral species into multiple species, each adapted to a different ecological niche.
Driven by availability of new habitats, resources, or after mass extinctions.
Examples: Darwin’s finches on the Galápagos, cichlid fish in African lakes.
abiogenesis
Abiogenesis – the natural process by which life arises from non-living matter.
Hypothesized to have occurred on early Earth through chemical reactions that produced simple organic molecules, eventually forming self-replicating systems.
Also called origin of life; distinct from evolution, which acts on already-living organisms.
Origin of earth
Origin of Earth – formed about 4.5 billion years ago (BYA).
Early Earth was hot and frequently bombarded by asteroids and celestial objects.
First life likely arose around 3.5–3.9 BYA, possibly after a lull in asteroid impacts when temperatures cooled enough for liquid water to condense.
Oparin Haldante Hypothesis
Life arose gradually from non-living matter through chemical evolution.
Early Earth had an O₂-poor atmosphere, where molecules could donate electrons.
Simple inorganic molecules reacted to form organic building blocks (amino acids, nucleotides) that accumulated in oceans.
Building blocks combined into larger, complex molecules in shallow pools.
Polymers assembled into structures capable of metabolism and replication.
Eventually, these macromolecules became enclosed in membranes, forming cell-like structures.
Miller-Urey
Tested Oparin–Haldane hypothesis: organic molecules can form spontaneously under reducing conditions.
Setup: Closed system with heated water + NH₃, CH₄, H₂, plus electric sparks to simulate lightning.
Results: After ~1 week, amino acids, sugars, lipids formed.
Limitations: No DNA or proteins formed.
Extension: Amino acids can be heated without water to form proteins.
Genes first hypothesis
Proposes that self-replicating RNA molecules (ribozymes) were the first genetic material.
RNA can store information and catalyze chemical reactions.
These RNA molecules could replicate themselves, providing a basis for natural selection before DNA or proteins existed.
Suggests that metabolism and cellular life evolved later around these RNA systems.
RNA World Hypothesis
Early life was based on RNA molecules that could store genetic information and catalyze chemical reactions.
RNA acted as both gene and enzyme (ribozymes).
Self-replicating RNA molecules enabled natural selection before DNA and proteins existed.
Later, DNA and proteins evolved, taking over information storage and catalysis, while RNA became specialized (e.g., in ribosomes and tRNA).
metabolism first hypothesis
Early life began with self-sustaining chemical networks (metabolic cycles) rather than genetic molecules.
Small molecules in the environment reacted spontaneously, forming energy-harnessing pathways.
These metabolic networks could grow, reproduce, and evolve before the existence of RNA or DNA.
Later, genetic molecules (RNA/DNA) emerged to store information, stabilizing and directing metabolism.