9. Hazard characterization
1/9
There's no tags or description
Looks like no tags are added yet.
Name | Mastery | Learn | Test | Matching | Spaced | Call with Kai |
|---|
No analytics yet
Send a link to your students to track their progress
10 Terms
Hazard characterization
Actions and interactions of the toxic compound within the organism and described the processes at organ, tissue, cellular and molecular levels
“effects of compounds”; dose response relations
Based on in vitro and or in vivo data
ADI vs TDI
ADI = For chemicals where we have a choice if we put it on the market
TDI = Cannot be avoided, e.g. PFAS
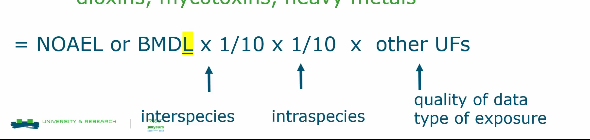
How do we derive an ADI/TDI
Expose cells/organisms to increasing concentration of a compound
Select endpoints to measure
Establish the best possible test (or follow the guidelines)
Data analysis and reporting
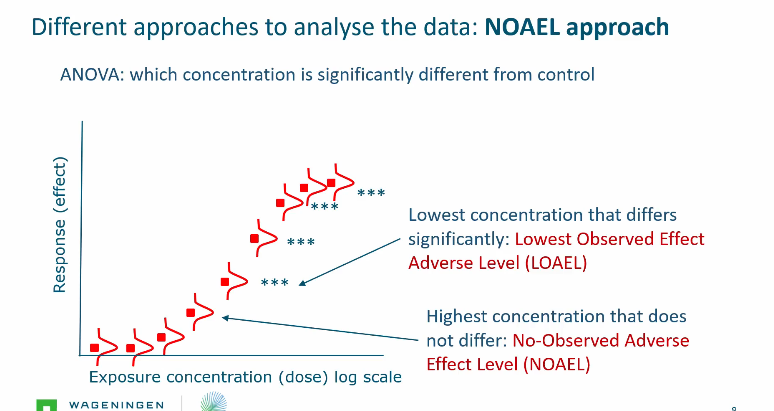
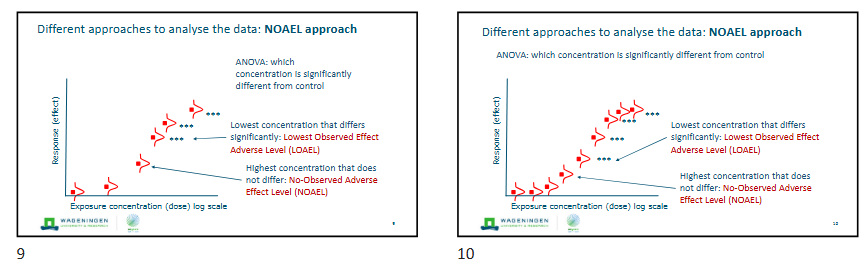
NOAEL approach
NOAEL: No-Observed-Adverse-Effect Level
t-test/ANOVA: can measure which concentration gives a significantly different response from the control
LOAEL: lowest concentration that differs significantly (Lowest observed effect adverse level)
NOAEL: Highest concentration that does not differ (No-Observed Adverse Effect Level)
Disadvantages of NOAEL approach
If there are less data points, LOAEL will be much lower compared to if there are more data points.
Therefore dependent on experimental design
If a company wants to use higher concentrations of a dangerous chemical they can do a bad study with little data points giving them a higher NOAEL - Gives bias
Hence NOAEL - NOAEL differ across studies
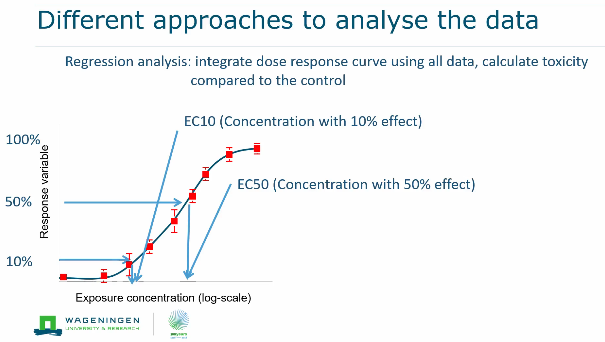
Regression analysis
Regression analysis: integrate the dose-response curve using all data and calculate toxicity compared to the control
Here gaps between data points are not a problem like in NOAEL because of the regression line
EC10 = concentration with 10% effect
EC50 = concentration with 50% effect
Advantages and disadvantages regression analysis
Advantages:
All data used
Independent on experimental design
Estimation of extent on effect
Disadvantages:
“no effect” concentrations not known
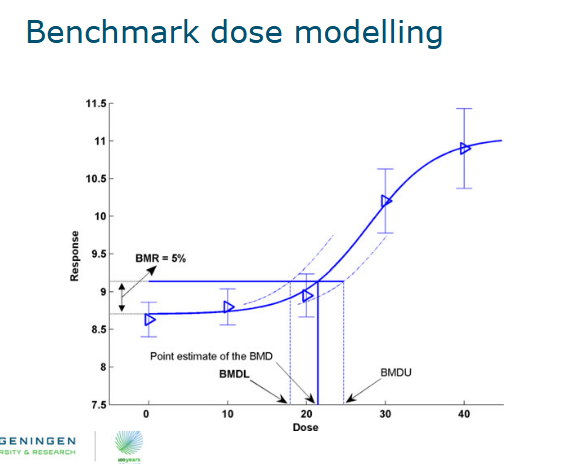
Benchmark dose modelling
In this approach the dose response curve is modelled and the dose at a specified critical response effect (benchmark response or BMR) is observed and calculated.
Benchmark Response (BMR): a 1 to 10 percent response above background level
BMD: Bench mark dose causing the BMR
When analyzing a dose-response with the BMD method the variation in responses is taken into account.
This results in the benchmark dose lower confidence limit (BMDL)
This is the dose at which the effect is smaller than the BMR (with defined confidence)
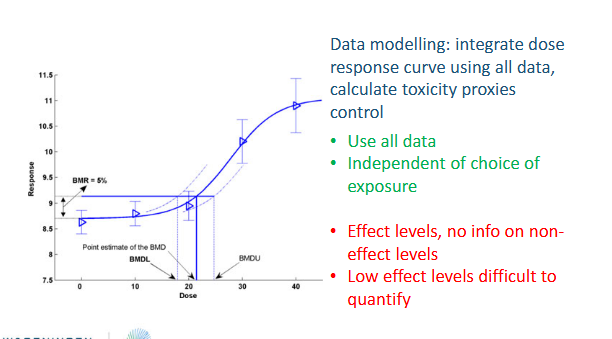
Advantages and disadvantages of benchmark dose approach
Advantage:
If a bad study is done, then the BMDL is much lower, which companies don’t want therefore they will do good studies so that they can use more of their chemicals
How are NOAEL BMDL corrected for uncertainty?