Statistics Flashcards
1/61
There's no tags or description
Looks like no tags are added yet.
Name | Mastery | Learn | Test | Matching | Spaced |
|---|
No study sessions yet.
62 Terms
summary statistic
a single number summarizing a large amount of data
ie. , the primary results of the study after 1 year could be described by two summary statistics: the proportion of people who had a stroke in the treatment and control groups.
Proportion who had a stroke in the treatment (stent) group: 45/224 = 0.20 = 20%. Proportion who had a stroke in the control group: 28/227 = 0.12 = 12%.
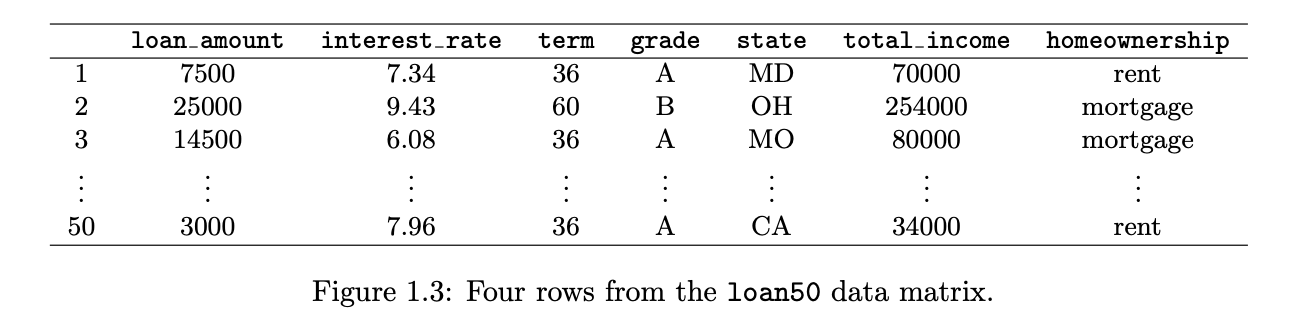
case/observational unit
formal name for a row
variables
the columns that represent characteristics
data matrix
a convenient and common way to organize data, especially if collecting data in a spreadsheet
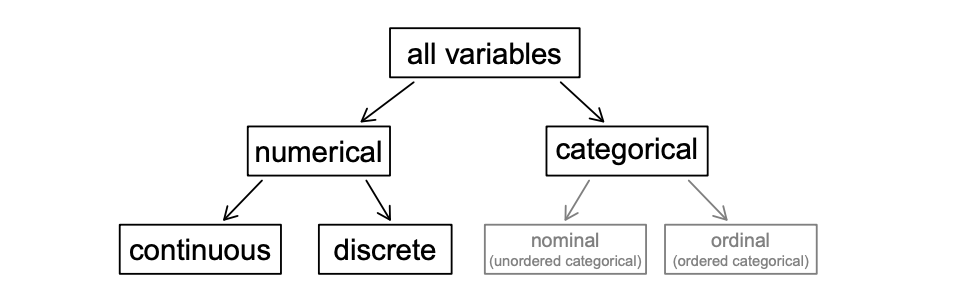
numerical variable
a variable that can take a wide range of numerical values, and it is sensible to add, subtract, or take averages with those values
ie. unemployment rate
discrete variable
a type of numerical variable where it can only take numerical values with jumps and can only take whole non-negative numbers (0, 1, 2, ...)
ie. population rate or number of children.
continuous variable
a type of numerical variable that can take any value within a given range, including fractions and decimals.
ie. unemployment rate
categorical variable
A variable that represents categories or groups and is not numerical in nature.
ie. states
levels
the possible values of a variable
ie. variable is states, then the level is AL, AK, WY, etc
ordinal variable
a categorical variable but the levels have a natural ordering
ie. educational level
nominal variable
a regular categorical variable without a type of special ordering
variables & their specializations
Explanatory (Independent) & Response (Dependent) Variables
observational study
One type of data collection where researchers collect data in a way that does not directly interfere with how the data arise
cohort
a group of many similar individuals
experiment
One type of data collection when researchers want to investigate the possibility of a causal connection
randomized experiment
When individuals are randomly assigned to a group in an experiment
placebo
fake treatment
ASSOCIATION DOESN’T EQUAL CAUSATION
In general, association does not imply causation, and causation can only be inferred from a randomized experiment.
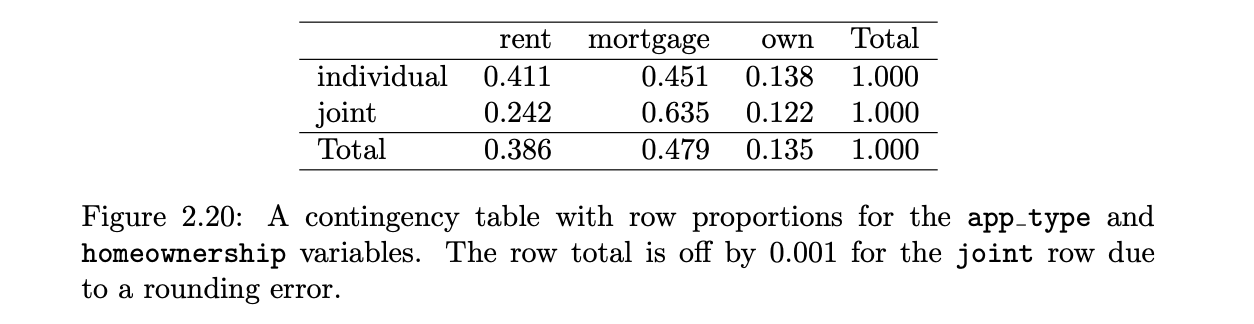
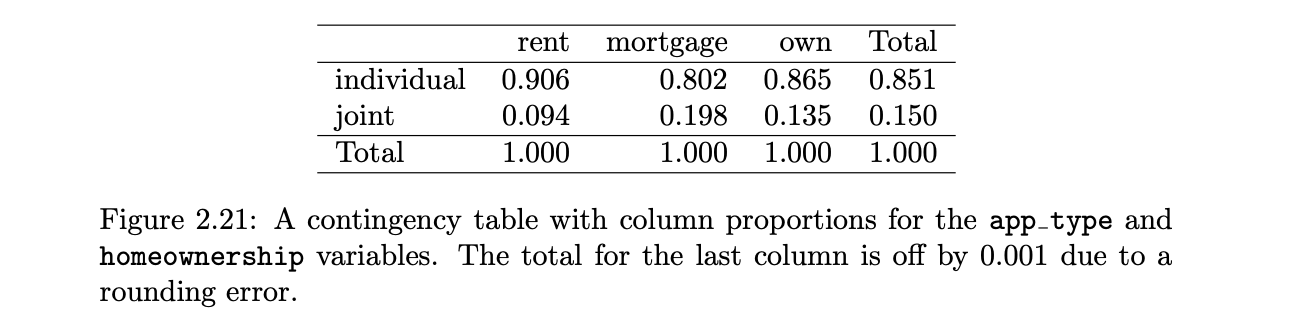
contingency table
A table that summarizes data for two categorical variables
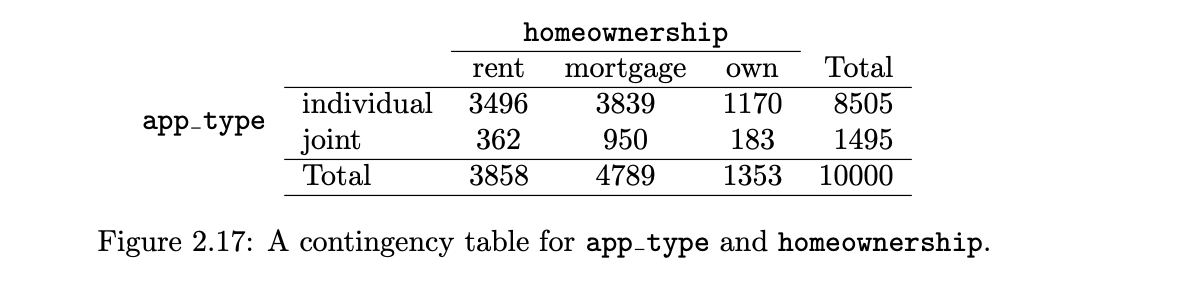
row totals
provide the total counts across each row
column totals
total counts down each column
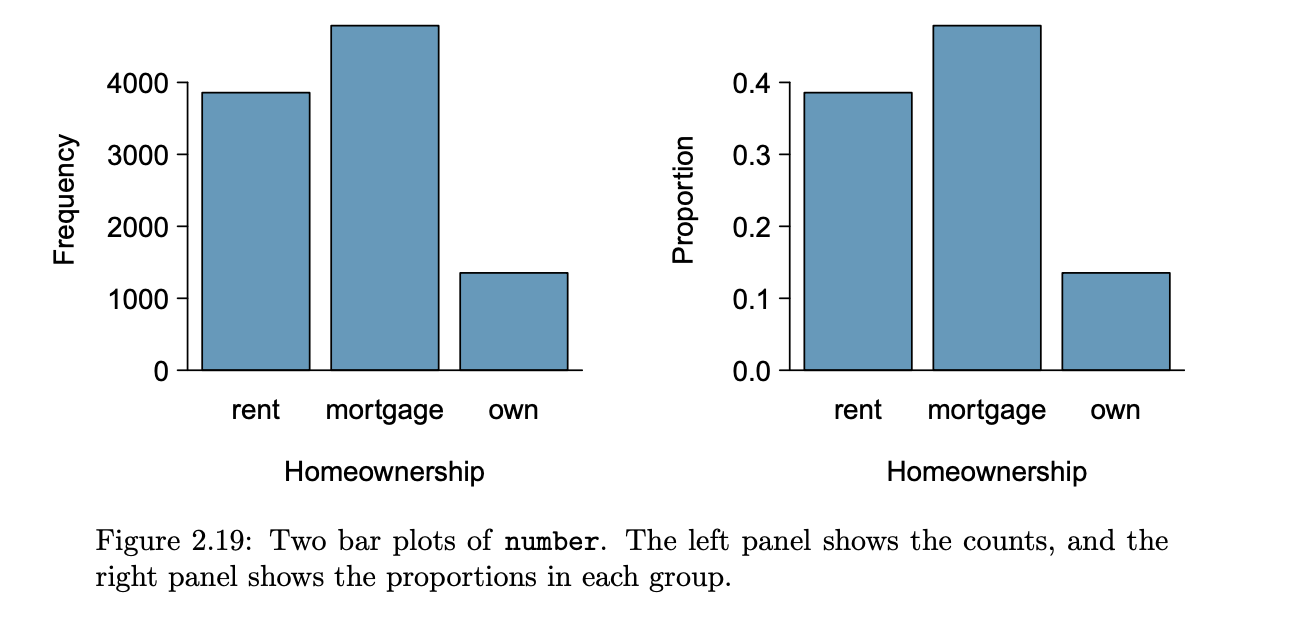
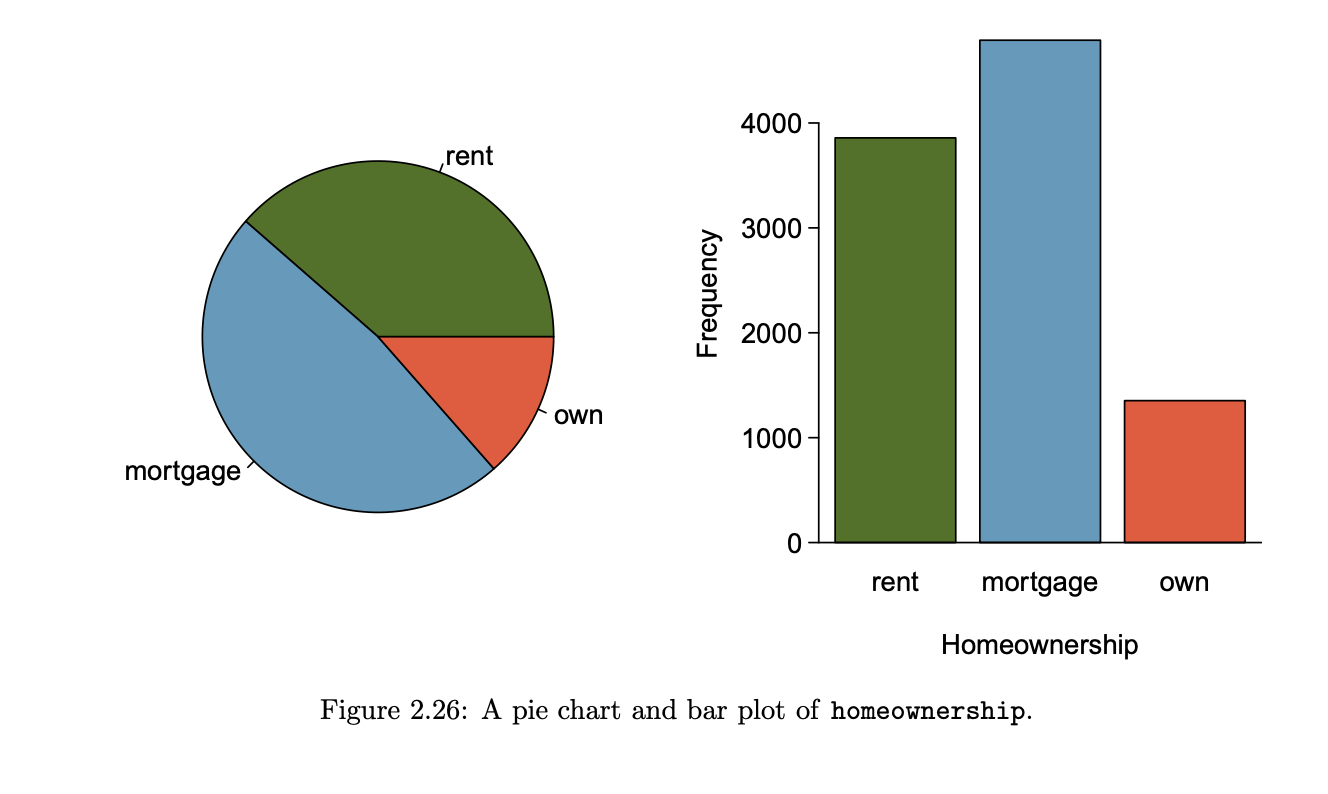
bar plot
row proportions
counts divided by their row totals
column proportion
count divided by the corresponding column total
stacked bar plot vs. side-by-side bar plot vs. standardized stacked bar plot
a graphical display of contingency table information
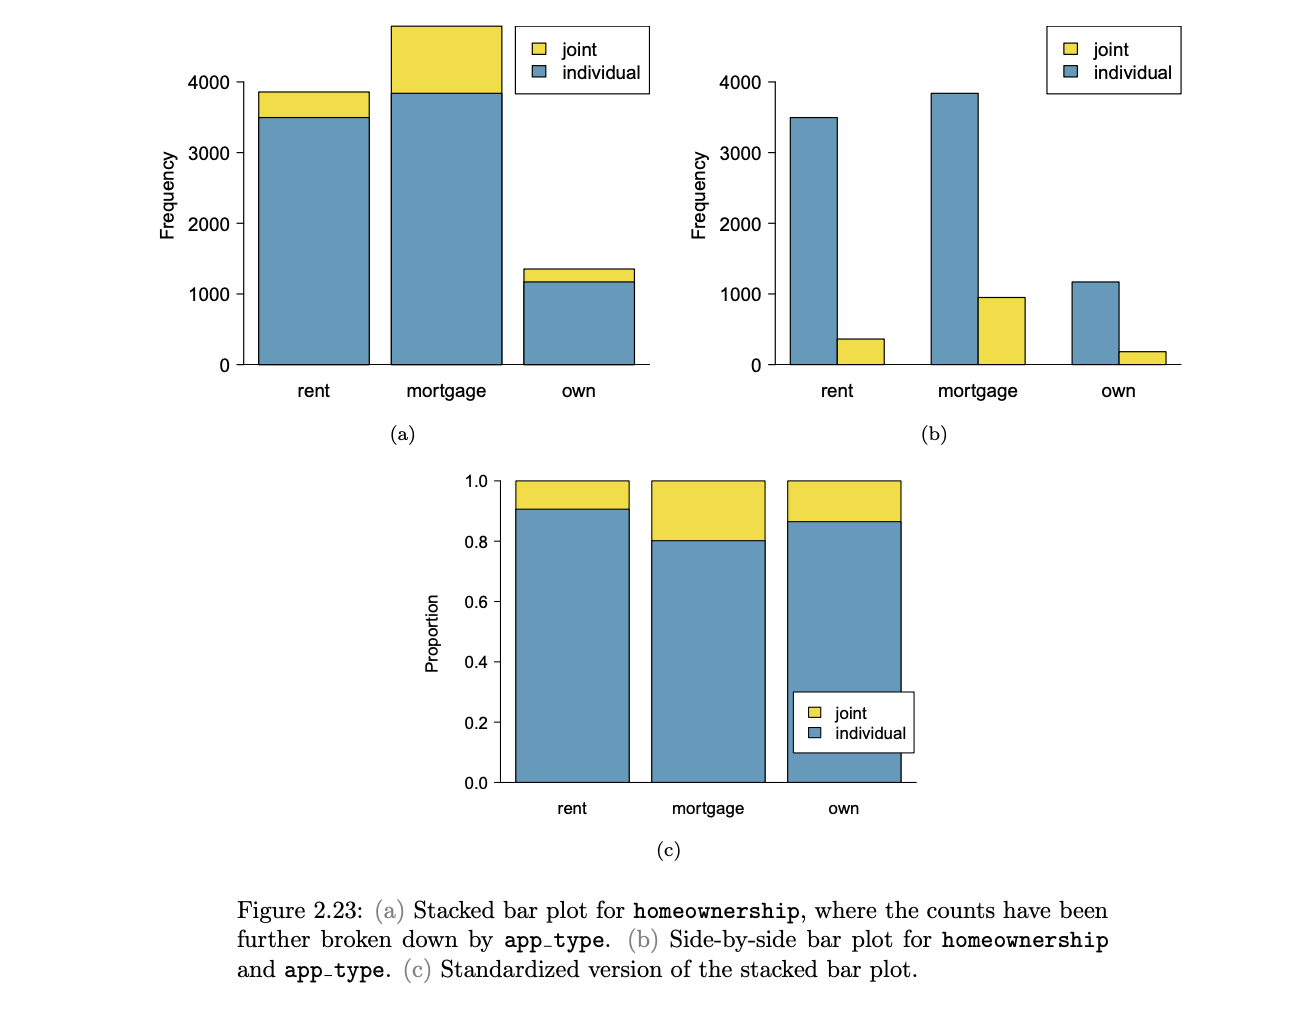
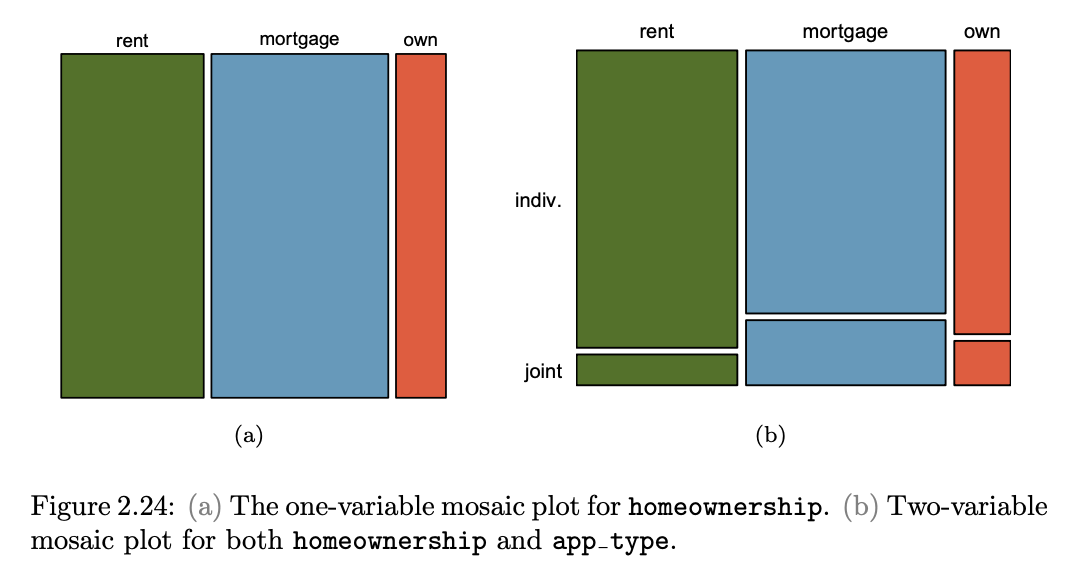
mosaic plot
a visualization technique suitable for contingency tables that resembles a standardized stacked bar plot with the benefit that we still see the relative group sizes of the primary variable as well.
pie chart
Useful for giving a high-level overview to show how a set of cases break down. However, it is also difficult to decipher details in a pie chart.
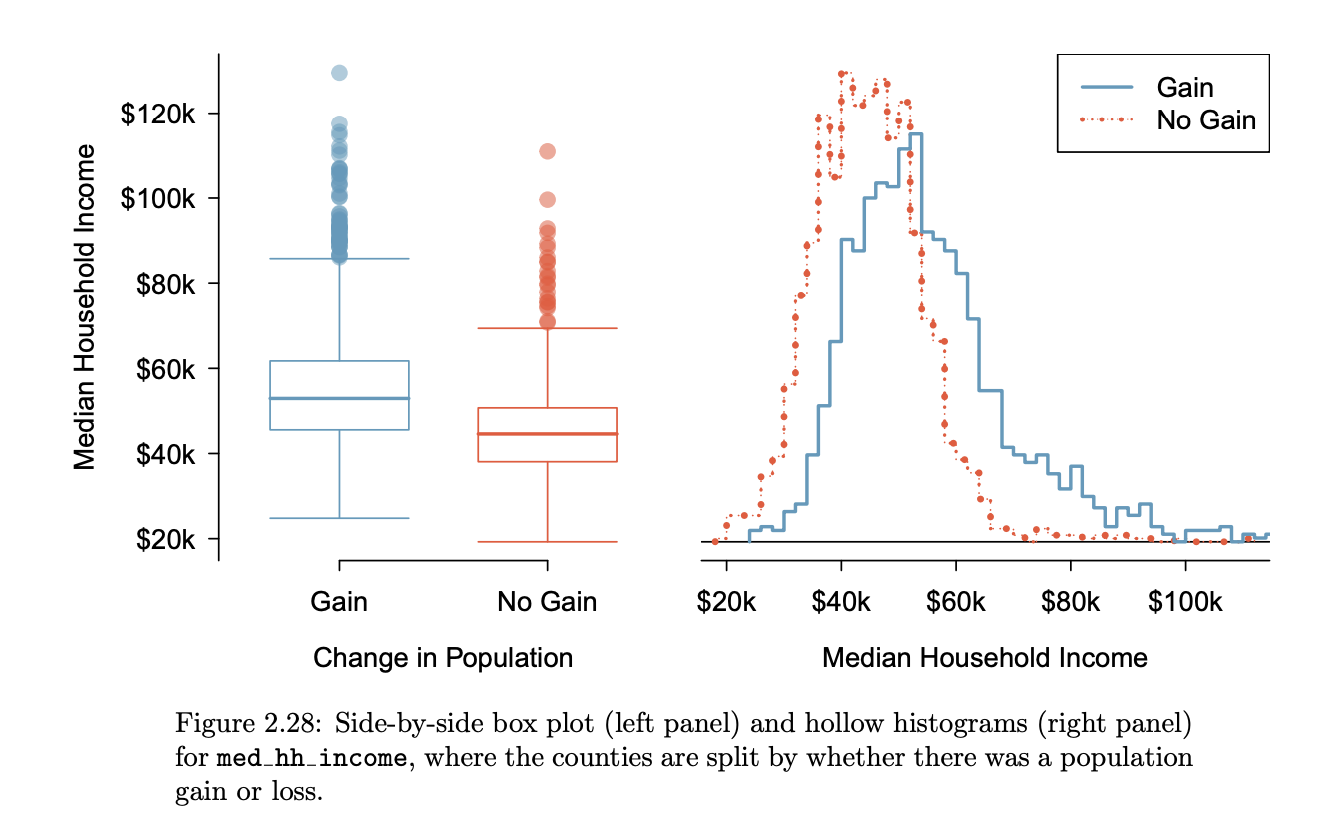
side-by-side box plot vs. hollow histogram
a traditional tool for comparing across groups vs. used to compare numerical data across groups
Cross-sectional
when all the data are collected at one point in time
time series
when all the data are collected over a period of time (ie. from 1946 to 2020)
categorical values & histogram
DO NOT MAKE A HISTOGRAM/COMPUTE MEAN OR SD FOR A CATEGORICAL VARIABLE
median & IQR (measure of center & variation)
when the data has significant skew
mean & standard deviation (measure of center & variation)
when the data is symmetric; in addition, they are more affected by extreme observations
left-skewed vs right-skewed on boxplots
left-skewed = median closer to Q3
right-skewed = median closer to Q1
Descriptive statistics are useful _
in that they are easy to calculate, summarize information efficiently, and allow for straightforward comparisons between groups.
Absolute Figure
Absolute figures can usually be interpreted without any context or additional information - a score, number, or figure has some intrinsic meaning
i.e When I tell you that I shot 83, you don’t need to know what other golfers shot that day in order to evaluate my performance
Relative Figure
A value or figure has meaning only in comparison to something else, or in some broader context, such as compared with the eight golfers who shot better than I did.
ie. If 43 correct answers falls into the 83rd percentile, then this student is doing better than most of his peers statewide. If he’s in the 8th percentile, then he’s really struggling. In this case, the percentile (the relative score) is more meaningful than the number of correct answers (the absolute score).
standard deviation
a measure of how dispersed the data are from their mean
roughly describes how far away the typical observation is from the mean
square root of the variance.
index
a descriptive statistic made up of other descriptive statistics
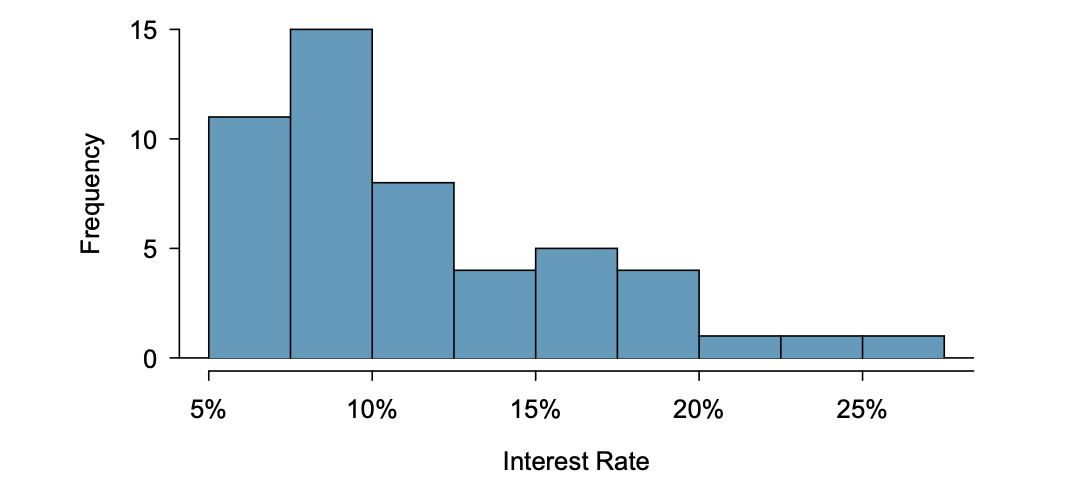
Histograms
a more heavily binned version of the stacked dot plot
provide a view of the data density
convenient for understanding the shape of the data distribution
right skewed vs. left skewed vs symmetric (ONLY DESCRIBED IN HISTOGRAMS/BOXPLOTS, THINGS WITH NUMERIC DATA NOT CATEGORICAL)
longer right tail (mean > median) vs. long left tail (mean < median) vs. equal trailing off both sides (mean = median)
mode
represented by a prominent peak in the distribution
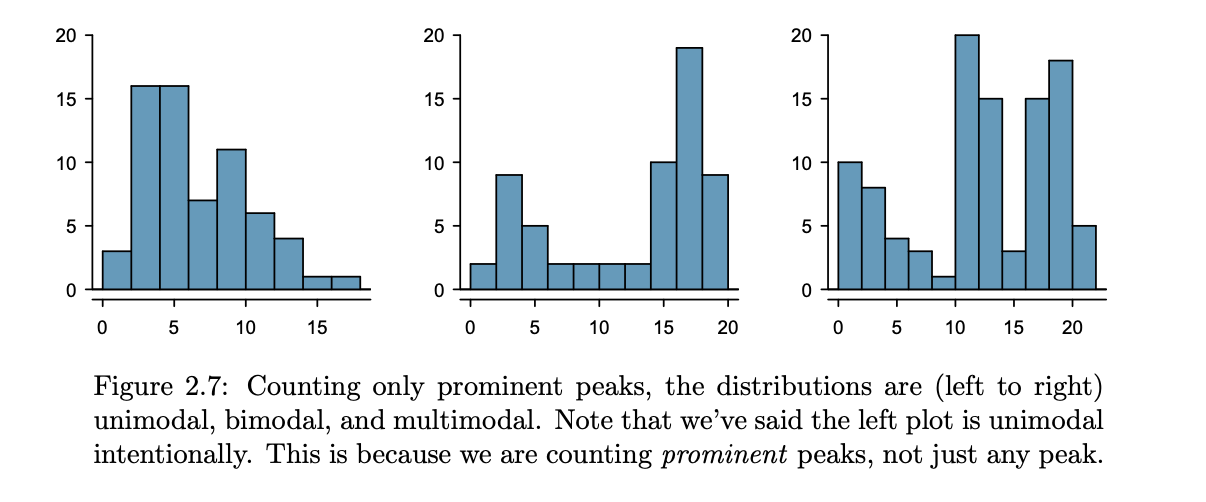
unimodal vs bimodal vs multimodal
multimodal - Any distribution with more than 2 prominent peaks
unimodal - one prominent peak & with a second less prominent peak that was not counted since it only differs from its neighboring bins by a few observations
variance
the average squared distance from the mean
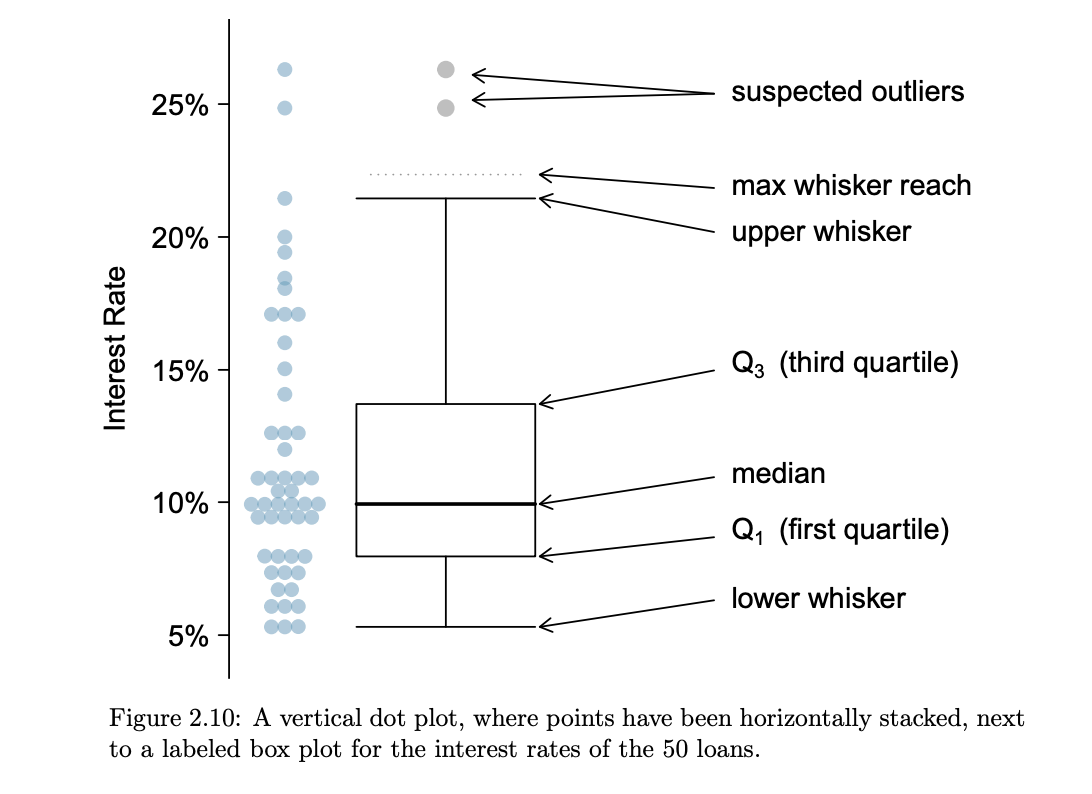
box plot
summarizes a data set using five statistics while also plotting unusual observations
median
splits the data in half
If the data are ordered from smallest to largest, the _ is the observation right in the middle. If there are an even number of observations, there will be two values in the middle, and the median is taken as their average.
interquartile range (IQR)
It, like the standard deviation, is a measure of variability in data. The more variable the data, the larger the standard deviation and IQR tend to be.
The is the length of the box in a box plot. It is computed as _ = Q3 − Q1 where Q1 and Q3 are the 25th and 75th percentiles.
first quartile (Q1)
the 25th percentile, i.e. 25% of the data fall below this value
third quartile (Q3)
the 75th percentile
finding outliers w/ IQR
Q3+1.5IQR = High Outlier
Q1-1.5IQR = Low Outlier
Range
Highest Value - Lowest Value
leverage
data points with extreme X values
influential points
outlier(s) that change the model
predictor variable
the independent or X variable in a linear relationship
correlation
measurement of the strength of a relationship between two numeric variables
A distinct pattern of some sort in a residual plot indicates that a linear model is NOT a good fit for the data.
If the X and Y axes were reversed on a scatterplot
any positive relationships would still appear as positive relationships.
Correlation (the degree to which two phenomena are related to one another) does not imply causation; a positive or negative association between two variables does not necessarily mean that a change in one of the variables is causing the change in the other
For example, I alluded earlier to a likely positive correlation between a student’s SAT scores and the number of televisions that his family owns. This does not mean that overeager parents can boost their children’s test scores by buying an extra five televisions for the house. Nor does it likely mean that watching lots of television is good for academic achievement.
coefficient of variations
a statistical measure that describes the relative variability of a dataset by taking the ratio of the standard deviation to the mean (CV = Standard Deviation / Mean)
It is a unitless value, often expressed as a percentage, that allows for the comparison of variability across different datasets or groups, especially those with different means or measurement units.
Empirical Rule
for a normal distribution, approximately 68% of the data falls within one standard deviation of the mean, 95% within two standard deviations, and 99.7% within three standard deviations.
This rule applies to symmetric, bell-shaped data and is used to estimate the percentage of values in specific intervals around the mean and to identify potential outliers.